The major cause of human loss in Cardiovascular Disease (CVD) is Cardiac problems, that are increasing day-by-day in the world. In order to achieve a great effort and to diagnose the cardiovascular disease, many people use different types of Mobile Electrocardiogram (ECG) in remote monitoring techniques. ECG Feature Extraction acts as an important role in diagnosing most part of the cardiac diseases. Now it has been comprehensively reviewed all way through for feature extraction of ECG signal analyzing, feature extracting, followed by classifying which has been planned a longtime ago. Here the authors have introduced soft computing techniques. To recognize the present situation of the heart, Electrocardiography and is an essential tool, but it is a time consuming process to analyze a continuous ECG signal as it may hold thousands of nonstop heart beats. At this point, the authors convert analog signal in to a digital one, vice versa, and it helps in accurately diagnosing the signal. Aim of this paper is to present a detection of some heat arrhythmias using soft computing techniques.
Electrocardiography deals among the electrical movement of the innermost blood circulatory system, that is the heart. The study of soft computing techniques for ischemia detection in long-duration ECGs are usually divided into three stages. In the first phase, the ECG signal is pre-processed in routing to remove noise. In the second phase, all the important ECG features are extracted and deliberated. Using the above features, in the third phase, each cardiac beat is classified as ordinary or ischemic. Neural Pattern Recognition (NPR) have frequently been used, since the apparatus for realizing the classifiers, which are capable to compacted even with nonlinear bias between the classes and to recognize the unfinished or indistinct input patterns [1-3]. Recently, the connectionist approach has been applied to the ECG analysis with capable results. Electrocardiogram (ECG) represents the electrical movement of the heart. Millions of ECGs were taken for the diagnosis of different classes of patients, and everywhere ECGs can provide a set of issues order about the abnormality in the concerned patient, which are analyzed by the physicians and interpreted depending ahead their experience. Electrocardiogram (ECG or EKG) is a trace of bio-electric potential dissimilarity recorded throughout the instance on the body surface that represents heart beats [1]. It is clearly described in Figure 1. Every heartbeat cycle is normally characterized by the sequence of waveforms recognized as a P wave, QRS complex and a T wave. Time intervals among people's waveforms as well as their shapes and orientation are demonstrating physiological processes happening in the heart and the autonomous nervous system [4].
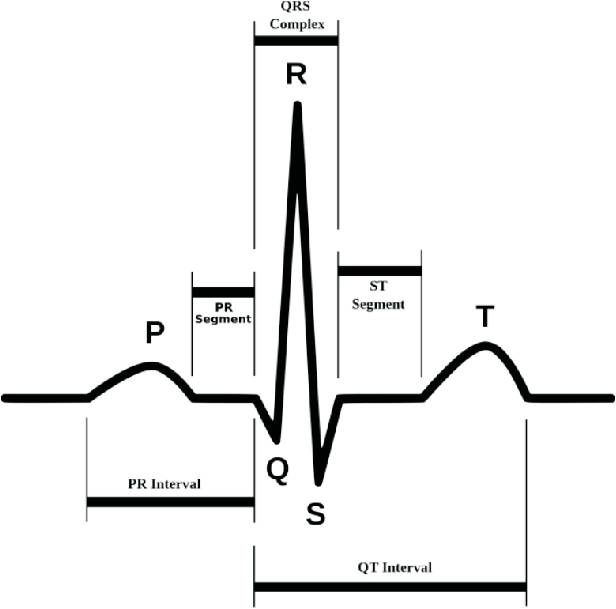
Figure 1. A Sample ECG Signal showing P-QRS-T Wave [5]
Even though nowadays in medical centres, sophisticated equipment and tools are used for detecting the heartbeat arrhythmias and the cardiovascular deformity, visual examination of the multi-channel (lead) ECG record is at rest, which is the first step occupied by cardiologists in the diagnosis procedure. Human heart is separated into four most important chambers called atria and ventricles both with their left and right section. Those chambers jointly structure a biological pump for propelling the blood throughout the body [6-9]. Apart from the four obvious sections, there are some other parts of the heart for very particular functions like dividing atria from ventricles, sluggish impulse circulation, ver y fast impulse propagation, where all of them perform a particular task, ensuring the proper blood flows efficiently throughout the body. When electrical impulse propagates through the heart and all these specialized cells, ECG electrodes pick up that impulse in various directions and speed. In this way, ECG waveforms are formed [9]. QRS complex is the most noticeable of all the components in electrocardiogram in light of its shape; in this manner, it is taken as a kind of perspective in ECG highlight extraction. Therapeutic finding utilizing Computer frameworks have been produced keeping in mind, the end goal to help medicinal experts in the examination of substantial volumes of patient information which can be separated from the ECG machine. Such procedures work by changing the most subjective analytic criteria into a more target quantitative sign highlight characterization issue [10-15]. The procedures have been utilized to manage this issue, for example, the investigation of ECG signals for the location of electrocardiographic changes, utilizing the autocorrelation capacity, recurrence area highlights, time-recurrence investigation, and the wavelet change. A few techniques comprising of arrangement of band pass channels has a recurrence scope of QRS edifices, yet these strategies have restricted precision in investigating ECG highlights in the vicinity of high recurrence commotion and additionally the ECG signal influenced by extreme gauge float [15] which should be overcome.
The noise artifacts rarely that influence the most part of ECG signals is Baseline wandering [16]. Regularly it shows up from breath and lies somewhere around 0.15 and 0.3 Hz. Disposal of Baseline wander is along these lines required in the ECG signal investigation to reduce the inconsistencies in beat morphology. In this paper, the baseline wander of ECG waveform, is dispensed with stacking the first flag first and then smoothen the information in the section vector y utilizing a moving average filter. Results are acquired in the column vector y [17-18]. The authors chosen a range for their work for smoothing the information is 100 for smoothing and it lastly subtracted the smoothed sign from the original signal. Thus, this processed sign is free from baseline drift, which is shown clearly in Figures 2,3,4,5.
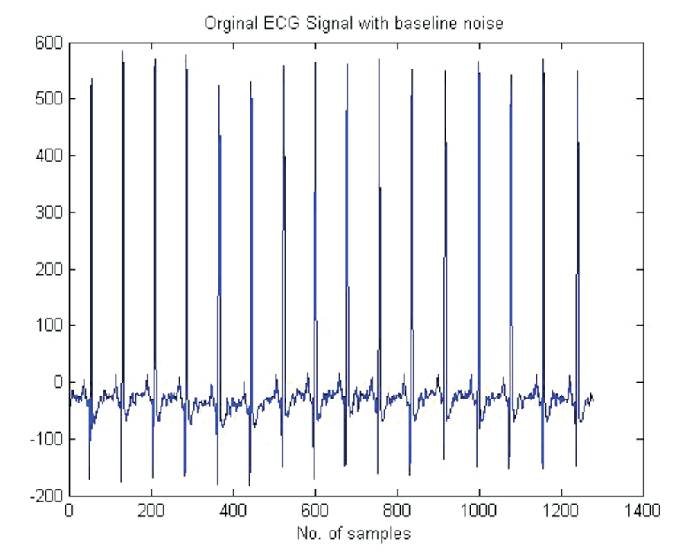
Figure 2. Original ECG Signal with Baseline Noise which has some offset
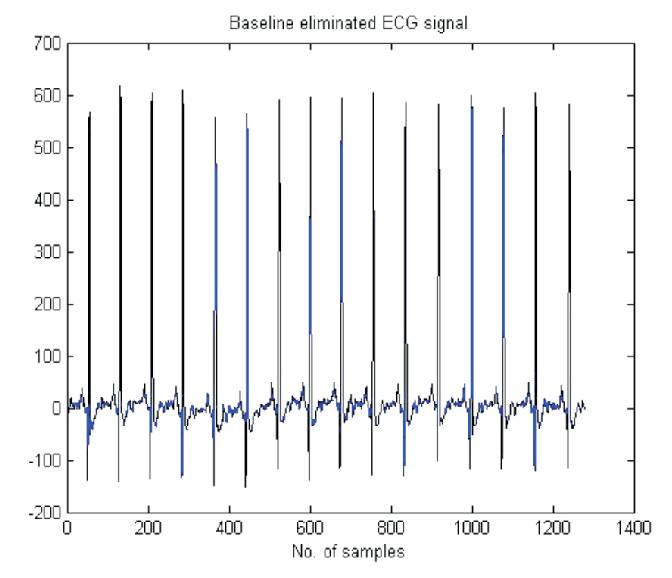
Figure 3. Baseline eliminated ECG Signal which has the offset of 0
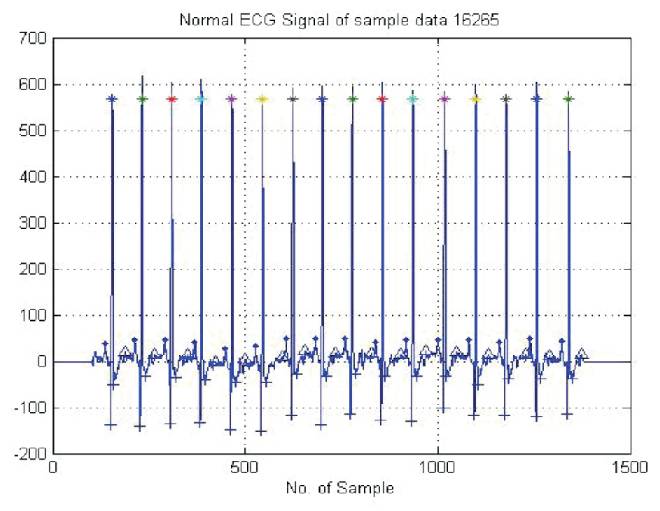
Figure 4. Normal Sample Signal of ECG Data
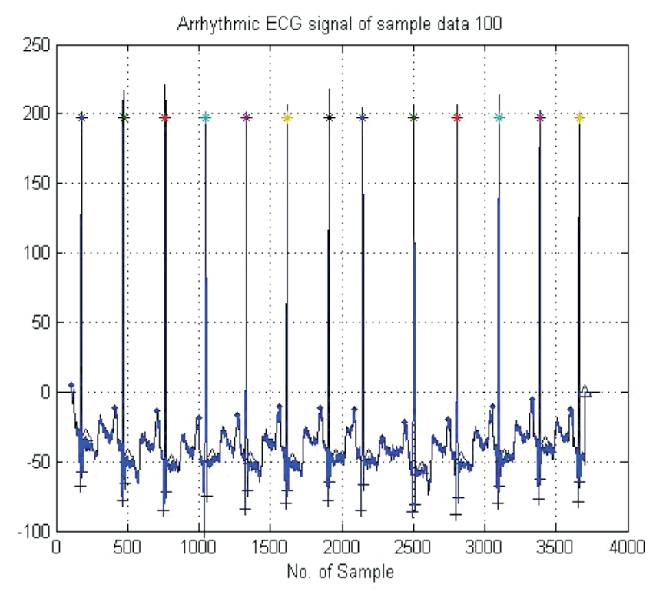
Figure 5. Arrhythmic ECG Signal of Sample Data 100
After the elimination of noise, baseline wanders evacuation and peak recognition, it is important to separate the component of the ECG waveform keeping in mind the end goal to utilize it in the next phase of ECG signal investigation [19-21]. The capacity to control and register the information in packed parameters structure is a standout amongst the most vital utilization of wavelet change, are frequently known as components. Highlight extraction is the most vital stride in example acknowledgment. There are a few approaches to remove the elements of an ECG signal. In this work, there are two sort of components extricated for ECG waveforms.
Determination of fitting Feature assumes an imperative part in example acknowledgment. The processed DWT coefficients introduce a conservative representation that exhibits the vitality conveyance of the sign in time and recurrence [22]. In this stage utilizes daubechies wavelet of request. Hence, the ascertained estimate and the detailed wavelet coefficients of the ECG signs were connected as the element vectors speaking to the signs [23]. Direct utilizing of wavelet coefficient as inputs to the neural system might build the neuron numbers in a concealed layer, which thus harmfully affects the system operation. Keeping in mind, the end goal to minimize the dimensionality of the separated component vectors, the insights of the wavelet coefficients were utilized [24-25]. The accompanying measurable elements were used for the the time-recurrence dispersion of the ECG waveforms:
At last for each of the ECG signal, 20 wavelet based components have been obtained. Aside from measurable element, the morphological component of an ECG sign is likewise acheived. These elements have most extreme estimations of P, Q, R, S, T tops. Hence the aggregate have been acquired to apply as a data to the neural system. Following the amounts of the element, a vector might be entirely diverse, and a standardization procedure is required to institutionalize each and every elements to the same level. Normalizing the standard deviation and mean of information allows the system to regard every data as just as fundamental over its scope of qualities [26-28].
Artificial Neural Network (ANN) is a computational model, which is spurred by the structure of biological neural networks. A neural network comprises of an interconnected gatherings of simulated neurons. This paper portrays the utilization of neural network in an example acknowledgment, where the information unit speaks to the component vector and the yield units speaks to the example class, which must be grouped [29- 33]. Every info vector (highlight vector) is given to the data layer, and yield of every unit is comparing the component in the vector. Each concealed units ascertains the weighted entirety of its information to blueprint its scalar a net enactment. Net activation is the inward result of the inputs and weight vector at the concealed unit [34].
The MIT-BIH arrhythmia and NSR database is isolated into two separate classes that are normal and arrhythmia. The Each file of ten second recording obtains information and it is isolated into two classes in light of the maximum number of beats sort present on it [35]. Among 67 ECG recordings each of length 30 minutes, just 62 recordings (14 records of ordinary class and 48 from arrhythmia class) of length ten seconds are considered for this work and the record number 19088,19090,19093,19140 and 19830 are not considered in this study. Table 1 demonstrates the used record number from MIT-BIH NSR and arrhythmia database. The aggregate 25 number of components are splited into two separate classes. These are DWT based elements and morphological component of ECG sign. Following, there are 25 (20 DWT based element and 5 morphological) components that are removed which is given as a data to the BPNN classifier. To recreate and prepare the system, 62 information (14 from typical class and 48 from unusual class) are used. Joining the removed elements, 70% of this information (64 × 25) grid has been accomplished for preparing information and 15% of separated feature (64×25) are utilized for acceptance and staying 15% of extricating highlight lattice data (64×25) are utilized for testing the network.
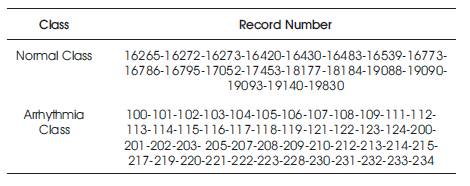
Table 1. Distribution of Records of MIT-BIH NSE & Arrhythmia Database
The simulation result has been obtained by utilizing the Back Propagation Neural Network (BPNN) classifier and the 10 quantities of neurons in the shrouded layer is utilized for preparing and testing the ECG signal. Two neurons are utilized at the yield layer of the system as (1, 0) and (0, 1) alluding to normal and arrhythmia class. Table 2 shows the overall performance of BPNN.
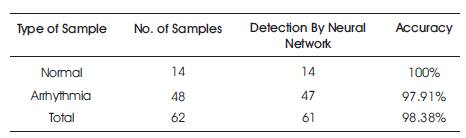
Table 2. The Overall Performance of BPNN
In this paper, the authors had discussed about different methods and algorithms for highlighting the feature extraction of ECG signal. Likewise, it ought to be exceedingly precise and ensure quick extraction of elements from the ECG signal and then just it is productive. Closer the premise capacity catches the sign attributes, the more smaller is the representation, furthermore, more probable are the components touchy to the important ECG states and heartless to varieties in unessential clamor. In this part, the authors have redone the fundamental elements of a consistent wavelet representation by picking polynomial wavelet premise works that match the qualities of a fiducially 1-beat long ECG signal example separated from the Poincare segmenting of ECG signal pattern. The customized representations were observed to be around two requests of extent more minimized (measured in term of sign entropy) than the wavelet premise capacities accessible in the standard wavelet library. In spite of the fact that, we can effectively characterize the heart arrhythmias. This work uncovers that, the abnormality location of the ECG signal taking into account discrete wavelet change and BPNN is 100% effective. They have arranged the MIT-BIH NSE and arrhythmia database records into ordinary and arrhythmia classes in view of the sorts of ECG beats present in it. Out of 68 records, the 62 records of ten second recording are considered for characterizing the ECG signal, while the remaining 5 records are rejected for this study. Since, aggregate 62 records and 25 elements are utilized as a part of this study to order the sign. The authors have accomplished general exactness of 98.4% utilizing back engendering neural system (BPNN) with 10 quantities of neurons in the concealed layer. The outcome for preparing and testing the ordinary and arrhythmia information test is more prominent than 90% utilizing BPNN classifier, which demonstrates the enhanced proficiency of the proposed work.