In recent years, due to the reduction of oil resources, both on lands and in shallow waters, exploration and extraction of oil resources are played in deeper waters. Therefore, the need for appropriate structures suitable for deep waters is obvious. The semi-submersible platform is a specific type of such platforms which is used in deep waters. These platforms are utilized for different purposes such as drilling, exploration, extraction, loading and off-loading of petroleum products under the influence of external forces caused by wind, waves, current, etc. True understanding of the dynamical behavior of the semi-submersible platform in damaged condition can help designers to reduce the environmental hazards. Platform structural damage can be accompanied with the entry of water in the reservoirs of platforms which will lead to the change in platform stability and excessive increase in the platform movements. In this research, the AMIRKABIR semi-submersible platform is modeled in the Marine Engineering laboratory of the “Sharif University of Technology”. The model scale was 1:143 and the environmental conditions of the Caspian Sea were considered the amount of water entering one of the pontoon reservoirs was set to follow that similarity scales. The model was installed in the flume tank using a spread mooring system. For the environmental conditions of the Caspian Sea, the platform was tested under both head and beam sea directions. The results of the conducted tests are represented by platform motion Response Amplitude Operators (RAOs).
Semi-submersible platforms are designed for the water depths up to 1000 meter. A semi-submersible is basically composed of twin submerged hulls which are attached to a rectangular lower deck by means of surface-piercing columns. If due to damage one or more underwater compartments flooded the platform, the dynamical response to waves would change. This is due to the change in stability characteristics of the platform. Soylemez. (1995) inspected the motions of a semi-submersible platform having a double shell body in different damaged and undamaged conditions. It is concluded that the smaller metacentric height would lead to a larger probability of reversal in the damaged conditions after flooding. In addition, it is observed that the maximum 10 degree roll and the maximum 15 degree Pitch of water loss happens on the deck. Stone et al. (1990) have investigated the stability conditions of semi-submersible platform in both damaged and intact conditions. Studies have shown that in regular waves with zero degree incident angle, the RAO graphs of Pitch, roll and heave motions in the damaged condition when the damaged column is on the windward position, have higher peaks in comparison to other motions. Pederson (2012) has inspected the motions of a semi-submersible platform in various operating conditions in ANSYS AQWA software. After observing the RAO graphs of different motions in damaged condition in the middle and corner of pontoons, they have concluded that the peak of heave is influenced by coupling which is caused by the platform asymmetry. Storheim et al. (2014) have attempted to design offshore structures to recover from disasters caused by the collision of vessels. They have inspected the damages of the offshore structures subjected to the vessels hit. Rashidi et al. (2015) have performed a comprehensive experimental study on the Froude-Krylov force caused by the reflection of regular waves on the semi-submersible platform. They have compared the laboratory Test results with numerical Results obtained from Moses software. Their results were plotted based on the wavelength. Bozorgi et al. (2015) have investigated the balance and stability of semi-submersible platforms in damaged condition. They have evaluated the platform stability criteria after the compartments are damaged based on the various loading conditions and different waterlines. They have concluded that the hydrostatic parameters of the structure have changed enormously after flooding of the compartments.
In order to model the AMIRKABIR platform, the twin tank limitations should be considered. The twin tank of Sharif University of Technology has a length of 25 meter, width of 2.5 meter, and height of 1.5 meter which is normally filled with water up to 1.2 m depth (Figure 1).
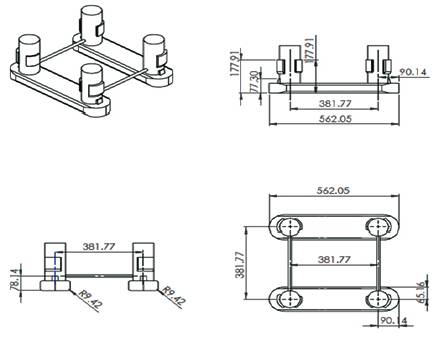
Figure 1. AMIRKABIR Platform Model
The model semi submersible is a twin pontoon four column unit constructed to a scale of 1:143, and is considered similar in geometry and mass properties to the GVA 4000 design. Details of model construction and the measurement of physical and experimental characteristics of the model are shown in Table 1.
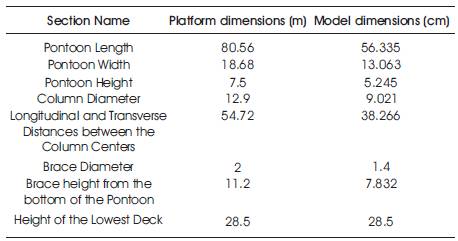
Table 1. Characteristics of Real Platform and the Constructed Mode
The model was designed to a weight less than 3 kg. By setting the location of the ballast weights inside columns and the deck, the model center of gravity and add mass moments of inertia were modelled accurate. A major part of the model including pontoons and deck were made from composite polymer reinforced with glass fibers.
Threaded steel rods inside columns were used to set the position of a ballast weight. Columns are constructed from PVC pipes; external fenders from hardened resin, internal fenders from compressed rubber, and the braces are constructed from steel pipes. The response to winds were not considered. Therefore, the out of water part of the platform was not modelled. The effect of platform superstructure on weight distribution via the center of gravity and gyration radii was modelled by positioning ballast weights inside columns and deck ( Chakrabarti, 2005 ). The following figure shows the model characteristics. The dimensions are in millimeters.
The platform model, the model was constructed in the laboratory which is illustrated in Figure 2
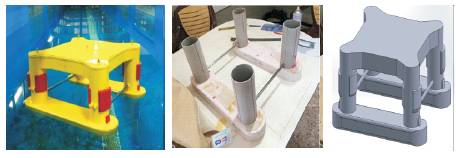
Figure 2. Construction Process of Semi-Submersible Platform in the Laboratory
Based on the equations dominating the mooring system and a code developed in Matlab, horizontal and vertical stiffness for each mooring line of the AMIRKABIR semisubmersible was obtained and the considered stiffness were constructed in the laboratory with the scale of 1:143. Because mooring vertical stiffness is negligible with respect to the hydrostatic stiffness, and considering the size limitations of the flume, horizontal springs were used to model the horizontal stiffness of the mooring system. Every two mooring lines connecting to the same columns are replaced with an equivalent spring having the same horizontal stiffness. This helped to inspect the platform motions in both head and beam sea directions. Figure 3 shows the schematic of the modeling of the mooring system.
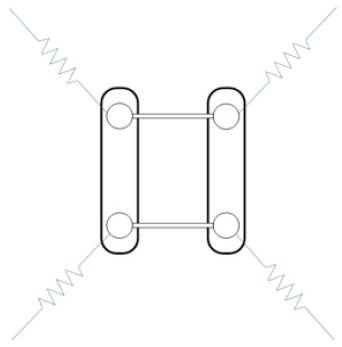
Figure 3. Schematics of Modeling the Mooring Lines
To evaluate the behavior of each spring, it was placed in a testing machine. The required pre-tension was equal to 340 grams. First, each spring was pre-tensioned to 300 grams. Then, the spring tensioned for 0.5 cm increments up to 5 cm elongation and the spring force was recorded using the sensors. Figures 4 and 5 demonstrate the explained process.
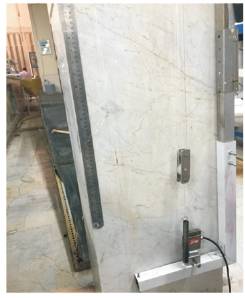
Figure 4. Spring Test for Determining the Stiffness
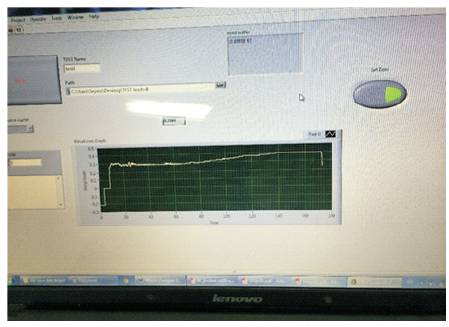
Figure 5. Determining the Spring Stiffness
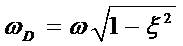
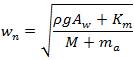
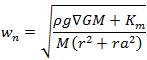
In this test, the natural period, gyration radius, and the damping of the platform motions in undamaged conditions were calculated. In decay tests, free vibrations of the platform are recorded using a sensor which would lead to a calculation of the natural period of platform. The natural frequency of the platform is the square root of the stiffness divided by the summation of the mass and the added mass to the platform. For angular movements, mass is replaced with mass moment of inertia of the platform. Having the natural frequency and angular stiffness, the gyration radius of the model can be calculated. For damped vibrations, the modified natural frequency can be identified as in [Equation 1]:
If the nth and the (n+m)th peak of the time- history graph of the vibration are considered, the damping ratio can be calculated using [Equation 2], ( Journee and Massie. 2001).
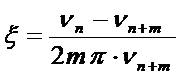
The schematic for the time-history of the free vibration is shown in Figure 6 in which the peaks are identified as ν0, ν1 and ν2.
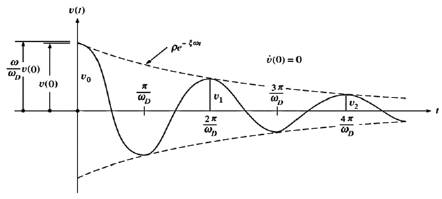
Figure 6. An Example for a Damping Free Vibration
In the tests, the free vibrations of the platform were recorded using sensors and based on them, the platform natural periods were calculated. In order to perform this test, first, the platform is disturbed by applying a stroke in the desired direction. Due to the strike, the system starts to vibrate around its equilibrium position which were recorded by sensors. The stroke was applied to the platform so that only motion in one degree is to be excited
In the following, the plots of the damping test for heave motions of the platform is presented. As it is shown in Figure 7, the natural period of the platform model is equal to 1.98s and based on the [Equation 3], the natural period of the prototype will be equal to 23.9s. The natural period of the platform in reality is 23.76s. It can be seen that the results of the experiments have a reasonable accuracy.
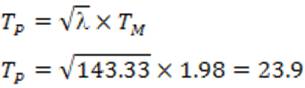
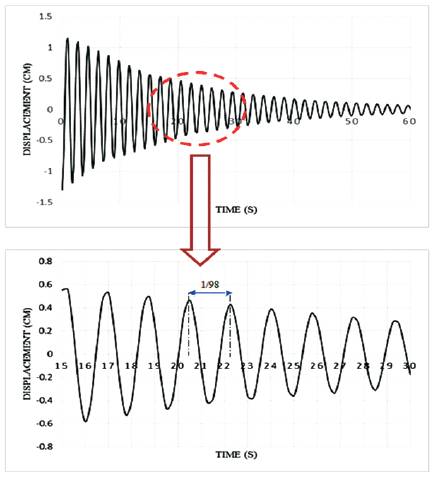
Figure 7. Damping Test of Heave Motion
Platform damages can be due to different reasons such as body fracture caused by the collision of vessels or explosion etc. ( Zayas et al.1985). In all these conditions, damage causes the water to enter the platform. In this study, considering damages in four different reservoirs of pontoons, the behavior of the platform after the damage is investigated. Figure 8 illustrates the condition of the damaged reservoirs. Additionally, Table 2 shows the volume of the added water.
Figure 8. Location of Damaged Compartments
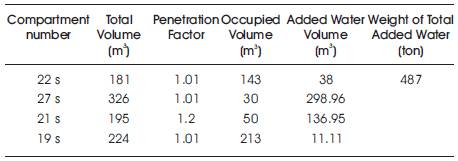
Table 2. Damaged Compartments Characteristics
Based on the aforementioned information and the weight similarity ratio obtained from equation mp=λ3mm a 165 grams mass was positioned at the center of the column and the pontoon center height. After adding this mass, the platform model deviated about 7.6 degrees in both the directions of X and Y. Figures 9 and 10 show the platform after damage and after installation in the flume respectively.
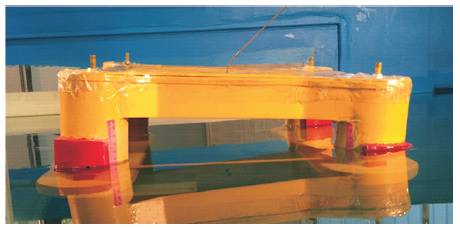
Figure 9. Installation of the Platform in Beam Sea Regular Wave Condition
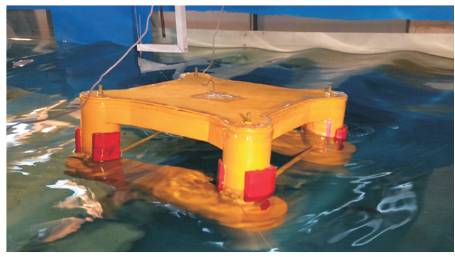
Figure 10. Installation of the platform in head sea regular wave condition
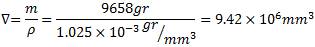
After modeling the added water, the center of the gravity of the platform is calculated in damaged condition as shown in [equations 4, 5 and 6]( Moonesun, 2012).


In this project, the platform is modeled in the 7.6 degree angle in the Solid work software. Some of the characteristics of this model are shown in Table 3.
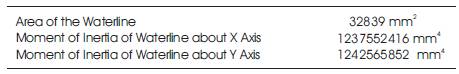
Table 3. Characteristics of Platform in Damaged Condition
Now, based on information in that table and Equations 7, 8, 9, and 10], the GM of the damaged condition in roll and pitch motions were calculated.

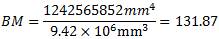
Now, considering the calculated BM for the pitch motion using Equation 10 the GM is calculated.
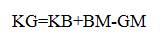
KG=KB+BM-GM → GM=64.6 mm
Similarly, the GM would be equal to 64.07 for the roll motion.
In order to analyze the RAO graphs of the platform motions, the natural period of those motions is required. These natural periods are calculated for pitch, roll, and heave motions using the damaged platform information.

Substituting these quantities in equation 2 the natural period for the heave motion of damaged platform was calculated as 23.1s. In addition, the corresponding natural frequencies for angular motions were evaluated using [Equation 13].
Introducing GM values for pitch and roll motions, the natural periods of these motions were calculated as 21.8s and 32.44s, respectively. The difference between the natural periods of these two motions are due to the difference in gyration radius of these motions. Radius of gyration in the roll motion is about 18 meter, whereas the gyration radius of the pitch motion is about 40 meters. Multiplication of the obtained periods by Öl estimates the natural periods of the motions of the prototype which are very close to the natural periods of the real platform located in 700 meters depth. These results are presented in Table 4.
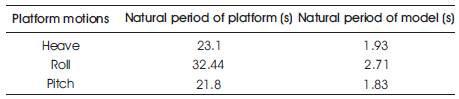
Table 4. Natural Periods of Motions of Original Platform and Constructed Model
The platform model was tested in order to extract:
(1) RAO graphs of heave, surge and pitch motions in head sea direction,
(2) RAO graphs of sway, surge and roll motions in beam sea direction, and
(3) The time-history plot of these motions in the head sea and beam sea directions against different regular wave periods.
Table 5 shows the wave parameters for the actual and laboratory conditions of the semi-submersible platform. Waves with a length of 33 and 40 cm with the amplitude of one cm and other waves with the amplitude of 2 cm are applied to the structure.
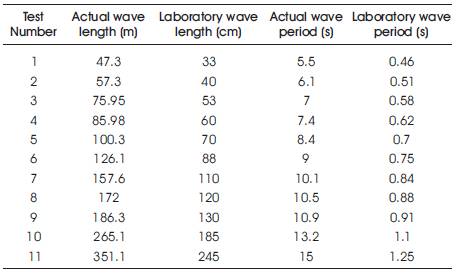
Table 5. Wave Parameters for Real Condition and Laboratory Condition of Semi-Submersible Platform
After installing the platform in the flume and adjusting the test mechanisms, based on the aforementioned plan test, the platform was tested and the motions were recorded. Figures 11 and 12 shows the platform while testing in head sea and beam sea directions, respectively.
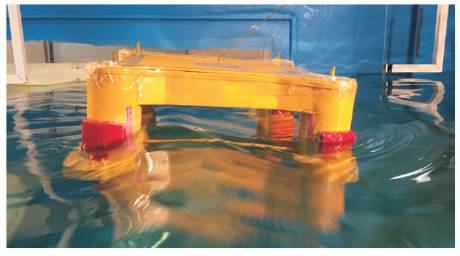
Figure 11. Model Undergoing Tests Under Simulated Damage Condition in Head Sea Regular Wave Direction
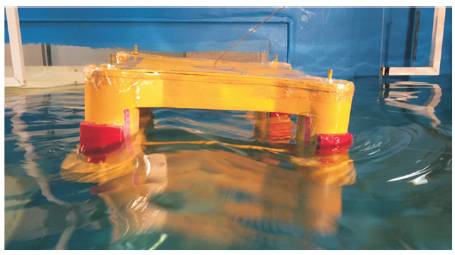
Figure 12. Model Undergoing Tests Under Simulated Damage Condition in Beam Sea Regular Wave Direction
One of the most important graphs which represent the platform behavior in different periods and various incident wave angles is the Response Amplitude Operator (RAO) ( Faltinsen, 1993). In the tests the acceleration of the platform is recorded using the appropriate sensors. Since the data are recorded as acceleration, it is converted to the time-history spectrum using a coding in Matlab. Then, using the time-history spectrum and incident wave amplitude, the RAO of different degrees of freedom was evaluated.
Figure 13 shows the RAO graph of platform pitch motions in head sea direction of the incident waves. As it is shown in the figure, at the period of 6th second, the graph has a peak. In this period, the wavelength is about 2/3 of the pontoons' lengths and therefore, entrapping has happened which leads the response amplitudes to be increased. Figure 14 shows the schematic of this phenomenon.
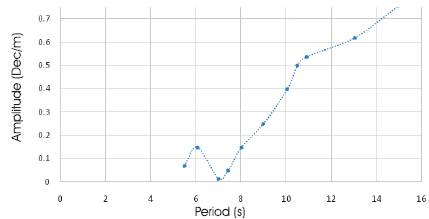
Figure 13. Pitch RAO for Head Sea Regular Wave Condition
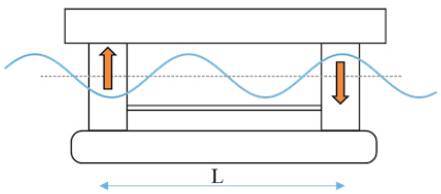
Figure 14. The Entrapping Phenomenon in Pitch Motion
In a period close to 7s where the wavelength is almost equal to the pontoon length, due to the cancellation phenomenon, the platform motions were reduced. In this situation, the distribution of the applied forces produces no pitch moments. Figure 15 shows the schematics of this case.
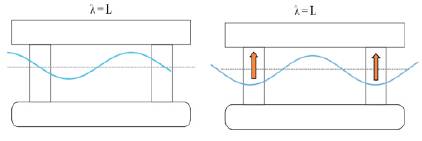
Figure 15. Cancellation Phenomenon in Pitch Motion
Figure 16 shows the RAO graph of the heave in head sea.
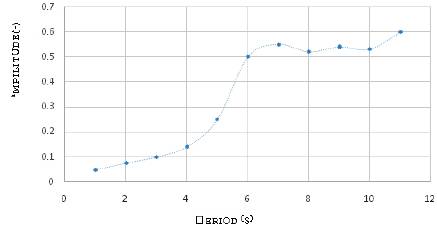
Figure 16. Heave RAO for Head Sea Regular Wave Condition
The model amplitude in different periods obtained from processing the sensor data are in fact the result of fluid force and the model reaction force. The latter can be divided into three components of stiffness, inertia, and damping. As Figure 16 shows, for higher wave periods, i.e., larger wavelengths, the amplitude of heave motion increases. The graph has a local peak at about 7s which is due to the pressure distribution on columns and pontoons in this period.
Figure 17 shows the RAO for the platform Surge motion in the head sea direction. As it is shown in Figure 18, close to the 7s period of the actual wave, the wave incident length is almost equal to the distance between the columns and a wave trapping phenomenon is happened.
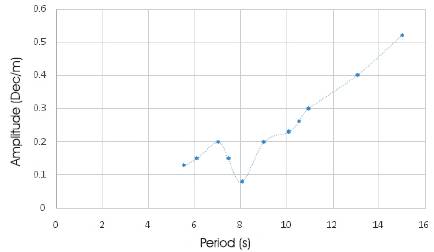
Figure 17. Surge RAO for Head Sea Regular Wave Condition
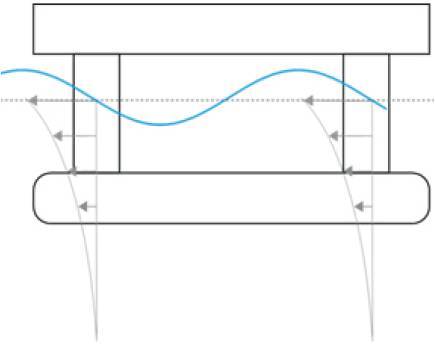
Figure 18. wave Trapping Phenomenon in Surge Motion
For the laboratory model of the semi-submersible platform, the resonance could not be captured for the first order surge motion, since the natural periods of such motions are high and they were not in the range of the periods considered in the experiments. Nevertheless, when the wave period is equal to 7s, the corresponding wavelength will be equal to the distance between the columns and therefore, the surge motion amplitude would increase suddenly. Although, it causes a relatively large surge amplitude, the system would not become unstable. It seems that the platform has a motion like beating in this period.
Figure 19 shows the RAO of the sway motions of the semisubmersible platform. As it is shown in the graph, the wave trapping phenomenon is happened in the period of 6.85 seconds where the incident wavelength is the same as the distance between the pontoons. Figure 20 shows the schematics of the wave trapping phenomenon in the sway motions.
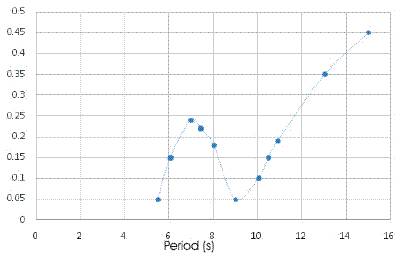
Figure 19. Sway RAO for Beam Sea Regular Wave Condition
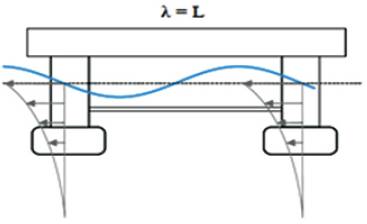
Figure 20. Wave Trapping Phenomenon in Surge Motion
Additionally, in a period close to 9s, the wavelength is about 146 meters in which, the wave length would be equal to twice the existing distance between two pontoons. As a result, the applied forces to the pontoons and columns are in opposite directions and hence, they will cancel each other which would result in a reduction in the platform amplitude motions. Figure 21 shows the schematics of the cancellation phenomenon.
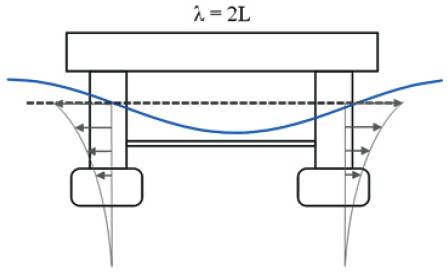
Figure 21. Cancellation Phenomenon in Swaymotion
Figure 22 shows the RAO of the platform Heave motions. In periods of less than 5 seconds, the wave forces are so small with respect to the platform hydrostatic stiffness that virtually cause no movement in the heave direction. At a period of 5s, the wavelength is equal to 2/3 of the distance between the pontoons. No force would excite the platform heave motions and therefore, this period is infact the platform cancellation period. This occurrence might also happen at the period of about 9 seconds and a wavelength of about 146 meter. The wave trapping phenomenon also might happen at 6.85 seconds.
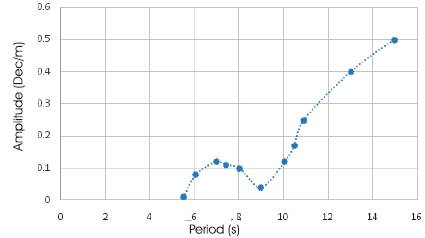
Figure 22. Heave RAO for Beam Sea Regular Wave Condition
When the wave period is equal to 6.85s, the wavelength is equal to the distance of pontoons and the heave wave forces applied to each pontoon will be in the same direction. This results in an increase in the heave motion amplitude. This is shown schematically in Figure 23.
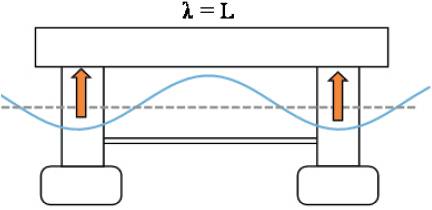
Figure 23. Schematics of Wave Trapping Phenomenon at Heave Motion
Figure 24 shows the RAO of Roll motion of the semisubmersible platform. In this figure, it is observed that when the wave period approaches 6.85s, the wavelength would be equal to the distance between the pontoons and therefore, as it is shown in Figure 25, the wave force distribution is such that no moments will be produced in roll motion. In other words, this period would be equal to the cancellation period of the structure.
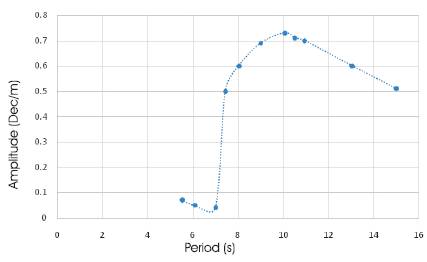
Figure 24. Roll RAO for Beam Sea Regular Wave Condition
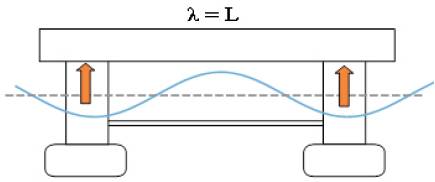
Figure 25. Cancellation Phenomenon in Period of 6.85 for Roll Motion
The graph peak which is happened at the period of 9.7 seconds is due to the wave trapping phenomenon. In this period, the wave length is twice the distance between the pontoons and therefore, the platform will have high vibrations around the roll axis. Figure 26 shows the wave trapping at the period of 9.7s.
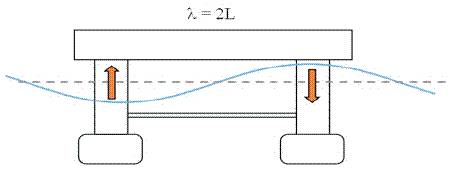
Figure 26. Wave Trapping Phenomenon at the Period of Equal to 9.7 Seconds for the Platform Roll Motion
The obtained data from the marine tests are plotted as the platform motion amplitude graphs and investigated for different periods in the head and beam incident wave directions. As it is shown in the graphs, the RAO graphs are influenced by the geometry of the platform and the incident wave characteristics. In addition, pulsation happens close to the wave trapping periods.