This paper presents an efficient mathematical and simulation model for a solar photovoltaic system. This is an analysis on the characteristics of photovoltaic (PV) Cell under various weather conditions. Considerably, the PV cells are nonlinear in nature, whose characteristics and the maximum power point varies with irradiance and temperature. It focuses on the effect of variation in series and shunt resistances. The model is proposed to study the expected environmental issues on the solar power generation. By the help of this model, a study of large PV system or solar energy system can be done easily. This model elaborates various effects of parameter variation on the P-V and I-V characteristics of the PV module. This model was developed with the help of Simulink software and can be utilised for various study and research purposes.
The global requirement of electrical energy is constantly increasing. In recent years, renewable energy [1] sources such as solar, wind have been concerned on a growing environmental realization to pollution. The idea of utilizing non-conventional energy resources is born from the requirement to search for the new sources of energy, among various renewable energy sources, PV sources [10] have no availability problems and are assumed to become the largest contributors to energy (electrical) generation. The use of renewable sources has decreased the dependency on fossil fuels [1] and also helped in the reduction of greenhouse gases emissions.
A single PV cell has a very small output current and voltage, so as to use for practical purposes. Series and parallel combination of PV module [2] makes a PV array. The output of this PV array is in the form of DC, which is converted in to AC at a fundamental frequency by applying inverter. A solar cell is made up of layers of semiconductor materials that use the photoelectric effect to convert the photon energy of the sun radiation into electricity. The solar cell operates as a current source and it possess nonlinear characteristics.
This paper elaborates the model of a solar photovoltaic cell, which is totally based on equations [2]. This model is capable of generating current power-voltage curves of the photovoltaic cell and photovoltaic module. This model is proposed to analyze parameter variations effect on the power-current and current-voltage curve of the photovoltaic module.
Section 1 shows the objective of this study and section 2 provides the methodology. In section 3, mathematical model [5] of the PV cell and its power-voltage curve and current - voltage curve of the PV cell is described. In section 4, development of the photovoltaic module and basic characteristics (P-V and I-V) curves of the PV module is described. Section 5 emphasis on the effect of variation in solar irradiation on the photovoltaic module. Section 6, explains the effect of atmospheric temperature changes on the module. Sections 7 and 8 describe the effect of variation in series and shunt resistence respectively. The Results and Discussion of the paper is included in section 9. Finally the paper is concluded.
The objectives of this paper are summarized below,
The use of appropriate performance parameters using the comparison of grid-connected photovoltaic (PV) systems may differ with respect to design, technology. or geographic location. Performance parameters which affects the overall output of the solar PV module are solar irradiance, shunt resistance, series resistance and temperature.
Research and performance analysis of the PV module is done in this project. It includes study of different types of PV module which is efficient and is being utilized for the photovoltaic generation. The focus of this study is to improve the performance of existing plant in the design side that includes selection of plant balance of system, like transformer, inverter, module, module mounting structure, protection equipment and then comparing the design with actual report of the existing plant equipment.
The one diode model [3] of a solar photovoltaic (PV) cell consists of a current source, a shunt resistance, a series resistance and a semiconductor diode. The equation of load current can be derived from that model. The total load current, IL also known as output current of PV cell is given below,
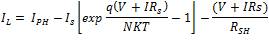
From the above equation, IL is the output load current, IPH is the diode photo current, K is Boltzmann's constant (1.38 x 10⁻²³ J/K), and IS is the diode saturation current employed in the model. These parameters play a key role in the behaviors of solar photovoltaic system [7]. So, the characteristics of a solar PV are totally influenced by given parameters. Figure 1 shows the Simulation [4] of 1KW solar array.
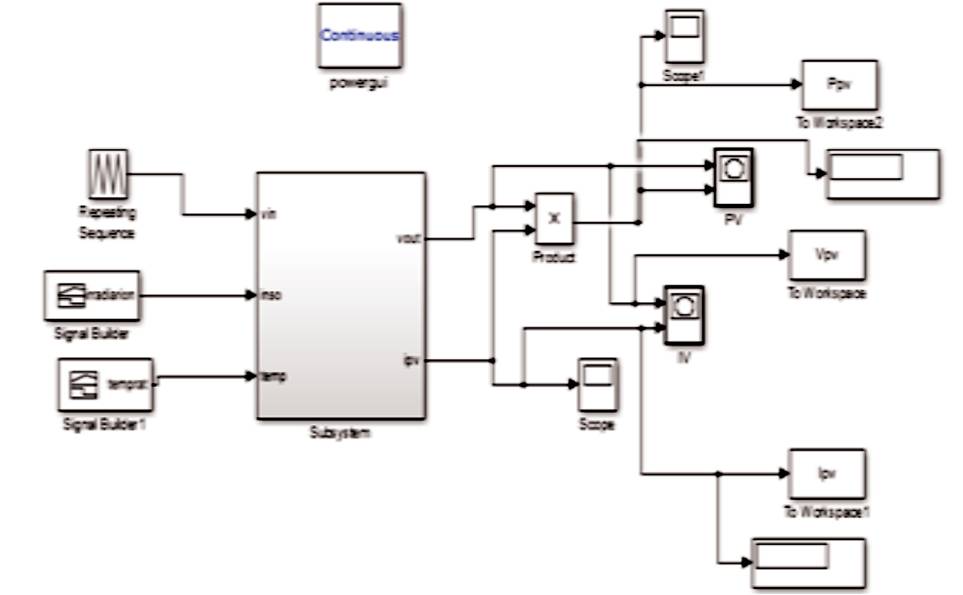
Figure1. Simulation of 1kW Solar Array
In Figure 2,the curve power is displayed on Y- axis and voltage on X-axis. Same assumption is applicable for all the power- voltage curves shown in this paper.
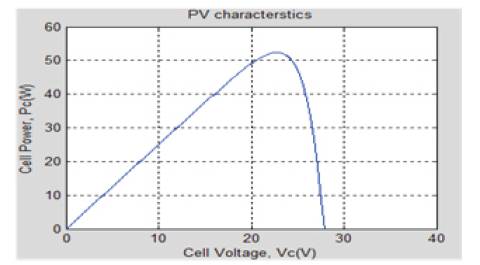
Figure 2. Power - Voltage Curve of PV Cell
In Figure 3, curve Y- axis shows variation in current and Xaxis shows voltage variation. Same assumption is In Figure 3, curve Y- axis shows variation in current and Xaxis shows voltage variation. Same assumption is applicable for all power- voltage curves shown in this paper.
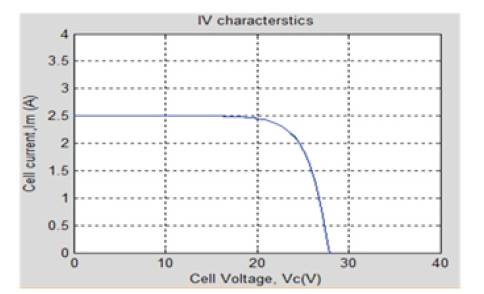
Figure 3. Current - Voltage curve of PV cell
To make a PV module, 36 cells are combined. To obtain the required voltage for the proposed model, total 36 cells are connected. A gain is applied to the cell voltage to obtain the required voltage level for the system, gain applied to the system is exactly same as the number of units (cells) to generate the system of a 300W PV module.
The proposed model mainly consists of three subsystems. All the subsystems have their own functioning. These subsystems are combined to get a solar panel which can be treated as a constant current source. First, the subsystem calculates the photocurrent, IPH [8]. This depends on the solar irradiance and cell temperature. The output of the PV module changes with the solar irradiance level represented by the given equation,
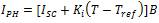
Figure 4 shows the internal structure of the subsystem that represents photo generated current. The simulation is done for various irradiation levels keeping T constant. Figure 5 shows the subsystem for photo current.
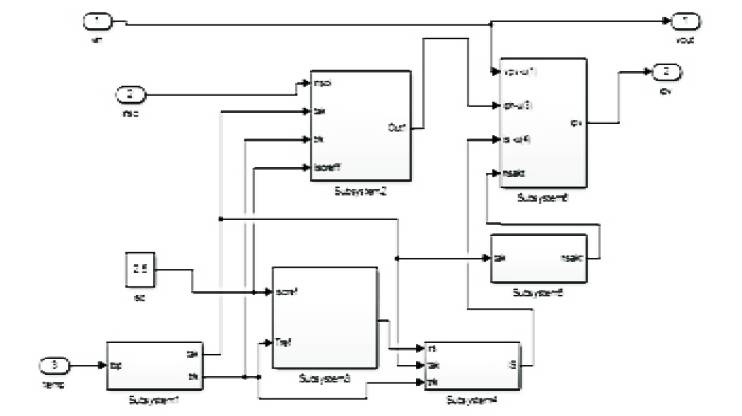
Figure 4. Internal Structure (Subsystem) of a Solar PV Cell
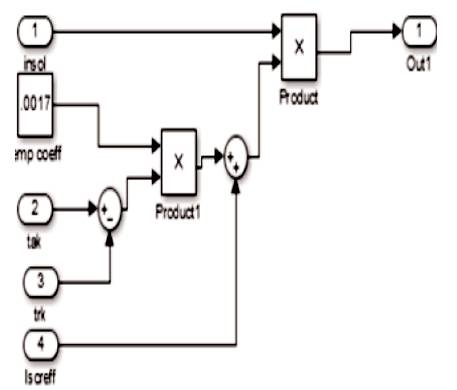
Figure 5. Subsystem for Photocurrent
The consequences of variation in solar irradiance [15] level are displayed in Figure 6 and Figure 7 completely. As the Figures show, the variation of irradiance level that influences the generated voltage and the photo generated current in PV module to a great extent. The result obtained, clearly shows that, Voc which is an open circuit, has the voltage decreasing abruptly and the current IscIowers down broadly with the decrement of solar irradiation.
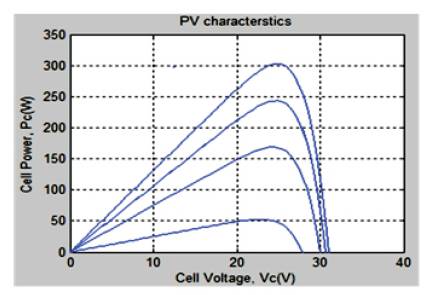
Figure 6. Power-Voltage Curve of the Photovoltaic Module for the Variation of Solar Irradiance
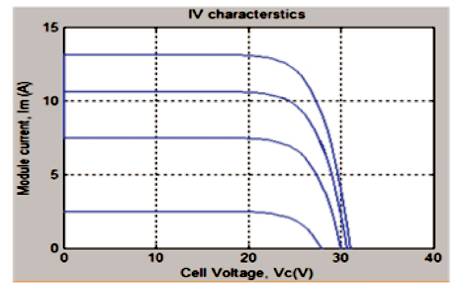
Figure 7. Current-Voltage Curve for the Photovoltaic Module for Variation in Solar Irradiance Level
The next subsystem calculates Is which is the diode saturation current, the internal structure of the subsystem for the Is, is shown in Figure 9. Diode saturation current [9, 11] mainly depends on the cell temperature and the reference temperature taken. Variation in the saturation current takes place in the cubic form, as this current is related to the cubic relation with the temperature, which is given below,
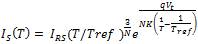
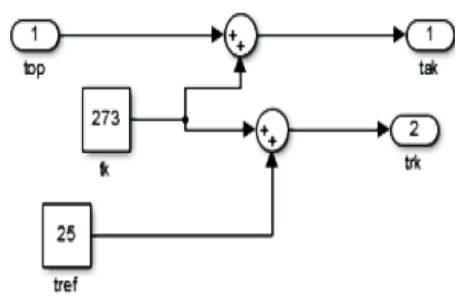
Figure 8. Internal Structure of Subsystem for Temperature
The equation shown above includes IRS ,which is the reverse saturation current of the diode and V↑ is thermally generated voltage [6, 12]. Figure 8 represents the internal structure of the temperature block subsystem. The equation which represents the reverse saturation current is given by,
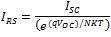
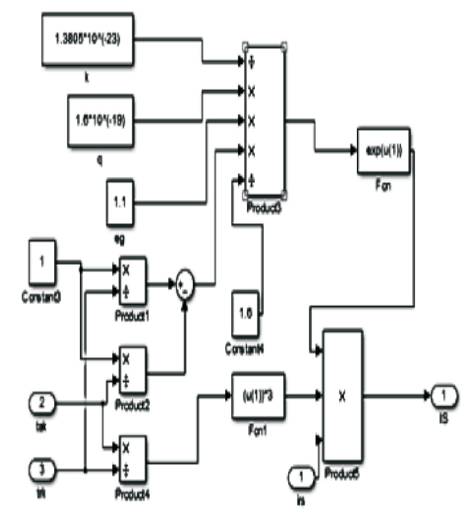
Figure 9. Internal Structure for Diode Saturation Current
The simulation was performed on various temperature values 278K to 338K, keeping irradiation level constant.
The effect of temperature variation on power-voltage and current-voltage characteristics is shown in Figure 10 and Figure 11 respectively. According to these characteristics Voc drops and Isc increases when temperature increases.
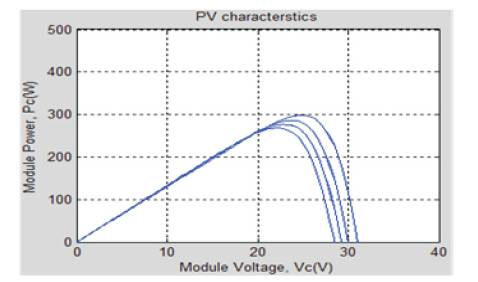
Figure 10. Power-Voltage Curve of the PV Module for Variation in Temperature
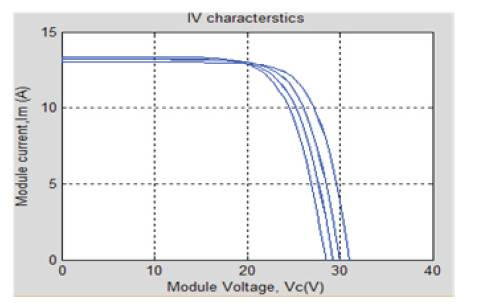
Figure 11. Current- Voltage Curve for Variation in Temperature
The value of series resistance Rs is kept quiet low for the PV cell. This model was designed to analyse the behavior of the PV module, when the series resistance is varied for any PV energy system. Variation of series resistance affects the power-voltage and current-voltage curves of PV module.
In this model, series variation range 1mΩ to 10mΩ is applied for resistance connected in series, temperature was kept unchanged at 298K and solar irradiation [9] level was also kept constant.
As the total output power of a PV cell is very low, the series resistance plays a very important role. More value of series resistance directly affects the current supplied by the PV module and thus, power output of the given PV module. Figure12 shows shifting of the point, where maximum power [5, 16] is obtained from the module. So series resistance plays a key role in power variation at the output of the module.
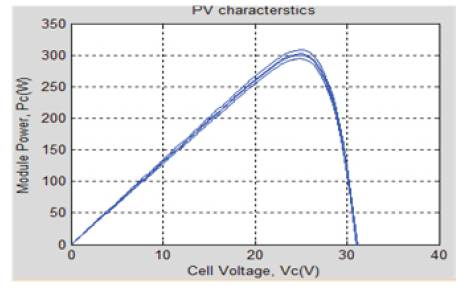
Figure 12. Power-Voltage Curve of PV Module for Variation in Rs
Figure 12 and Figure 13 explains the variation in values of Rs , which shifts the point where maximum power [5] is obtained from the PV module. The open circuit voltage [13,14], Voc and short circuit current, Isc both remain unchanged.
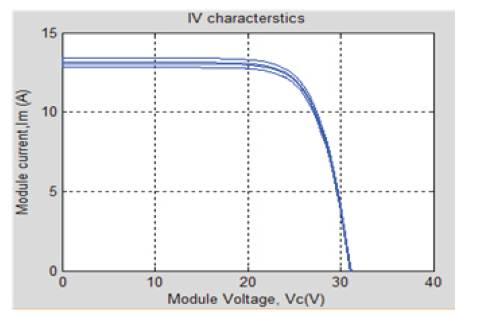
Figure 13. Current- Voltage Curve for Variation in Series Resistance
Generally, the resistance connected in shunt, RSH should be as large as possible for the PV cell so that output from the PV module can be maximized. So it is kept moderately high in this model and variation is done up to 1kΩ.
Figure 14 and Figure 15 display the effects of variation in the values of shunt resistance Rsh on power-voltage and the current-voltage characteristics [16] respectively. There is a high power loss for the low values of Rsh . The range of values for which, this simulation was performed is 10Ω- 1000Ω. The effect of variation in Rsh is shown in power-voltage and the current-voltage characteristics of the module. It also affects the point at which maximum power is obtained for the PV module. Parameters are given in Table 1.
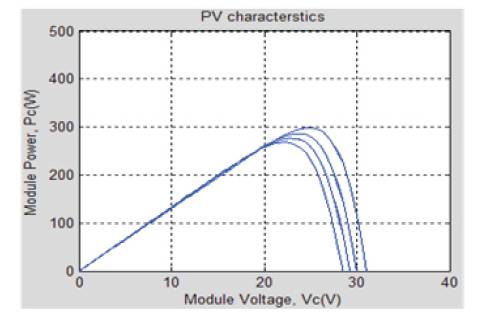
Figure 14. Power-Voltage Curve of PV Module for Variation in Shunt Resistance
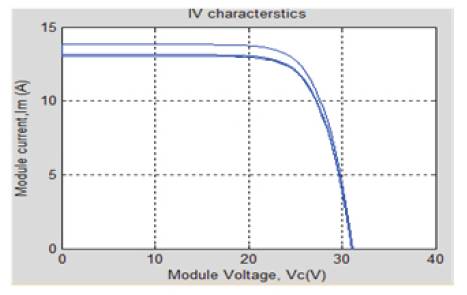
Figure 15. Current-Voltage Curve of PV Module for Variation in Shunt Resistance
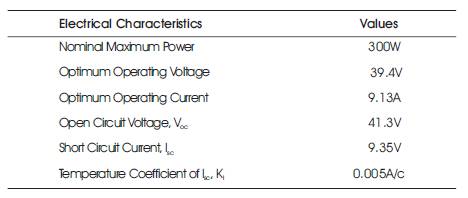
Table 1. Parameters
This paper shows the effect of various parameter variations on the output of PV module. P-V and I-V characteristics have been shown in the paper for each parameter variation. For the solar module shown in Figure 1, P-V and I-V characteristics are displayed in Figure 2 and Figure 3, which clearly shows the variation of power with the module voltage.
For the variation in solar irradiance, Figure 6 and Figure 7 shows P-V and I-V characteristics for the simulated module, likewise for the variation in temperature. Figure10 and Figure 11 display the resulting waveform. So in this paper for every parameter variation, P-V and I-V characteristics are shown.
The paper proposed a mathematical equation based model. The model can be used to generate and study the characteristics of solar PV cell as well as module. This model can produce the behaviour of the module based on variation in solar irradiation and temperature. This model is used to study the effects of various parameter variation of a PV cell, which plays a key role in power output of the cell. This is a simulink model [4], which shows the exact variation in characteristics of the cell, when there is change in the parameters. This model can also be used to build PV modules by integrating it in a proper manner, and the proposed model can be utilised for future study and research.
In this paper, detailed study of parameters affecting the PV module output has been done. Solar irradiance, temperature, shunt and series resistances are the main affecting parameters. The material used for the fabrication of PV cell also affects the performance of the module. By the use of other efficient semiconductor materials, the performance of the PV cell can be improved in a better way. By connecting this panel to the solar power generation system, sufficient amount of energy can be generated. The efficiency of the total power generation can be increased by optimizing parameters of the PV cell.
Voc - Open Circuit Voltage (V)
IL - Output Load Current (A)
IPH - Diode Photocurrent (A)
N - Diode Ideality Factor
IRS - Reverse Saturation Current of Diode
IS - Saturation Current OF Diode (A)
Is - Short Circuit Current (A)
q - charge on electron (1.6x 10⁻¹⁹ C)
Rs - Resistance in Series(Ω)
RSH - Resistance in shunt(Ω)
Ta - Ambient Temperature (K)
TREE - Temperature taken as reference (K)
V - Output Cell Voltage (V)