In this paper, the authors extracted features of ECG signal using LabVIEW software. The real time ECG signal the authors use, is taken from MIT BIH database in .edf format. The signal is then converted into suitable LabVIEW format using biomedical toolkit provided by NI. The converted signal is then filtered and pre-processed using wavelet transformation technique. ECG features is then extracted which includes P onset, P offset, QRS onset, QRS offset, T onset, T offset, R, P and T wave using the extracted features using which they calculate various parameters like heart rate.
Electrocardiography (ECG) is the process of recording heart activity over a period of time. A typical ECG tracing is a repeating cycle of three electrical entities namely, a P wave, a QRS complex, and a T wave. ECG can give a lot of information about the heart. However it is very difficult to analyze an ECG signal visually, hence the authors need a computer based method to analyze an ECG signal [13].
A lot of work has been done in the field of ECG signal analysis using various approaches and methods. However, all the methods used in the analysis of ECG signal has the same basic principles, For this analysis transformation techniques are used like ECG Fourier Transform, Hilbert Transform, Wavelet Transform, etc. Wavelet transform is generally used for the analysis of ECG signal because ECG signals are quasi-period, finite duration and non-stationary in nature. Wavelet transform is a very recent addition in this field and is a very powerful method for extracting ECG signals. Both Continuous Wavelet Transform (CWT) and Discrete Wavelet Transform (DWT), can be used to analyze the ECG signal but CWT has some advantages over DWT like no dyadic frequency jump in CWT and also high resolution in time-frequency domain is achieved in CWT [1].
To understand the physiological working of a body and to diagnose potential problems, of ECG signals, biomedical signal monitoring is used. ECG recording instrument [3] records the parameters which are used to analyze heart related problems.
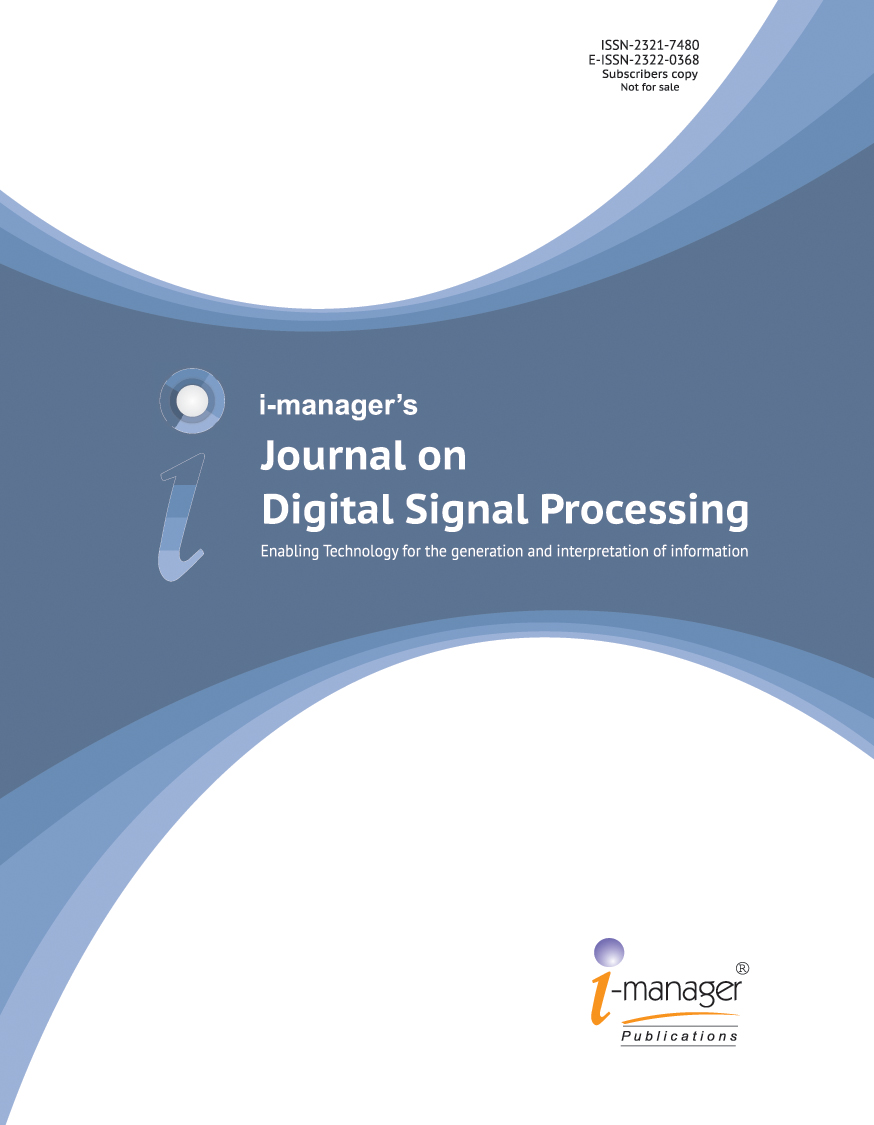
Figure 1 shows the block diagram of these two stages. Figure 2 shows the ECG signal of a normal person. Figure 3 shows the different segments of an ECG signal.
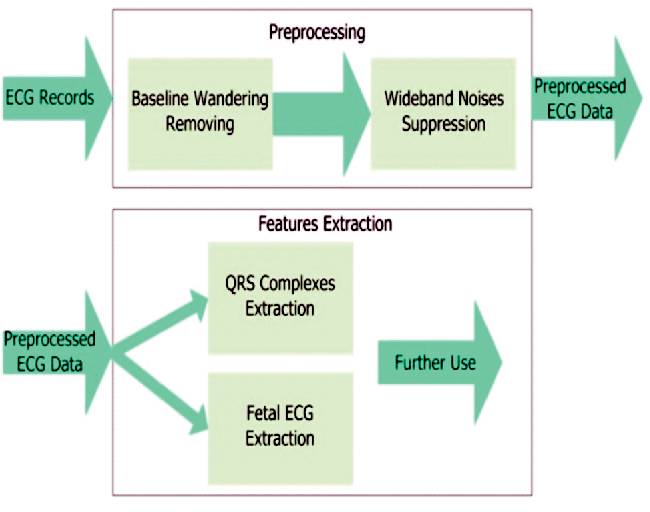
Figure 1. Block Diagram of Signal Processing [10]
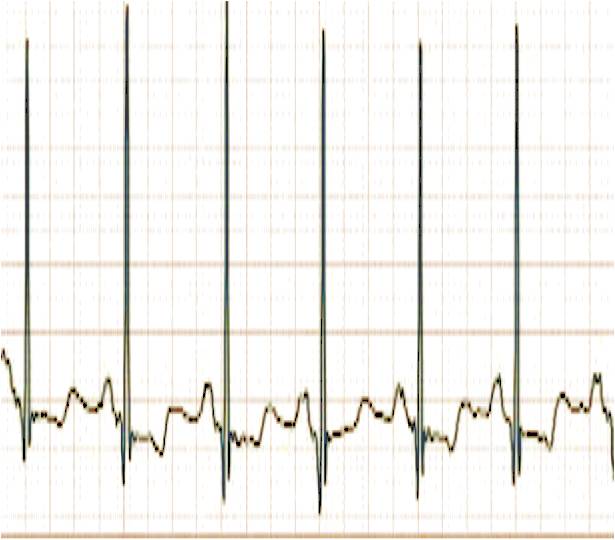
Figure 2. An ECG signal

Figure 3. Different segments of an ECG signal [11]
The authors need to extract various features for diagnosis purpose from Pre-processed ECG data including QRS interval, QRS amplitudes, R-R intervals, etc. These parameters gives us information about the heart rate and various heart related abnormalities. ECG Feature Extractor VI provides NI in LabVIEW Biomedical Toolkit to extract features of an ECG signal conveniently. Based on our requirements detect QRS only or detect all supported ECG features like R position and amplitude, iso level, QRS, P and T onset and offset can be selected.
Saket Jain et al. [14] proposed a method that deals with the study and analysis of ECG using LabVIEW Biomedical toolkit effectively. First, acquiring of an ECG signal takes place which is then filtered to remove unwanted noises like baseline wandering noise. After filtering the ECG signal, extraction of features takes place from the acquired signal. Finally, using the features extracted, different types of abnormalities can be detected like Bradycardia, Tachycardia, Atrial Flutter, Supraventricular Tachycardia (SVT) Abnormal and 1st degree AV Block. Thus, the heart abnormalities of a person is predicted by the system, even before consulting a doctor (preliminary investigation). The technique is user-friendly, low cost and efficient and hence anyone can analyze his/her ECG using this method. In this proposed work, they have analyzed different ECG signals from normal to highly abnormal comprising of different arrhythmia and blockages. The ECG parameters are determined and calculated with high precision after complete analysis of different types of signals and uses it to confirm heart abnormalities.
Castro et al. [15] in their proposed paper present an algorithm for extracting features from an ECG signal and detection of abnormalities in the heartbeats using wavelet transform, since wavelet transforms can be localized both in the frequency and time domains. They developed a method for selecting a mother wavelet from a set of orthogonal and bi-orthogonal wavelet filter bank by means of best correlation with the ECG signal. The foremost step of their approach is to remove noise. Then the ECG signal with a threshold limitation of 99.99 reconstruction ability and then each PQRST cycle is then decomposed by an optimal wavelet function into a coefficient vector. The coefficients, approximations of the last scale level and the details of the all levels, are used for the ECG analysis They divided the coefficients of each cycle into three segments that are related to P-wave, QRS complex, and T-wave. The summation of the values from these segments provided the feature vectors of single cycles.
A feature extraction method using Discrete Wavelet Transform (DWT) was proposed by Emran et al. [16]. They used a Discrete Wavelet Transform (DWT) to extract the features from the ECG signal in order to perform the diagnosis of heart. Their proposed work includes the data acquisition, Pre-processing beat detection, Feature extraction and classification. In the Feature extraction module, the Discrete Wavelet Transform (DWT) is designed to address the problem of non-stationary ECG signals. It was derived from a single generating function called the mother wavelet by translation and dilation operations. Using DWT in feature extraction may lead to an optimal frequency resolution in all frequency ranges as it has a varying window size, broad at lower frequencies, and narrow at higher frequencies. The DWT characterization will deliver the stable features to the morphology variations of the ECG waveforms.
The LabVIEW provides a VI to read ECG signals from external files that can be downloaded from the physionet site. Read biosignal VI reads biosignals from files. This VI reads biosignals block by block and supports reading multiple channels and reading annotations. With the help of Advanced Signal Processing tool kit and Biomedical tool kit of LabVIEW, ECG signals can be processed and after that, various features of ECG can be extracted to calculate various parameters like Heart rate using features obtained from the signals such as, P onset, P offset, QRS onset, QRS offset, T onset, T offset, R, P & T wave.
The Read Biosignal tool shown in Figure 4 is used to take the file path which holds the ECG signal file in TDMS format. It reads the biosignal block by block.
Figure 4. Read Biosignal VI
The authors take the MIT-BIH arrhythmia database record 100 series for analysing and feature extraction of ECG signal because the record 100 series has many noise and generally used for this kind of projects. It is a record of generally a healthy person with some heart blockage or with heart defects. The records they have taken should be in .edf format so that, it can be converted to proper LabVIEW file for LabVIEW to read it and analysis it. LabVIEW does not support .mat file or any other file provided by the physionet site. Since the data or file downloaded is of .edf format, it is necessary to first convert it in a suitable LabVIEW format so that it can read and analysed. The .edf file is first converted to .tdms file using biomedical workbench convertor [3]. Figure 5 shows the raw ECG signal that was acquired.
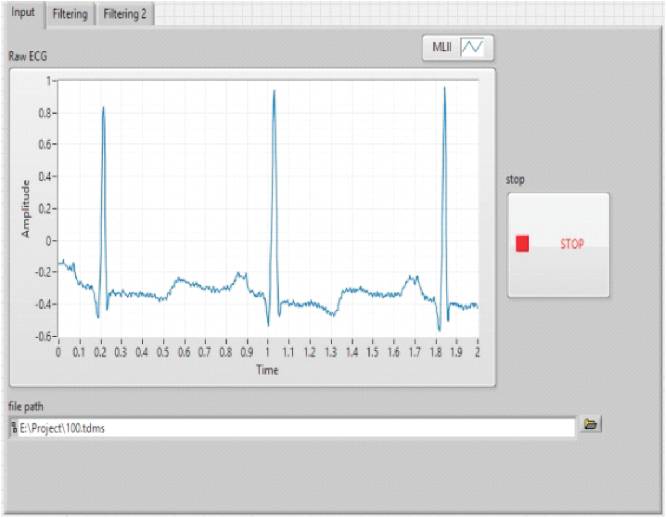
Figure 5. Acquired ECG Signal
The recorded ECG signal has noise [2] with similar characteristics as the ECG signal itself. Hence the authors need to process the raw ECG signals to extract useful information from the noisy ECG signals, otherwise the signal give incorrect information about the patient and it may lead to dangerous diagnosis. Hence to overcome this, pre-processing is necessary. Pre-processing and feature extraction are the two main stages to process ECG signals. The removal or supersession of noise from ECG signal is done in pre-processing stage and the extraction of diagnostic information from ECG signal is done in the feature extraction stage [4].
Power line interference, electrode pop or contact noise, patient–electrode motion artefacts, Electromyography (EMG) noise and baseline wandering are different types of noise that are present in an ECG signal. The noise that can strongly affect an ECG signal analysis is the power line interference and baseline wandering. The power line interference is a narrow-band noise which can be removed by the ECG signal acquisition hardware. But baseline wandering noise and other noise (wideband noise) cannot be easily supressed by hardware, and hence the software is used [5][6].
ECG signals are quasi-period, finite duration and nonstationary in nature, hence wavelet transform is used for representation and analysis of ECG signals. Fourier method is applicable where sinusoids of infinite duration and wavelet is applicable, where it is of finite duration. In wavelet transform, transformation should allow changes only in time not in shape. Digital filters are used to develop wavelet theory. DWT are of many types like Haar wavelets, Daubechies wavelets, the dual-tree complex wavelet transform, etc. DWT is generally used for signal coding as a preconditioning for data compression i.e. to represent a discrete signal in more redundant form. Filter bank, in signal processing, is the combination of band pass filters that divides the input signal into multiple components with each components that carry a single frequency sub band of input signal. The process of decomposition is called analysis and the output of analysis is subband signal with the number of sub bands equal to the number of filters in filter bank. The process of reconstruction of a complete signal from the filtering process is called synthesis. Figure 6 shows a two-band filter bank [7].

Figure 6. Two-band filter banks for (a) Analysis, and (b) Reconstruction [12]
The DWT gives the information about both frequency and location in time. The analysis of the signal is done at different resolutions (hence, multiresolution) by decomposing the signal into several successive frequency bands. The DWT has two set of functions, ø(t) and Ψ(t), each associated with the low pass filters in equation (1), and the high pass filters in equation (2) respectively.
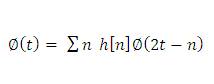
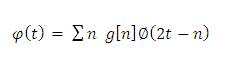
Here, h[n] and g[n] are the half band low pass filter and high pass filter respectively [7] [8]. Figure 7 shows the Wavelet transform Denoise VI which is used to remove noise in ECG signals by using the Discrete Wavelet Transform (DWT) or Undecimated Wavelet Transform (UWT). Figure 8 shows the ECG signal after removing the noises using a wavelet filter.
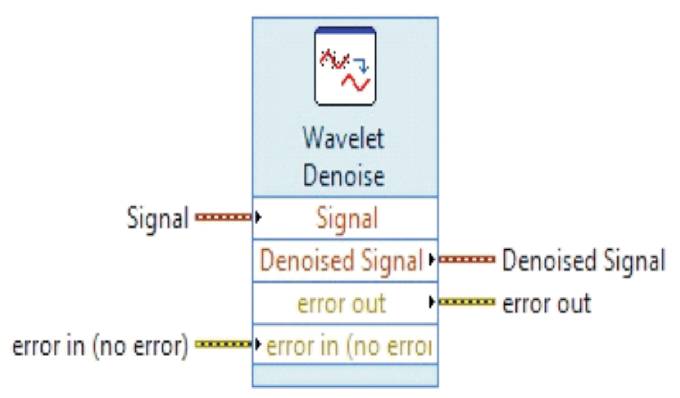
Figure 7. Wavelet Transform Denoise VI
The various feature information obtained from ECG signal is used to diagnose heart related problems. The authors need to extract various features for diagnosis purpose from pre-processed ECG data including, QRS interval, QRS amplitudes, R-R intervals, etc. These parameters gives us information about the heart rate and various heart related abnormalities. ECG Feature Extractor VI provided by NI in LabVIEW Biomedical Toolkit to extract features of an ECG signal conveniently. Based on our requirement, to detect QRS only or to detect all supported ECG features like R position and amplitude, iso level, QRS, P and T onset and offset can be selected.
ECG Feature Extractor detects QRS waves and extracts features from ECG signals. This VI can process signals online. To extract features, this VI needs signals of a complete heart beat cycle. Because of different input block size, the ECG features output might delay from the input signal accordingly. Figure 9 shows Feature Extractor of ECG signals.
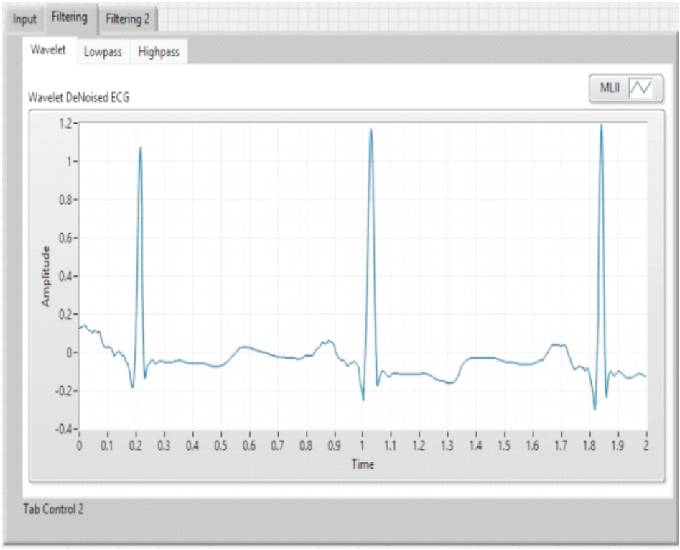
Figure 8. De-noised ECG Signal
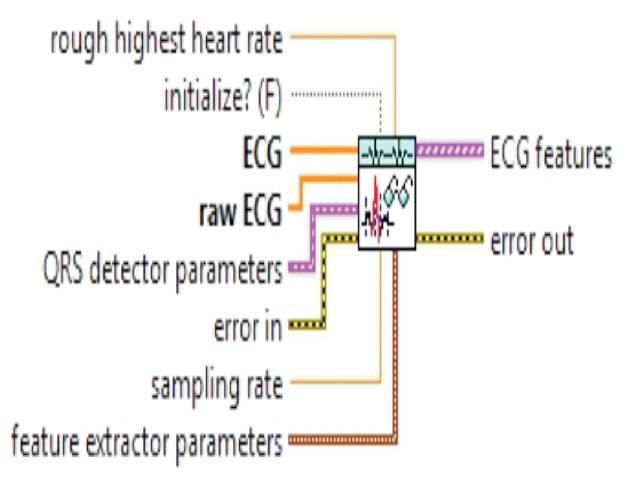
Figure 9. Feature Extractor VI
Figure 10 and Table 1 shows VI in which we have extracted various features and calculate various parameters of ECG signal.
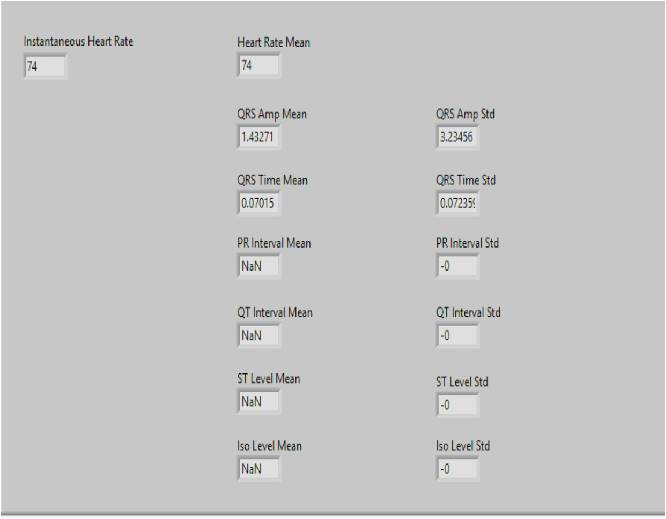
Figure 10. Various Parameters of ECG Signals

Table 1. Simulated Results
The performance of the proposed algorithm is measured on a 1.7 GHz Intel i5 laptop machine with 4 GB main memory, running on Windows 8.1 Operating System. All programs were developed in LabVIEW, version 13.0.
The authors perform their experiments on many records from the physionet site, MIT-BIH arrhythmia database. The result of the record number 100 is shown here. This is the record of persons in a healthy state. Table 1 shows the comparison of the experimental results and the results that were obtained from biomedical workbench [9] provided by NI [3].
In this paper, the authors concludes that LabVIEW can easily be used to efficiently analyze the signals and has a great effect on signal processing. By using WA detrend VI and Wavelet transform Denoise Express VI of Advanced Signal Processing tool Kit provided by NI in LabVIEW, the baseline wandering and wideband noise in ECG signal taken from MIT-BIH database 100,101 and 103 [7] has been successfully removed.
The advantage of using LabVIEW graphical programming language for signal processing is that, it reduces the hardware cost and complexity as well as provides an easy and fast understandable result. It's another advantage is that it easily removes noise and the pure ECG signal can be used to analyse the heart correctly for abnormalities.
The feature that the authors extracted can be used to detect different kinds of heart abnormalities like arrhythmia and blockages. Sinus tachycardia, atrial fibrillation, pericardial effusion, left bundle branch block, right bundle branch block, etc can be detected by observing P-wave, QRS-wave and T-wave of ECG signals which is extracted in this paper.
Also this work could be extended so that, a user can check their heart conditions anytime by designing a proper portable hardware setup.