Phosphate glasses having composition 50P2O5–30MgO–20Na2O and 50P2O5–30MgO–15Na2O-5TMO (with TMO(Transition Metal Oxides) as CuO, Fe2O3 and TiO2 ) were prepared using conventional melt quench technique and were characterized for their optical and structural properties. The absence of any sharp peak in the XRD spectra confirmed the amorphous behaviour of prepared glasses. Density of prepared glasses was found in the range of 2.51-2.62 g/cm3 . The FTIR (Fourier Transform Infrared Spectroscopy) spectra of the glasses only showed a variation in the intensity of peaks with doping of different transition elements. The band gap energy and refractive index were calculated from the UVVisible optical absorption spectra in the wavelength range of 200-900 nm. It was found that, the band gap energy was maximum for host glass (3.37 eV) and minimum for CuO doped glass samples (3.21 eV). SEM (Scanning Electron Microscope) morphology also showed the lack of any long range periodicity in the prepared glass samples.
Phosphate glasses are gaining interest these days due to their unique properties like low melting temperature (Tm ), high thermal expansion coefficient (α) and low glass transition temperature (Tm ). These properties make them g host materials for different technological applications like solid state electrolytes, low frequency waveguides, photo conductors, lasers, bioactive materials, nuclear waste storage materials and many more [1-6]. Phosphate glasses have a range of compositional and structural possibilities, that helps in tailoring different physical and chemical properties of interest. The addition of alkali and alkaline earth oxides such as Na2O and MgO to P2O5 glasses leads to the conversion of the three dimensional network of PO4 units to linear phosphate chains, which results in the formation of more non-bridging oxygen atoms, thus enhancing the chemical durability of these glasses [7- 10]. It has been proposed by many research groups that, magnesium improves the durability more, as compared to calcium. This is due to the reason that, the coordination number for Ca2+ is 6, while that for Mg2+ is 4 [11- 12]. The optical and physical properties of phosphate glasses doped with 3D transition metal oxides have been the subject of recent investigations. Phosphate glasses act as good host materials for transition elements, as they have a peculiar property that, they can accommodate the transition metal ions in their lattice without affecting the properties of the host glass. It has been confirmed by many authors that, the transition metal ions can exist in more than one oxidation state in phosphate glasses. It has been found that, for phosphate glasses doped with transition metals like Cu, Fe, Ti; Octahedral symmetry is preferred over Tetrahedral symmetry [13-16]. In the present work, the authors have reported the physical and structural properties of 50P2O5 – 30MgO – 20Na2O and 50P2O5 – 30MgO – 15Na2O-5TMO (with TMO as CuO, Fe2O3 , TiO2 ) glasses by using the techniques like XRD (X-ray Diffraction), FTIR (Fourier Transform Infrared Spectroscopy) and SEM (Scanning Electron Microscope). The main objective of this paper is to study the effect of doping of various transition metal oxides on phosphate glasses. The optical properties like optical band gap energy and refractive index were studied using the UV-Vis Absorption Spectroscopy.
Samples with composition 50P2O5 –30MgO–20Na2O and 50P2O5 –30MgO–15Na2O-5TMO (with TMO as CuO, Fe2O3 , TiO2 ) were prepared using the Conventional Melt Quenching technique. Analytical grade chemicals such as P2O5 , MgO, Na2CO3 , Fe2O3 , CuO, and TiO2 (Sigma Aldrich) were used as the starting materials. They were mixed in appropriate amounts and were grinded for 30 minutes and a homogeneous batch of 20 g was prepared. The grinded mixture was melted in a high quality alumina, crucible for 1hr at 1050 oC in an electric furnace. The melt was then poured onto a preheated graphite mould at temperatures varying from 380 oC-420 oC for 1hr, to remove the internal stresses. The final samples were then grinded and polished to obtain uniform thickness of about 3 mm and good transparency.
XRD studies of all glass samples were carried out using Cu Kα radiation in XRD -7000 Shimadzu X-Ray Diffractometer at scanning rate of 2o per minute in the range of 20o -80o.
Density of prepared glass samples was measured at a room temperature using Archimedes' principle with Dibutyl phthalate (DBP) as the immersion liquid. The density of the samples was measured using the standard relation,
where,
Wa - weight of glass sample measured in air,
W1 - weight of glass sample measured in immersion liquid,
and
ρ1 - density of immersion liquid.
The measurement was repeated four times to obtain an accurate density value. The average value was used for further analysis. The Molar Volume (Vm ) of the glass was m obtained from density using the formula:
The Infra-red (IR) transmission spectra of the prepared glass samples were measured in the frequency range of 400- 3500 cm-1 using Shimadzu Fourier Transform computerised Infrared Spectrophotometer, with a resolution of 4 cm-1 . FTIR transmittance spectra were recorded on glass pellets formed by mixing the powdered glass samples with KBr in the ratio of 1:100 respectively. The mixture was then subjected to a pressure of 8 tons/cm2 in order to obtain clear homogeneous pellets of 10 mm diameter. As KBr is hygroscopic, the FTIR transmission spectra were recorded immediately after preparing the pellets.
The optical absorption spectra of polished glass samples having thickness 3 mm were recorded using UV-Vis Perkin Elmer Lambda 35 Spectrometer in 200-1100nm range with 2 nm resolution. The indirect bandgap energy was then used to calculate the refractive index of glass samples.
Scanning Electron Microscopy investigations were performed on the gold coated glass samples, in order to reveal the noncrystalline nature of the host and transition metal doped phosphate glasses using Carl Zeiss SUPRA 55 Field Emission Scanning Electron Microscope.
Figure 1 shows the Powder X-ray diffraction patterns for all the prepared glasses. Absence of any continuous or discrete sharp peak confirms the amorphous nature of prepared glasses. A broad hump at nearly 22o is observed, which is the characteristic of the glassy nature of the prepared samples.
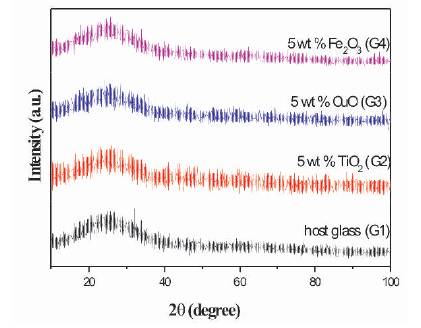
Figure 1. XRD Spectra of Host and TMO doped Phosphate Glasses
Figure 2 shows the variation of density and molar volume as a function of different transition metal oxides in the glass samples. The density of the glass samples lies in the range 3 2.51-2.62 g/cm3 . The density of phosphate glasses is affected by the packing fraction of the structural units, which further depend upon the phosphate chain lengths. The density of host glass was found to increase with doping of different TMO. It has been found that, the density of Fe2O3 doped glass is maximum and that of TiO2 doped glass is minimum. The molar volume just followed the reverse trend. The density and molar volume values show that, Fe2O3 doped glass is more compact and denser.
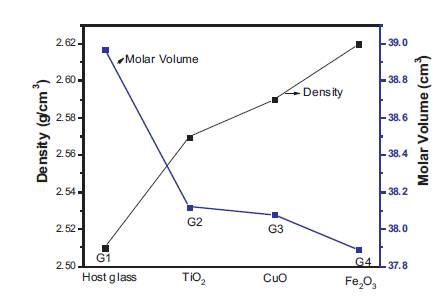
Figure 2. Density and Molar Volume of Host and TMO doped Phosphate Glasses
Figure 3 shows the FTIR spectra of the prepared glass samples in the frequency range 400-3500 cm-1 at room temperature. For the prepared phosphate glasses, there are six prominent transmission bands observed at 1280, 1100, 1000, 900, 750 and 520 cm-1 respectively. With transition metal doping, the IR pattern essentially remains the same, except the intensity of bands. Strong band near 1280 cm-1 is assigned to the asymmetric stretching modes of (PO2)- . The band near 1100 cm-1 has been assigned to the asymmetric stretching of the (PO3)2 - bonds [17-19]. The band at 1000 cm- 1 corresponds to the symmetric stretching of the (PO3)2- bonds. The band at 900 cm-1 has been assigned to the asymmetric stretching of P-O-P bonds. The band near 750 cm-1 corresponds to the symmetric stretching vibrations of P-O-P bonds. The addition of only 5 mol % of transition metal oxides does not significantly correspond to any new peak, but the intensity of some bands vary in a limited manner. The band at 525 cm-1 are attributed to P-O bending. The bands from 430- 470 cm-1 appeared due to characteristic frequency of (P2O7)4- group and are observed in the most of binary and 2 7 ternary phosphate glasses [20-22]. The comparison of different peaks as observed in FTIR spectra of various glass samples as shown in Table 1.
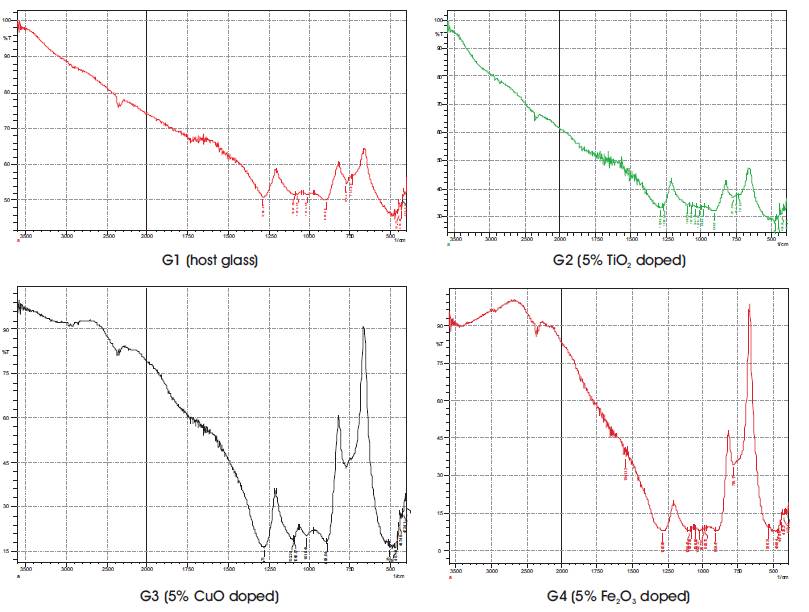
Figure 3. FTIR Spectra of Host and Transition Metal Oxide doped Phosphate Glasses
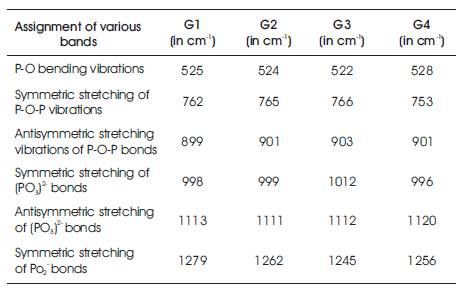
Table 1. Various Bands as observed in FTIR Spectra for different Glass Samples
Figure 4 shows the UV-Visible optical absorption spectra of all prepared glasses. The characteristic curve for all the glass samples exhibit the same behaviour, except their onset value of the absorption edge. With TM doped samples, the observed induced bands are virtually varying and are related to the type of sharing of TM ions [23- 24]. There is no absorption band corresponding to the visible region for host, Fe2O3 doped and TiO2 doped phosphate glasses, as these glasses are colourless. However, the glass doped with CuO is blue in colour and showed a strong peak in visible region at 400 nm due to the presence of Cu2+ ions. The absorption coefficient (α) for these glasses is related to Eoptical , by the power law suggested by Davis and optical Mott, which can be expressed as
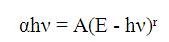
where,
A - constant,
hν - incident energy,
E - bandgap energy, and
r - parameter,
where ‘r’ depends upon the type of transition and can have values like ½, 2, 3 and so on. As given by Davis, Mott and Tauc, the value of r for indirect transitions in the glass is 2. Hence a plot of (αhν)1/2 versus hν will result in a curve and if the straight line region on the curve is extrapolated to the x - axis with α = 0, it will give the value of optical band gap in the glass.
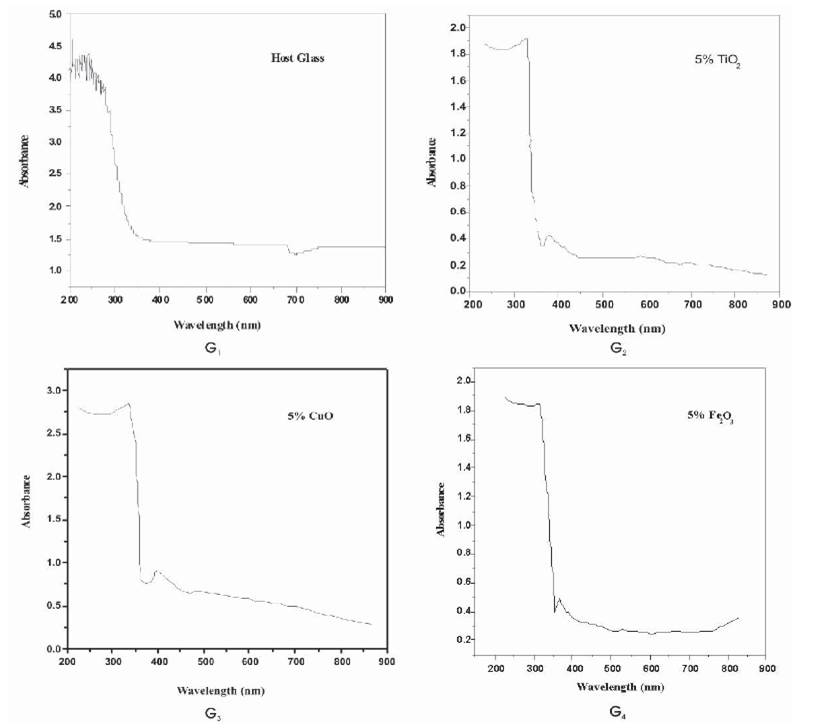
Figure 4. UV-Visible Absorption Spectras of Host and TMO doped Phosphate Glasses
Figure 5 shows the Tauc plots for the prepared glass samples. The optical bandgap is then used to calculate the refractive index of the glasses. The values of optical gap (Eoptical) are summarized in Table 2. For glasses without any transition metal, Eoptical is found to be 3.37eV. Incorporation of 5 mol % of different transition metal oxides results in decrease of optical bandgap. This can be explained on the basis of conversion of bridging oxygen atoms to the non bridging oxygen atoms with doping. Optical transitions in doped glasses arise due to the excitation of electrons from the levels occupied by the oxygen atoms to that occupied by the metal ions. The negative charge present on the non bridging oxygen atom facilitates the excitation of its electrons to the higher energy level, as compared to the bridging oxygen atom, where there is no charge. Hence, there is increase in the concentration of non bridging oxygen atoms, which is further associated with the decrease in the Eoptical values. Thus, it has been found that, the optical gap Eoptical values for the glasses doped with transition metal oxides is lower than that of the undoped host glass and the refractive index of the phosphate glass lies in the range of 2.30-2.34.
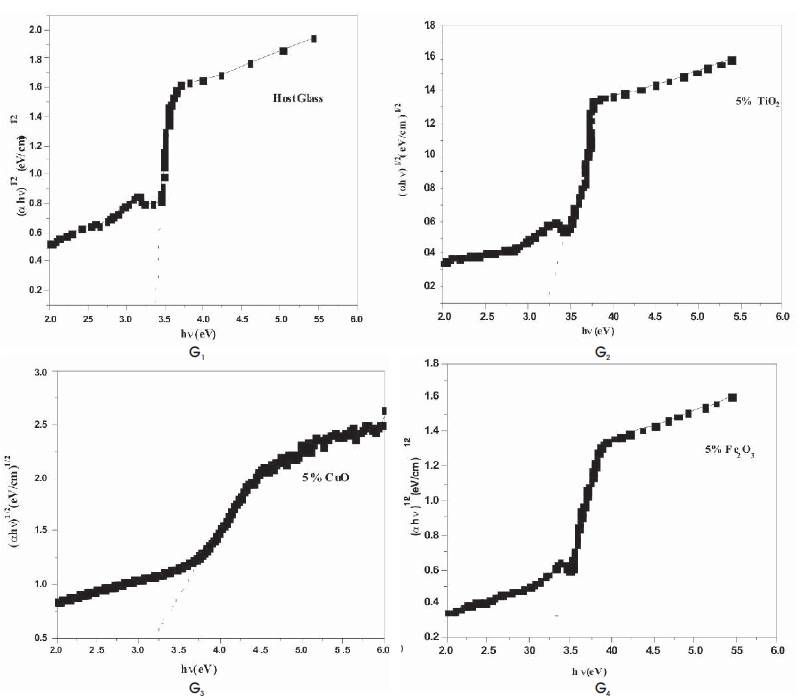
Figure 5. Energy Gap of Host and TMO doped Phosphate Glasses
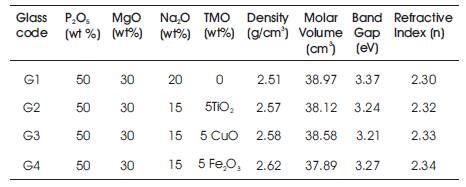
Table 2. Nominal Composition (in weight %), Density, Molar Volume, Optical Band Gap and Refractive Index of prepared Glass Samples
Figure 6 shows the morphology of host glass and transition metal doped phosphate glasses. The microstructure and morphology of the glass samples are examined under Scanning Electron Microscope. The sample was placed on sample holder using silver tape, and was coated with layer of gold using Quorum sputtering unit, to make them conductive. The electron beam was produced with a 15 kV accelerating voltage and was directed on to the coated samples. No regular pattern is observed, which shows glasses are noncrystalline.
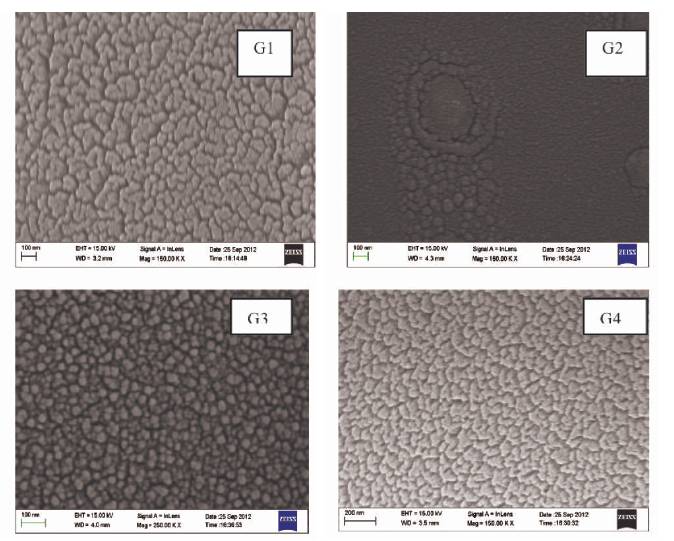
Figure 6. SEM Analysis of the Transition Metal Oxide doped Phosphate Glasses
The density of the glasses varies with the addition of transition metal oxide glasses and Fe2O3 doped glass is found to have more compact structure. Infrared spectroscopic measurements indicate the presence of absorption bands due to characteristic phosphate groups as main glass constituent. The effect of TMO on FTIR spectra is limited because of their low doping limit in the host glass. Transition metal doped phosphate glasses show strong absorption bands in both UV and visible region, which are the characteristic of each transition metal ion. The optical band gap decreases as compared to the host glass, due to increases in the concentration of non bridging oxygen atoms, with the doping of different TMO. The absence of any regular pattern in the XRD and SEM pictures reveals that, the prepared glasses are amorphous and lack in any long range periodicity.