 |
i-manager's Journal on Instrumentation and Control Engineering |
View PDF |
|||
| Volume :4 | No :1 | Issue :-2016 | Pages :17-23 | ||
Time taken by the hospital authority to understand the condition of the patient is crucial in saving a patient's life. So need for tracking the patient's health conditions such as Heart rate, body temperature, Blood Pressure (BP), ECG signal, fatigue, air lung volume and vital-signs like patient physical appearance are sent to the hospital. All these parameters are monitored in the hospital, and also can be accessed by Doctors from anywhere. The system will allow emergency room doctors to get a real-time overview of patient's condition prior to their arrival at the hospital. This will help them to be prepared in advance to treat the patients once they arrive. This also helps them in proper intervention and intensive patient monitoring accordingly. In this paper, a real-time patient monitoring system in the ambulance while in transit is designed to transmit all the above patient vital parameters to the Hospital and the Doctor. The algorithms were also implemented to detect the abnormalities in these parameters. The system is implemented using LabVIEW real-time environment and Bio-sensors are interfaced through signal conditioning circuit to NI USB – 6281. This paper is a part of real time project funded by UGC India.
Patients from remote places can greatly benefit from technologies that continuously monitor their vital parameter status until they are admitted to the hospital [3]. This paper explains the design and developed system for real-time patient monitoring in ambulance while in transit. This system is an integration of vital signs bio sensors, electronic patient recorder and web technology to allow remote monitoring of patient vital-sign status. This system shall facilitate coordination between patient attendant from ambulance and medical professionals at hospitals, and specialists or experts who can provide consultation from another location. The information about the patient can be stored in a database as a cloud and can shared by different doctors simultaneously [5]. Web Publishing tool in LabVIEW software can be used to monitor the patient and assist the ambulatory staff [6].
In this paper, a real time patient monitoring system in ambulance while in transit is designed to transmit patient's health conditions such as Heart rate, body temperature, Blood Pressure (BP), ECG signal, fatigue, air lung volume and vital signs like patient physical appearance are acquired by using Data Acquisition Board (DAB) [7] and are sent to the hospital and Doctor. The algorithms are also implemented to detect the abnormalities in these parameters. The system is implemented using LabVIEW real time environment and Bio-sensors are interfaced through signal conditioning circuit to NI USB – 6281. This paper is a part of real time project funded by UGC India.
This research work is carried out by keeping the following objectives in mind to provide a real time solution:
The system implemented can be placed on board in an ambulance to measure and transmit real-time patient information continuously and also the patient visuals to the hospital by using Mobile Network or telephony [4]. This information can be received at the hospital by Doctors for initial patient health assessment and preparation by discussing with other experts before the patient reaches the hospital. The Doctors can also suggest for first aid treatment to the patient by ambulatory staff in case of accident and snake poisoning cases.
The block diagram of a real-time patient monitoring system is shown in Figure 1. The vital patient parameters are measured using bio-sensors and then converted into electrical signals to interface with a Computer using Data Acquisition Board (DAB). The signal processing is done using LabVIEW software. This data is then transferred to the hospital using Internet Toolkit and web publishing toolkit of LabVIEW. Also the bio-signals are monitored to check any abnormalities using the designed algorithms.
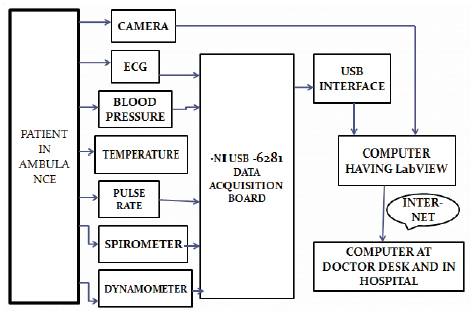
Figure 1. Block Diagram of Proposed System
To check the ECG abnormalities, algorithm is implemented such that, it will measure P-R , QRS and Q-T intervals and will compare with normal values. Also, it will display the alarm in case of abnormalities found. The blood pressure is monitored by using algorithm, hypotension or hypertension condition can be detected. The heart rate is measured to detect life threatening diseases like arrhythmias, which may affect pumping functionality of the heart. The arrhythmias may be either tachycardia (for faster heartbeat i.e. more than 100 beats per minute) or bradycardia (for very slower heartbeat i.e. less than 60 beats per minute). The patient body temperature measurement is measured to determine fever, Hypothermia and Hyperthermia.
The dynamometer is used to access muscular fatigability. The Spirometer is used to in the pulmonary function assessment where the air volume exhaled from the Lungs after the maximal expiration is monitored. For video conferencing purpose among Doctor, ambulatory staff and hospital staff, the vital parameters monitored are transferred using a web publishing tool through internet.
System design and implementation is done using real-time monitoring and control using Virtual Instrumentation Technology with LabVIEW software and associated hardware like biological sensors, camera and other medical equipments.
The following steps are implemented to meet project objectives:
The Electrocardiogram (ECG) Sensor is a standard 3-lead that measures electrical signals produced during muscle contractions. Each of the three leads to the sensor connects to disposable electrodes. The ECG graph as shown in Figure 2 gives the contraction and repolarization of the heart's chambers. The ECG electrodes placed on the surface of the skin record a summation of action potentials and give rise to resultant voltage. Each heart cycle is represented by a P wave, a QRS complex, and a T wave. The P wave corresponds to the depolarization of the atria, the QRS complex corresponds to the depolarization of the ventricles (repolarization of the atria also occurs during this time), and the T wave corresponds to the repolarization of the ventricles. Figure 3 shows a typical ECG signal and Table 1 gives the typical time spans for each deflection. Figure 3 shows the front panel of ECG measurement in LabVIEW.
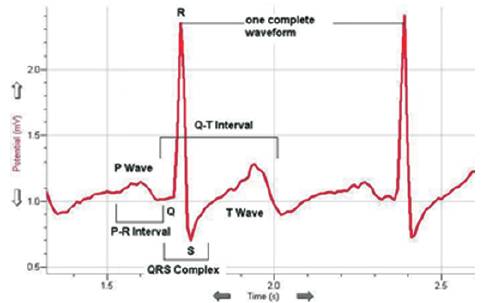
Figure 2. ECG Features
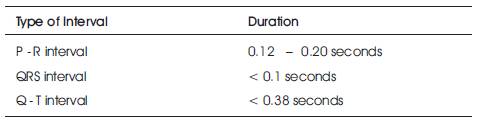
Table 1. Typical Time for Deffection
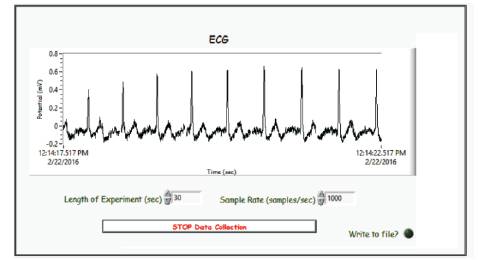
Figure 3. Front Panel of ECG Measurement in LabVIEW
The abnormalities in ECG can be detected using LabVIEW. Figure 4 shows the different ECG signals. These signals can also be useful to determine cardiogenic shocks [10] . The implemented algorithm in LabVIEW is shown in Figure 5.
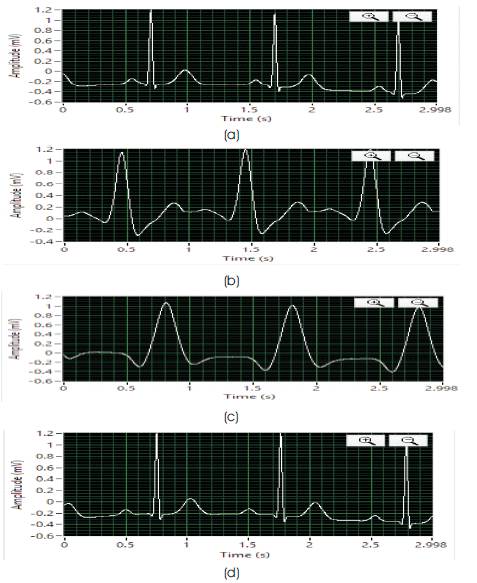
Figure 4. Different ECG Signals (a) Normal ECG Signal, (b) Atrial Tachycardia, (c) Ventricular Tachycardia, (d) Atrioventricular Block
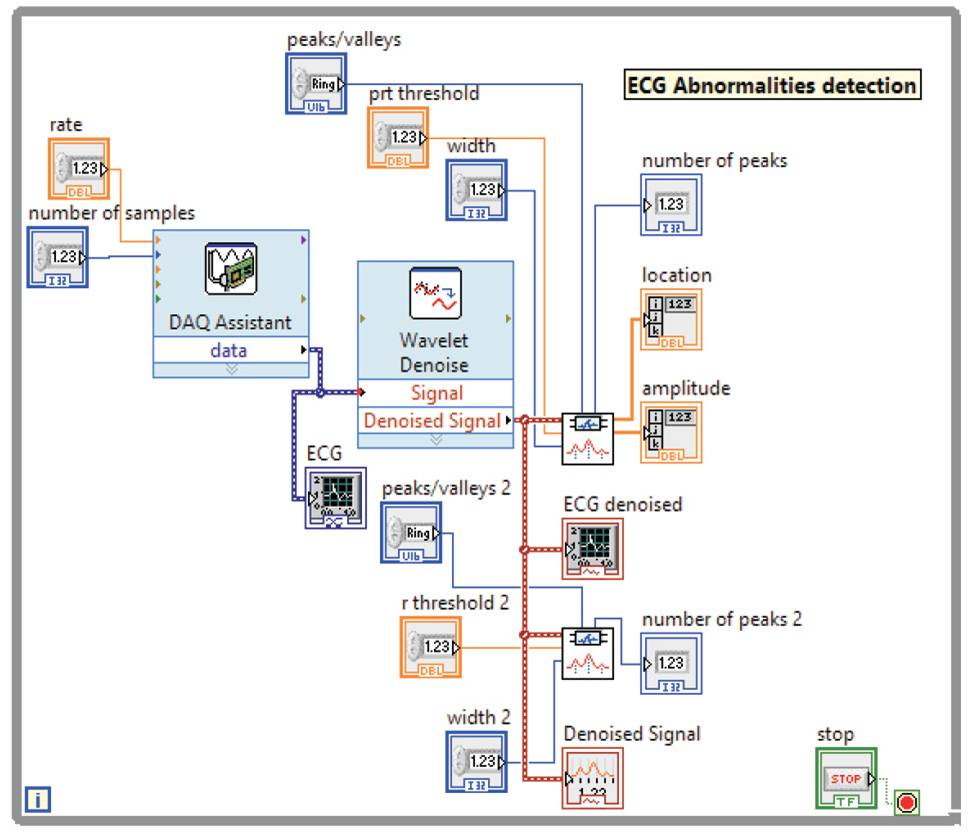
Figure 5. ECG Abnormalities detection
Blood pressure is one of the important sign showing the health conditions of a person. Blood pressure level stays high, over time termed as hypertension can damage the body in an indirect yet serious way. Since, the circulating blood goes to all the organs in the body, high mechanical pressure makes the heart work harder and thickens the walls of arteries. As a result, the heart muscles become weaker and becomes less elastic over time. Long term hypertension can lead to heart attacks, chokes, organ failure such as chronic renal failure. Hypotension occurs when blood pressure drops suddenly and supply the blood to the brain deprives suddenly which can lead to dizziness or lightheadedness. This inadequate blood flow can cause strokes, heart attacks and even kidney failures.
The Blood Pressure sensor uses oscillometric method to measure the systemic arterial blood pressure in human in a non-invasive way. This device converts pressure into voltage. In the oscillometric method, cuff pressure rises rapidly to higher level than a systolic arterial pressure to stop blood flow. The cuff pressure slowly forces the blood flow in short pulses. As the cuff pressure continues to decrease, the pulses progressively reaches a maximum value and then, decreases until the occlusion is removed. These pressure pulses form an oscillating waveform that describes systolic, diastolic pressures and MAP (Mean Arterial Pressure). The cuff pressure related to the maximum amplitude can calculate MAP. That can be used to calculate minimum and maximum blood pressures. The cuff pressure is measured and interfaced to PC using USB 6281 where, it is processed using LabVIEW software .
Table 2 shows the normal and abnormal blood pressure ranges [1].
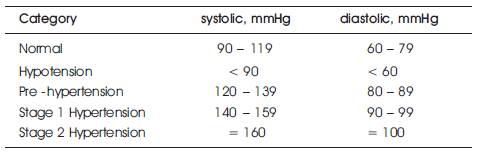
Table 2. Normal and Abnormal Blood Pressure Ranges [1]
The Blood Pressure sensor module front panel in LabVIEW is shown in Figure 6.
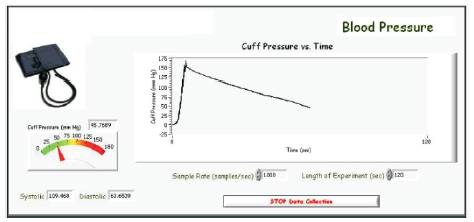
Figure 6. Blood Pressure Measurement Front Panel in LabVIEW
The Heart Rate sensor measures the heart rate by registering the small electrical signals carried across the surface of a person's skin each time the heart contracts [2]. This signal is measured at the surface of the skin by electrodes embedded in the hand grips of the Hand-Grip Heart Rate sensor. By graphing this signal, the heart rate can be determined.
With this, one can plot a pulse for each heart beat and analyze the time between the peaks to determine the heart rate using LabVIEW as shown in Figure 7.
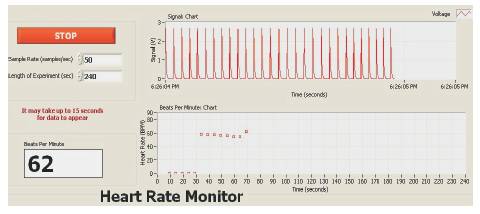
Figure 7. Heart Rate Monitoring LabVIEW Front Panel
The body temperature measurement is useful to determine fever, Hypothermia and Hyperthermia [8]. A thermistor is used to determine body temperature of the patient. The LabVIEW front panel for temperature measurement is shown in Figure 8.
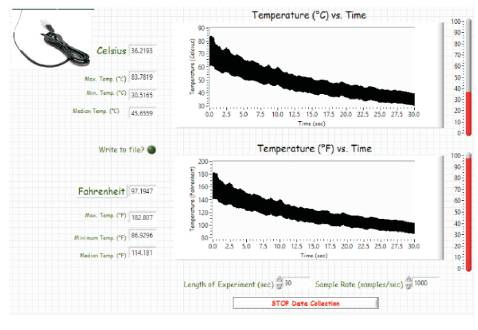
Figure 8. Temperature Monitoring LabVIEW Front Panel
Fatigue Measurement is done by using Dynamometer which consists of strain-gauge that can be used to measure grip strength and muscle fatigue studies in Newtons or kilograms force. By holding the Dynamometer once by finger and then by Gripping it , one can find grip strength and fatigue. The LabVIEW front panel for fatigue measurement is shown in Figure 9 and by Gripping it, one can find the grip strength and fatigue.
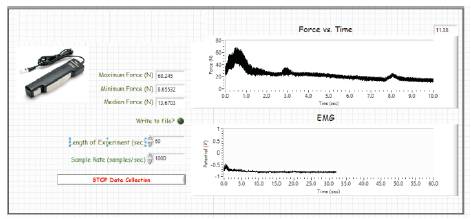
Figure 9. Fatigue Monitoring LabVIEW Front Panel
Spirometric Measurement of air volume in lung provides information about normal function of the lungs and also related respiratory diseases. Spirometry measures the amount (volume) and/or speed (flow) of air that can be inhaled and exhaled. Chronic Obstructive Pulmonary Disease (COPD) is typical of the diseases that cause narrowed airways. The spirometer LabVIEW of front panel is shown in Figure 10.
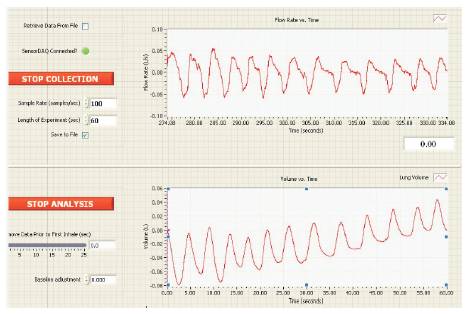
Figure 10. Spirometer LabVIEW Front Panel
The patient information from the ambulance can be transmitted to hospital using a LabVIEW web Publishing tool. The 3G internet facility can be used for data transfer purpose. LabVIEW has an internet toolkit including the Graphic Web Server, which is used to run applications on the Web. Server and CGI (Computer Generated Imagery) applications intercommunicate through standard inputs and output. The front panel of the VI's (Virtual Instrumentation) will be shared with the doctors.
Thus, the patient vital parameters are measured in the ambulance and monitored in the hospital and also can be accessed by Doctors from anywhere.
The implemented system will allow emergency room doctors to get a real-time overview of patient's condition prior to their arrival at the hospital. This will help them to be prepared in advance to treat the patients once they arrive. Figure 11 shows web published front panel of the system implemented in LabVIEW.
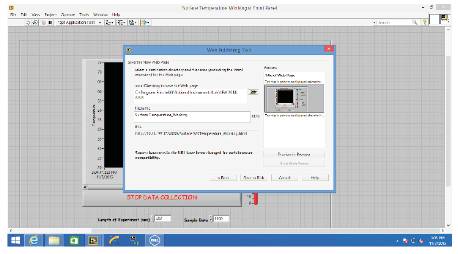
Figure11. Web Page URL Created for Data Transfer
Figure 12 shows the implemented system hardware configuration which will be converted into a compact and rugged prototype.
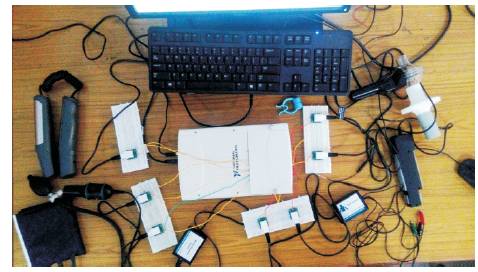
Figure 12. Implemented System Experimental Set up
The readings from ECG readings reveals that for a good health patient, the amplitudes are around 1mV for the top of the Q wave to the bottom of the S wave, 0.1 - 0.3 mV for the P wave, and between 0.2 - 0.3 mV for the T wave.
PQ interval is approximately 0.16 seconds. QT interval is 0.35 seconds. From the time period between two QRS complexes is 0.8 seconds which can be inversed to get indication of number of beats per second is the inverse, 1.25 beats / second. By multiplying this by 60 gives 75 heart rate per minute. By measuring blood pressure, detection of hypotension and hypertension is done with LabVIEW code. Also temperature, air lung volume and patient fatigue are also detected. These parameters are monitored on front panel designed in LabVIEW. The parameters are transferred to the hospital and the Doctor by creating an URL web page with a LabVIEW web publishing tool and transferred with 3G internet. Thus, a real time patient monitoring system in ambulance while in transit is designed to transmit all the patient vital parameters to the hospital and Doctor.
The algorithms are also implemented to detect the abnormalities in these parameters. The system is implemented using LabVIEW real-time environment and Biosensors are interfaced through signal conditioning circuit to NI USB – 6281.
Thus, the system implemented will monitor and transfer patient vital parameters continuously to hospital from the ambulance from remote location using the created URL Web page. This URL web page can be shared at the same time by different Doctors. Also the system will provide alerts for abnormalities in the measured parameters. This will allow emergency room doctors to get a real-time overview of the patient's condition prior to their arrival at the hospital and in advance the preparations to treat the patients once they arrive. By using Camera Acquisition System in ambulance and hospital, a video conferencing facility can be provided for First Aid Treatment. Like way, the time taken by the hospital authority to understand the condition of the patient can be minimized which can be useful in saving a patient's life.
This paper is the part of the project titled “Design And Implementation of Algorithm for Real-Time Patient Monitoring in Ambulance While Transit”, under Minor Research Project funded by the University Grants Commission (UGC) of India . The authors gratefully thankful to VNR Vignana Jyothi Institute of Engineering and Technology, Hyderabad, India for providing support and facilities.
