 |
i-manager's Journal on Wireless Communication Networks |
View PDF |
|||
| Volume :4 | No :4 | Issue :-2016 | Pages :1-9 | ||
The mobility manager specifies the way the nodes move through space during simulation. It holds location state that other modules can access at any time using a function call, and it notifies the wireless channel periodically of the position of a node. According to Castalia Manual, it implements only one mobility pattern module, the simple Line Mobility Manager. This will allow the user to define a simple line as a path for his node. Therefore, nodes can only move with this line. The user just describes the destination point of a line segment (starting point is the starting location of the node) and thus defines a trajectory for the node to move back and forth. Additionally, Castalia has no 3D visualization engine, and therefore users cannot visualize their simulated nodes and space in 3D. In this paper, an enhanced mobility manager will be presented to overcome many drawbacks of Castalia's traditional mobility manager. The presented mobility manager can deal with paths rather than lines. This will allow users to simulate nodes moving with any possibilities within the simulation space. Additionally, a 3D visualization engine will be integrated so that users can visualize their simulated 3D spaces and node easily.
Lately, researchers began to explore the use of Wireless Sensor Networks (WSNs) in low-quality image-based applications like process control, industrial automation, quality control using image processing, video surveillance, multimedia streaming, and medical imaging. The success of such attempts has created a new challenging area of research, Wireless Multimedia Sensor Networks (WMSN).
WMSN are wirelessly connected nodes that are able to retrieve and transmit multimedia content like video and audio streams. The basic concept is inherited from WSN and by using a set of inexpensive sensor nodes equipped with low-cost cameras or microphones in the targeted applications like cameras on city streets to monitor traffic flows, or the number of cars in parking.
Nodes in WMSNs are usually characterized as nodes that need to do multimedia (video/audio) operations in the most reliable and power-efficient manner. Again, the emergence of low- cost technologies in image/video sensory (CMOS image sensors and microphones), digital signal processing as well as wireless communication have most impact on enabling and the spread of WMSNs[1-3]. While WSNs operated on simple scalar measurements, WMSNs deal with more complex vector-based data such as, video and audio [4], where hundreds or thousands of media sensing devices, communicating by means of wireless transmission, form WMSNs that serve different applications.
With the fast progress in hardware evolution, a single WMSN node supports one or more audio/video sensors. Along with the rapid development of fast processing units, WMSN has the ability to retrieve multimedia data, store them, process them in real-time, or fuse multimedia data from even heterogeneous sources.
A wide variety of applications of WMSNs in military and civil sectors include, and not limited to, those relating to surveillance [5-8], traffic monitoring and control [9-10], health care [11-12], environmental monitoring[13] and industrial process control [14]. WMSN has not only enhanced the existing WSN applications such as tracking, home automation, and environmental monitoring, but they have also enabled several new applications [15- 19].
Currently available WSN tools may be adapted for WMSN. However, this requires more effort to configure and tune such tools for the requirements of current WMSN. On the other hand, many extensions to the available WSN tools were developed to extend their functionalities in order to support WMSN. Although this seems to solve the problem, such extensions are usually developed as layers or plugins over the existing ones, which introduce many performance issues and limit their scalability.
The identified drawbacks/shortages of available simulation platforms are directed to a novel platform that is capable of supporting WMSNs with general multimediacentric operation. The novel simulation framework is basically an extension to one of the most powerful eventoriented simulation environment, the OMNET++ framework. Equipped with Castalia, an extension to enable WSN, the OMNET/Castalia integration served as a solid simulation ground for basic WSN operations. The developed framework extends OMNET/Castalia to further multimedia based operations by adding the following enhancements:
The Mobility Manager class in Castalia defines a base for any mobility manager module and provides several functions to help with the operations of the module. All mobility manager modules should be derived from this base class. However, unlike the app/routing/MAC base classes, which already define OMNeT’s handleMessage(), in a Mobility Manager module the user has to define this method. In this paper, the Castalia extension processes go on by supporting different mobility modules to allow unconstrained paths for nodes, the feature that is not included in Castalia. Additionally, a novel 3D visualization tool is developed so that users can visualize their simulated networks. Figure 1, provides an easy way to see all the modules in Castalia system and also show their hierarchical relations.

Figure 1. Modules and their Hierarchical Relations in Castalia System
OMNeT++ [20-23] is a C++ based discrete event simulator for modeling communication networks, multiprocessors and other distributed or parallel systems. OMNeT++ is public-source, and can be used under the Academic Public License that makes the software free for non-profit use. The motivation of developing OMNeT++ was to produce a powerful open-source discrete event simulation tool that can be used by academic, educational and research-oriented commercial institutions for the simulation of computer networks and distributed or parallel systems. OMNeT++ attempts to fill the gap between open-source, research-oriented simulation software such as, NS-2 [24] and expensive commercial alternatives like, OPNET [25]. OMNeT++ simulation programs possess a modular structure. The logical architecture is shown in Figure 2. The Model Component Library consists of the code of compiled simple and compound modules. Modules are instantiated and the concrete simulation model is built by the simulation kernel and the class library (Sim) at the beginning of the simulation execution.
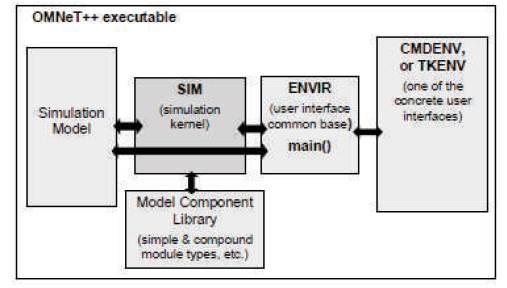
Figure 2. Logical Architecture of an OMNeT++ Simulation Program
In this section, the requirements for the enhanced mobility manager is first presented and discussed. Comparisons are made between the two concepts from the original mobility manager and the enhanced mobility manager. Then, the enhanced mobility manager is developed and implemented within the simulation engine.
As stated, Castalia has only one mobility manager; the Line Mobility Manager. It is able to simulate a node moving from starting position to the final destination position. Table 1 presents the parameters of the Castalia's line mobility manager. The user specifies target coordinations and the speed of moving. Additionally, he has to specify a fixed update interval. This temporal interval defines when the simulator updates the position of the node.
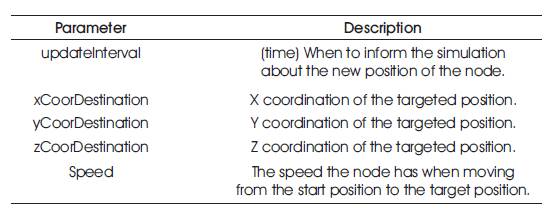
Table 1. Parameters of Castalia's Line Mobility Manager
Figure 3 presents a simplified view of the line mobility manager. As simulation progress, the manager has to decide when to update the node position. Based on the fixed update interval, the manager calculates what will be the distance made by the moving node. Then, at this scheduled update interval, the manager notifies the simulation about the position of the node. The main drawbacks of this technique are:
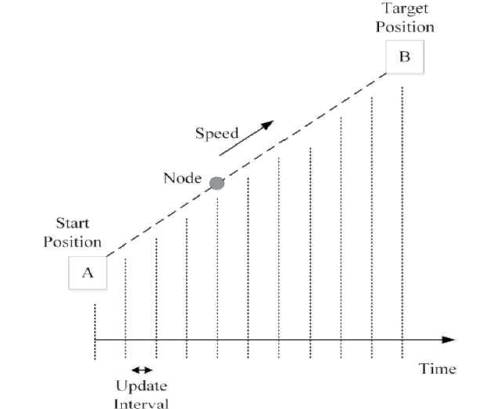
Figure 3. Simplified 2D Description for the Operation of the Line Mobility Manager
This shortage in functionality and the possibility of simulation per formance drawbacks cannot be neglected within a solid multimedia simulation framework. Therefore, different requirements are defined to improve Castalia's mobility manager. The new mobility manager should be able to handle a path not a line. Therefore, the users can specify any movements within the simulated space. Paths are originally a set of nodes with lines between. The moving speed between each two points in the line should not be fixed. This will allow for more flexible simulation cases. Finally, mobility should not be attached with a fixed time interval. It can be attached with a fixed incremental step in the inner distances of the path. This should be set by the user to allow him control the trade-off between simulation speed and mobility accuracy. Figure 4 presents a description of such requirements.

Figure 4. Simplified 2D Description for the Operation of the Presented Mobility Manager
The user defines his own target points/positions (A1, A2 ... AN) and the speed the nodes should move between (Speed 1, Speed 2 ... Speed N). Additionally, he specifies the update distance step rather than an update interval. This means that the simulation will be notified with a new position only when the node moves a distance equal to the update distance step. This helps the user to directly control a trade-off between simulation speed and mobility accuracy.
The mobility manager should continuously update the node position according to the specified node targets and with the specified update distance step. Because speed is not fixed between nodes, it should be noted that the resulting update interval may not be equal from different line to another. This is not a concern, but the user need to be aware of because fast speeds with long steps may exclude some points from the result (i.e. the manager will not update them and will go to next points). Therefore, the user needs to balance between the provided speeds and update step.
Based on the identified requirements in subsection 1.1, the new mobility manager was developed as a dedicated module within Castalia's subsystem. As specified by Castalia development manual [26], any new mobility subsystem module should be described in a NED file and two source code files: one for the object header and the other for the object code.
Table 2 shows the parameters of the new mobility manager. They reflect the presented requirements to handle path mobility rather than simple line mobility. Figure 5 shows the flowchart of the path mobility algorithm.
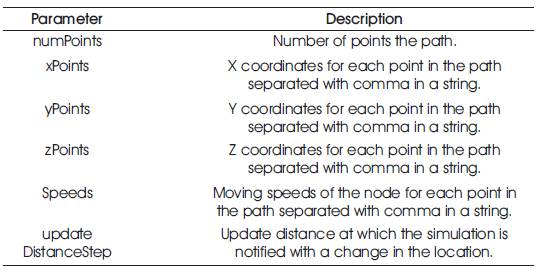
Table 2. Parameters of the Novel Path Mobility Manager
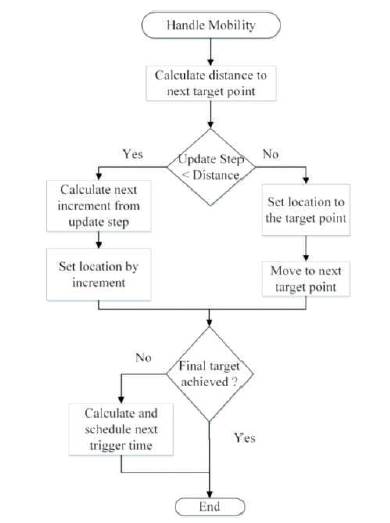
Figure 5. Simplified Algorithm of the Path Mobility Management System
The algorithm is handled based on schedules specified by the algorithm itself, but managed with the OMNet++ event management subsystem.
When it is called, the algorithm calculates the distance from current location to the next point in the path. If the specified update distance is less than what is remaining to reach the target, the algorithm uses the update distance to specify the next location in the path and calculates this from an increment of the current location. Otherwise, the next location is directly set to the next target, this target point is considered done and the next point in the path becomes the new target point.
Then, the algorithm checks whether we have landed on the final point of the path or not. If not, it sets a new event so that it will be called again to repeat the process.
A simple case study was applied to the path mobility manager to test its functionality. A simulation of single moving node without any functional application is defined. It has no application, so that we can concentrate on tracing the mobility manager. A 3D path of two points is used as the case study. Two different speeds are used to target each point in the path. The following code listing the most important parameters specified for the simulation. Also, Figure 6 depicts this case study.
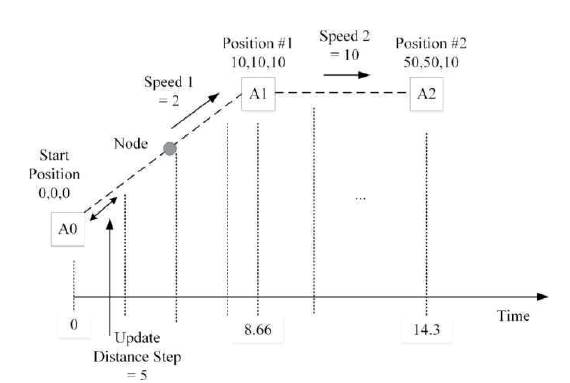
Figure 6. Simplified 2D Description for the Test Case of the Path Mobility Manager
SN.node[0].xCoor = 0
SN.node[0].yCoor = 0
SN.node[0].zCoor = 0
SN. node [0].Mobility Manager Name ="PathMobilityManager”
SN.node[0].MobilityManager.numPoints = 2
SN.node[0].MobilityManager.xPoints = "10,50”
SN.node[0].MobilityManager.yPoints = "10,50”
SN.node[0].MobilityManager.zPoints = "10,10”
SN.node[0].MobilityManager.Speeds = "2,10”
SN.node[0].MobilityManager.updateDistanceStep = 5
SN.node[0].MobilityManager.collectTraceInfo = true
The simulated node will start moving from the initial point (0, 0, 0) to the first point in the path (10, 10, 10) with a speed of (2 unit/sec). This yields a distance of (17.3 units), which will be reached in time (8.66 sec). Next, the node moves to the second target point (50, 50, 10) with a speed of (10 unit/sec). This yields a distance of (56.5 units) and will be reached in time (14.3).
The same results are obtained from the trace information collected by the simulation engine, which proves the correctness of the new mobility manager's operation. The following listing as shown in Table 3 provides the information gathered during the simulation of this simple case study. It is noticed that, because the update step is fixed, the time step changes between the two lines in the path. The time step is (5/2 = 2.5 seconds) for the first three time slices in the first line. It drops to be about (1.1 seconds) at the last time slice, because the manager decided not to consider the update distance provides as it will jump the path beyond the target point. Similarly, the time step is (5/10 = 0.5 seconds) for all time slices of the second line, except the last time slice which is about (0.15 seconds), because the manager decided not to consider the update distance provides as it will jump the path beyond the target point.

Table 3. Trace Information Results
A 3D visualization tool is intended to visualize the simulation of WMSNs, where users can maintain a visual contact with the movement of nodes and their actions during the simulation. In this section, the requirements for a visualization tool are first presented and discussed. Additionally, reasons for developing a separate tool, not an integrated module are discussed. Finally, the required visualization tool is designed, implemented and tested.
Historically, developers of WSN concentrated at the lower levels of their networks, which include; nodal operation, inter node communication routing, and environment interaction. Therefore, simulation frameworks do not usually provide visualization support, as they are initially intended to provide a correct simulation of the actions circulating with WSNs.
OMNet++ supports basic 2D visualization. It is quite different than other simulators, because it is a general event-driven simulation framework that can simulate literally any discrete-nature system. Therefore, the visualization engine within OMNet++ is not sufficient for the requirements of modern WMSNs. Castalia supports 3D field simulation, where the user can define mobility in a 3D world. However, it has not provided by any means of visualization for such simulation abilities.
WMSN simulation user requires a 3D visualization of the simulated nodes, where he can identify the position of his moving nodes (e.g. simulated robots), track camera’s perspectives and identify flaws in the algorithms that affect mobility.
A novel visualization tool was developed to handle user requirements. It is a tool, not a module within Castalia. This means that it is not included within the simulation process. However, it works based on the simulation results. The main benefits of separating the visualization away from the simulation are:
Figure 7 presents the operation of the visualization process. As usual, the user runs the simulation with his input (.ini) configuration data describing his network, nodes and applications. The enhanced OMNet++/Castalia with the novel mobility manager will track changes of the simulated nodes and report them to a visualization report file. At this moment, the simulation phase is done and the regular results are accessible to the user. However, an additional visualization report is available this time.
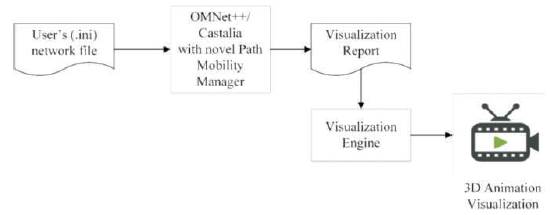
Figure 7. Description of the Operations within the Visualization Process
The actual visualization phase starts when the user uses the developed visualization tool to visualize his simulation. He provides the visualization tool with the visualization report. The visualization engine (the core of the visualization tool) analyses the report and provides the user with a 3D real-time visualization.
The user can easily automate the process. He can simply write a single-line command to cascade both operations so that, when the simulation phase ends, the visualization phase starts immediately. Such design gives freedom to the user and frees the simulation process from heavy 3D visualization operations that can slow the simulation process.
Figure 8 presents the flowchart of the algorithm of the visualization engine (the core of the visualization tool). The visualization engine is responsible for reading the visualization report and ensuring it is visualized correctly and in real-time.
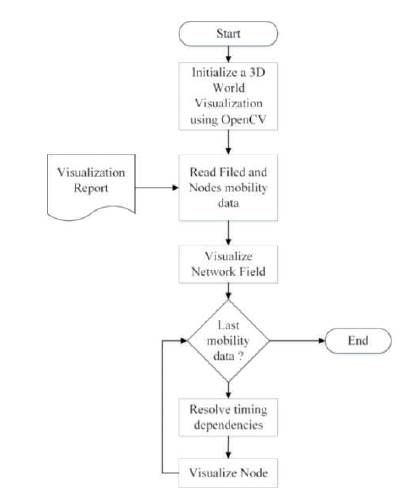
Figure 8. Algorithm of the 3D Visualization Engine
The engine starts by initiating a 3D world with cartesian coordinates with the help of OpenCV's [27-28] 3D engine. Then, it reads the visualization report. The initial data provided in the report is the characteristics of the simulated network field (length, width, and height of the simulated world in Castalia). Then, it mirrors to the visualized 3D world.
The main challenge in the visualization engine is to handle multiple moving nodes. Visualization reports contain mobility path details for different nodes moving in different paths within different times. The engine should maintain a smooth timing sequence and mirror events ordered by time not by the paths taken by the nodes.
Figure 9 presents a screenshot of the developed visualization tool, during the visualization of a simulated two-node network. The network field is visualized as a plane, if it is 2D and as a framed-box if it is 3D. Nodes are visualized with red cubes with their names on the top. The user can freely change the cameras perspective using the mouse.
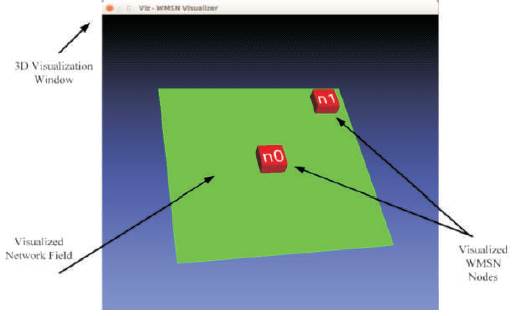
Figure 9. Screenshot of a Frame within the Visualization Result
The Mobility Manager class in Castalia defines a base for any mobility manager module and provides several functions to help with the operations of the module. All mobility manager modules should be derived from this base class. In this paper, the author discussed the need for a simulation environment for realistic Wireless Multimedia Sensor Networks and presented WMSN, a Wireless Simulation Environment for Multimedia Networks. After considering the state-of the-art of network simulators, the author focused on the Castalia/Omnet++framework and extended its basic functionalities to operate with networks of multimedia sensors, such as the cameras. WMSN, which is a framework for research in computer vision algorithms for realistic multi-camera networks with synthetic and real-world datasets, as well as for the study of more complex networking protocols and for bandwidth and energy management.
Also, an enhanced mobility management manager was provided for Castalia. The user requirements for a generic Path mobility management was defined and stated. Then, the proposed mobility manager was presented. A test case was presented and discussed for the path mobility manager which proved its functionality. The presented mobility manger is efficient, easy to use, fast and time saving.
Visualization using low-cost, open-access software platforms can overcome many of these barriers. The visualizations provide full navigation, and incorporate real-time construction schedule information. They are easily used by individuals with only basic computer skills. The visualization tool was developed to enable users to have a visual feedback of their simulation processes. The requirements were stated and discussed and the tool is presented and developed. Currently, with the help of this tool and the mobility manger, the user can easily visualize his work and identify difficulties within his wireless multimedia sensor network designs.
