The Government of India has sanctioned funds for the production of 190 GW and this solution is a way to reduce the pollution levels. This support of the go-green initiative by the United Nations as well is a step forward in creating a better environment for the future generations to live in. The proposed work aimed at designing a wind-solar hybrid system for light load application. The tools like Qblade and solidworks were used to model and analyze the wind turbine system, the material used for the blade and hub was Balsa wood and the tower is a tripod type. The power output of 100 W at an average wind speed of 4.5 m/s has been targeted. The work also aimed at providing electricity to the rural area in India which amount to 25000 in number where, there is no provision for electricity, this solution may provide the electricity needs of such villages.
The use of alternative energy sources is gaining popularity worldwide with a lot of interest in particular being shown in efficiently harnessing wind energy and solar energy [5] . It is relevant to the Make-in-India concept. One of the biggest hurdles in using these alternative energy sources is their lack of consistency in terms of their dependency to deliver a fixed power supply.
In this paper, the focus is laid on using green and renewable forms of energy to provide electricity to certain areas where there electricity is still a dream.
The focus is laid on using theoretical equations and simulation to design a wind-solar hybrid standalone system that can be used in such applications [1] .
The objectives of the study are:
C.N. Narayanswamy et al., (2006), proposed the availability of wind energy and its characteristics at selected locations and data collected from the wind monitoring department [12].
Vikram Singh et al., (2014), focussed their studt primarily on designing the blade for tapping power in the regions of low wind power density. This can be achieved by using wood [13] as the blade material which has good strength to weight ratio.
Shankar Bentur et al., (2011), demonstrated that wind energy is one the most widely used renewable energy resources. Wind turbines need to be reliable and be cost effective. At the same time, small-scale wind turbines must produce the required amount of power to meet the needs [14] especially in the areas with low wind speeds.
Kianoosh Yousef et al., (2009) explained the effects of jet width on blowing and suction flow control evaluated for an airfoil. Results of this study demonstrated that, when the blowing jet width increases [3], the lift-to-drag ratio rises continuously in tangential blowing and decreases quasi- linearly in perpendicular blowing.
Y. Sudhakar et al, (2012) involved in putting a cylindrical rod upstream of the leading edge [5] in vertical translation movement in order to accelerate the transition of the boundary layer by interaction between the wake and the boundary layer.
U. Anand et al., (2003) Focused on increasing their aerodynamic efficiency [6] and operational range through active flow control with the help of blowing devices with constant or pulsed jets in their study.
Hansena et al. (2006) presented the state of the art in wind turbine aerodynamics and aero elasticity, thus the aerodynamic part starts with the simple aerodynamic Blade Element Momentum Method [8] and ends with giving a review of the work done applying CFD on wind.
Jang-Oh Mo and Young-Ho Lee (2012) have developed CFD investigation on the aerodynamic characteristics of a small-sized wind turbine of neural phase. Root design approaches considered the appropriate selection [9] of the angle of attack and the thickness.
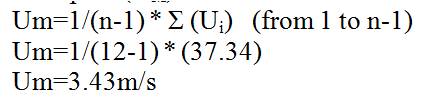
1) Average wind speed (UM )
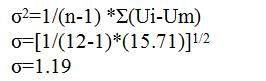
2) Standard deviation(Σ)
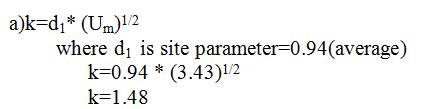
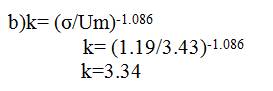
3) Shape parameter
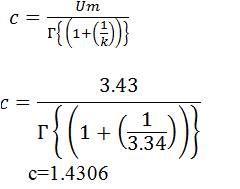
4) Scale parameter
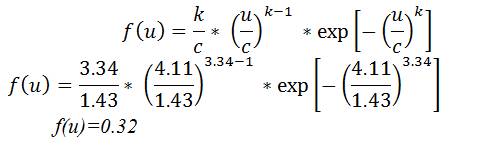
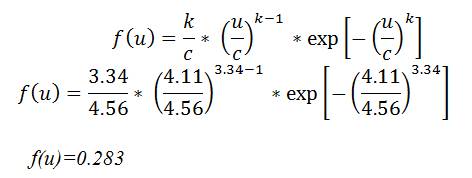
5) Weibull density function
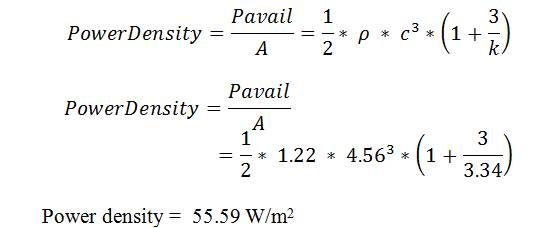
6) Power density factor in terms of Weibull
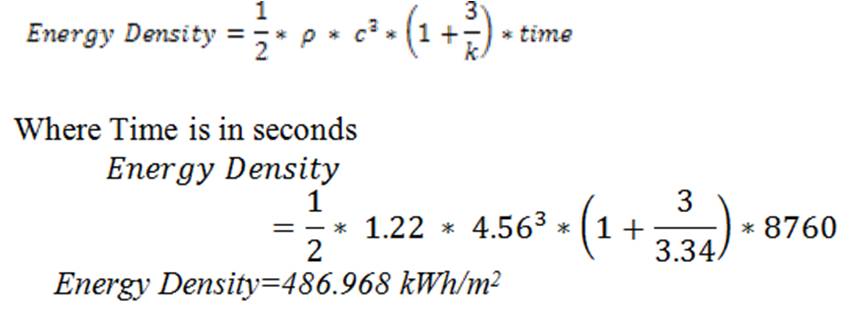
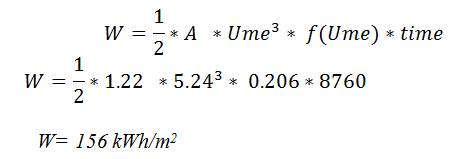
7) Energy density
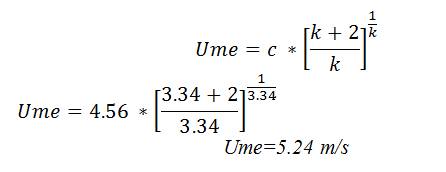
8) Wind speed corresponding to maximum energy (Ume )
9) Maximum energy available from turbine
10) Weibull density function for 15m hub height from ground
The above equations suggest that for an average wind speed of 3.43 m/s for a pole height of 10m the maximum available energy is 156 kWh/m2 which is sufficient for domestic lighting application. The wind speed which corresponds to maximum energy is 5.24 m/s. Figure 1 shows the Wind Data for Hubli city
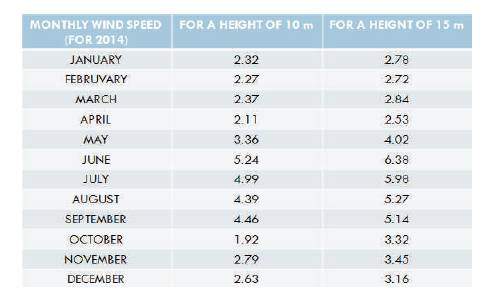
Figure 1. Wind Data for Hubli city
This excel sheet supports the therotical calculations of the energy available and the graphs show the available energy and maximum energy that can be obtained from the turbine for wind speed of 4 m/s. Figure 2 shows the Energy Available for Wind Speed.
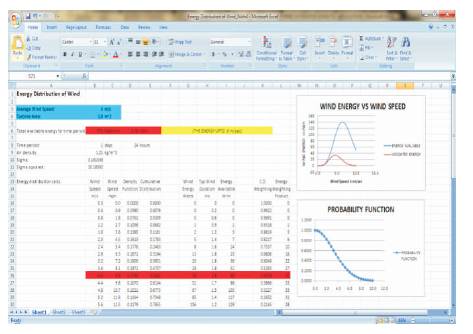
Figure 2. Excel Sheet for Calculation of Wind Energy Available for Wind Speed of 4 m/s
Electrical Rated Power (PR)=100 W
Rated wind speed=9 m/s
Cut in speed=3 m/s
Furling speed=12 m/s
Power Output From Turbine
In this excel sheet (Figure 3), the data obtained from the above equations are used to obtain suitable dimensions of the blade for a particular requirement of wind speed of 4 m/s and expected power output of 100 W. Figure 3 shows the Blade Parameters, and CAD Model. Figure 4 shows the Front View of CAD Model and Figure 5 shows the Side View of CAD Model.
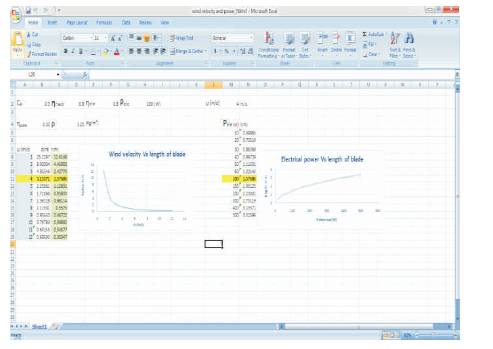
Figure 3 Excel Sheet for Estimating Wind Power Based on Blade Parameters
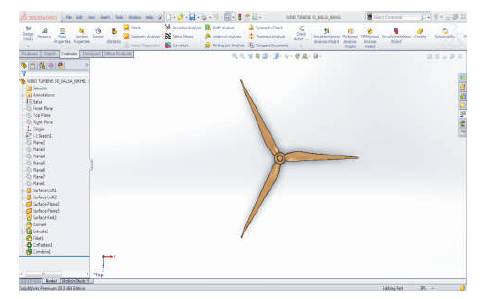
Figure 4. Front View of CAD Model
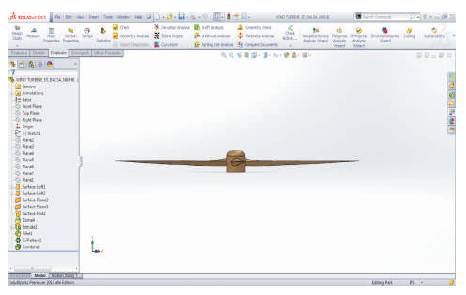
Figure 5. Side View of CAD Model
The solidworks analysis suggests that, the static displacement and the von-mises equivalent stress is not too high and that the Balsa wood material [4] selected for the blade can withstand the loads and pressure it will be subjected to and can perform effectively. Table 1 shows the Properties of Basla wood and Table 2 shows the 6. Qblade Software Simulation From Figure 11 and Figure 12, the test foil and the NACA properties of Basla Wood and T boundary conditions. Figure 6 shows the Dimensions of Blade. Figure 7 explains the boundary conditions and meshing. Figure 8 depicts the Von-Mises Equivalent Stress. Figure 9 shows the Static Displacement. Figure 10 the Graph shows the Foils Generated for Chord.
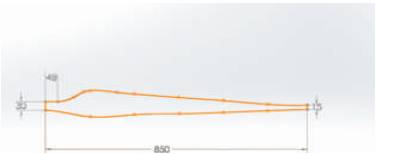
Figure 6. Dimensions of Blade
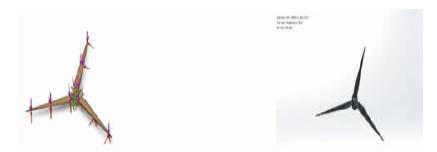
Figure 7. Applying Boundary Conditions and Meshing
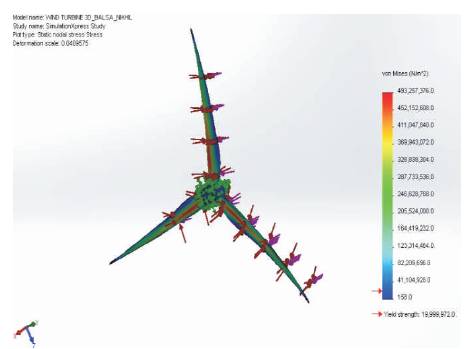
Figure 8. Von-Mises Equivalent Stress
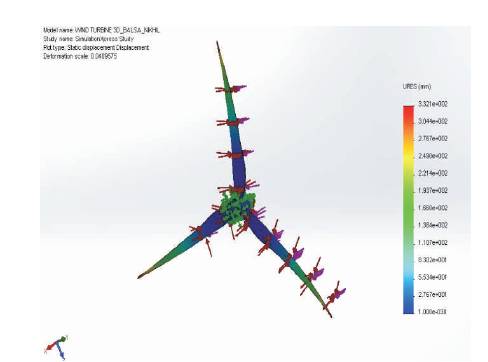
Figure 9. Static Displacement
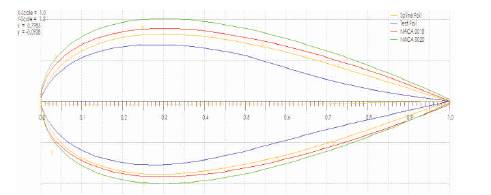
Figure 10. Foils Generated for Chord Length of 100mm, Maximum Thickness of 18mm at 50mm from the Leading Edge
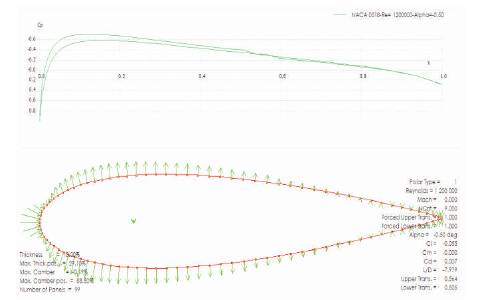
Figure 11. Pressure Distribution and the Graph of Co- efficient of Performance Against Position for NACA0018
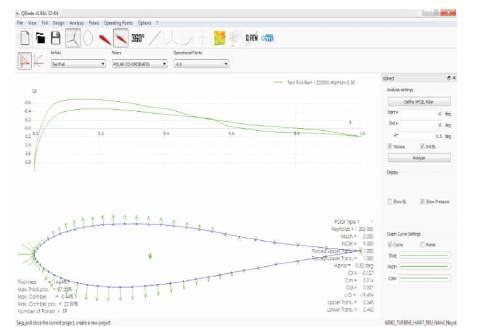
Figure 12. Pressure Distribution and the Graph of Co-efficient of Performance Against Position for Test Foil
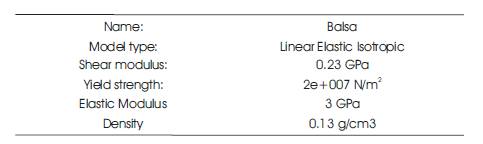
Table 1. Properties of Basla Wood
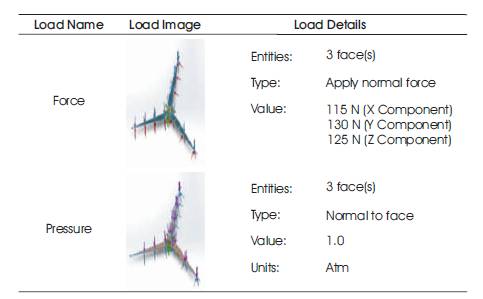
Table 2. Boundary Conditions
From Figure 11 and Figure 12, the test foil and the NACA 0018 profiles have similar nature of graph for co-efficient of performance, but the pressure distribution is better in case of NACA 0018 profile. Keeping the cost of manufacturing and application [10] of the wind turbine in mind, the test foil can be preferred.
Figure 11 shows a comparison between the profile used to design the blade and that of a standard NACA 0018 and NACA 0020 aerofoil. Also, it shows the pressure distribution along the test foil along with a plot of Cp (Co-efficient of performance) against the position. The angle of attack is - 0.50 and also shows the maximum camber.
Figure 13 shows the blade system that was generated and imported to the software Qblade and the rotor diameter selected is 2m.
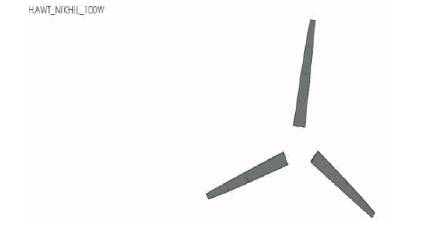
Figure 13. System of Blades Generated
Figure 14 shows 4 graphs that were obtained for different rotor speeds. The green colored line represents 100 rpm, red colored line represents 200 rpm and the dark blue colored line represents the 300 rpm rotor speed. The graphs plotted against the pitch angle suggest that the power is maximum if the pitch angle is on the lower side and power reduces with increase in pitch angle. A similar trend is seen in other graphs as well for thrust force (S), bending moment (M_b) and Torque (T). Rotor speed of 200 rpm and pitch angle between 20 to 40 seems appropriate for the application.
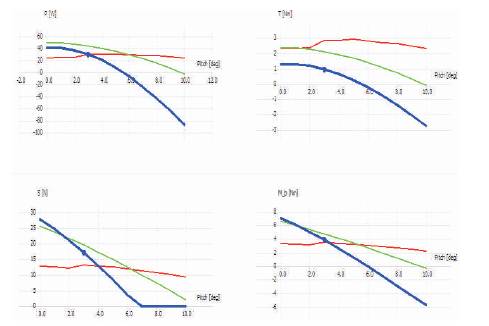
Figure 14. Impact of Pitch Angle for Different Rotor Speeds
Figure 15 shows 4 graphs that were obtained for different rotor speeds. The convention for rotor speeds remains the same as the previous figure. The graphs are plotted against T.S.R (tip speed ratio) suggest that, the power is high at low T.S.R and reduces with increase in T.S.R and becomes constant. A similar trend is seen in other graphs as well for thrust force (S), bending moment (M_b) and Torque (T). Rotor speed of 300 rpm and T.S.R on the lower side is appropriate for the application.
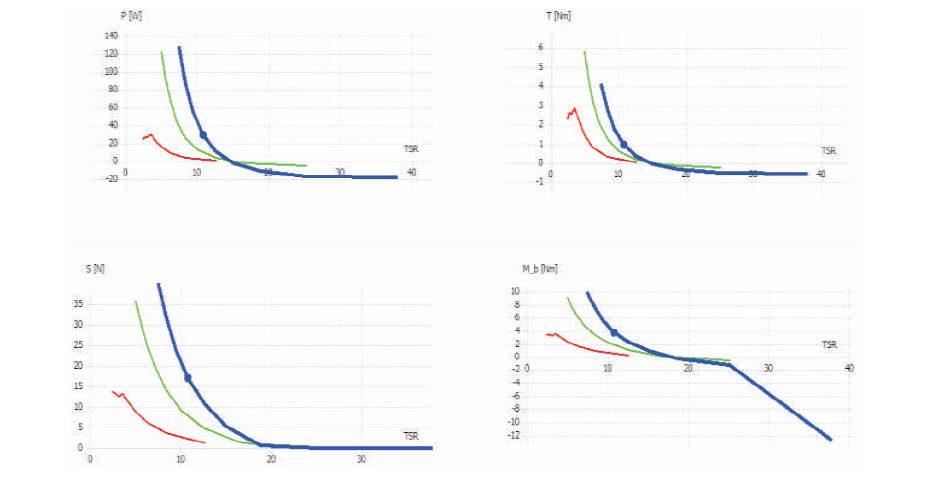
Figure 15. Tip Speed Ratio Impact for Different Rotor Speeds
Figure 16 shows 4 graphs that were obtained for different rotor speeds. The convention for rotor speeds remains the same as previous figure. The graphs are plotted against different wind speeds suggest that, the power increases with increase in the wind speeds. The thrust force for the rotor speed of 200 rpm shows a linear nature and torque shows a dip after the wind speed of 3.8 m/s. Rotor speed of 300 rpm and the wind speed calculated for the given area 4 m/s suggests that, a power output of 60 W for rotor speed of 300 rpm.
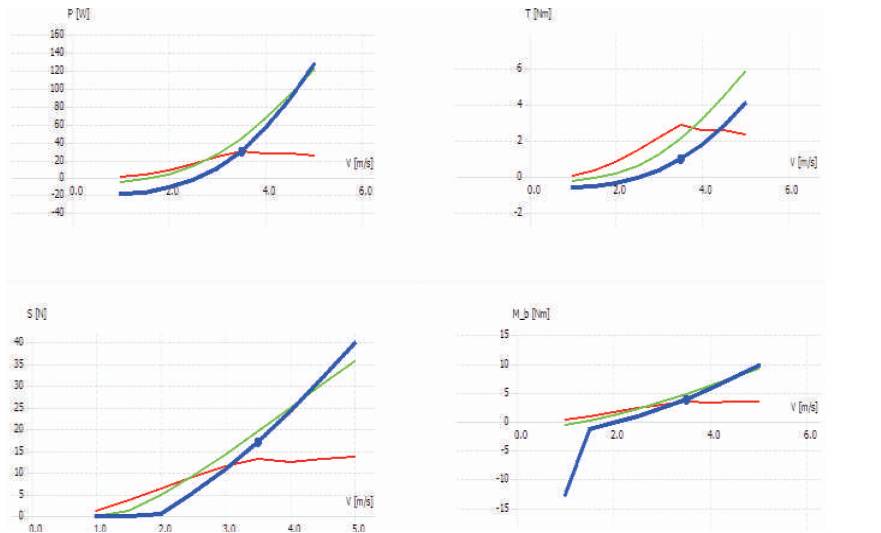
Figure 16. Wind Speed Impact for Different Rotor Speeds
Figure 17 is used to study the effect of different wind speeds on the angle of attack and its variation with the position. The graph suggests that, the angle of attack for the designed wind speed of 4 m/s dips drastically as the position increases and is marked in green color.

Figure 17. Angle of Attack V.s Position for Different Wind Speeds
Figures 18 and 19 suggest the impact of shape and scale factors on the annual energy production and the inference that can be made is that the annual energy production is high for low scale factor and shape factor and the acceptable values [12] for the required power below 5.
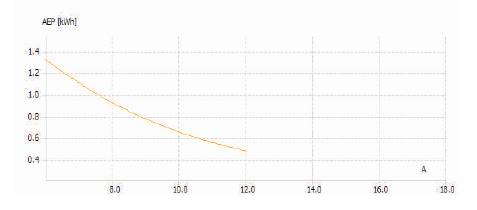
Figure 18. Annual Energy Production Vs Scale Factor
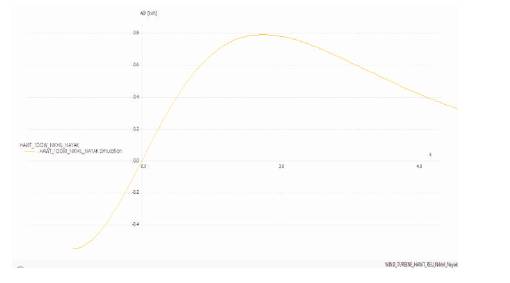
Figure 19. Annual Energy Production Vs Shape Factor
Figures 20 and 21 show the model that was prepared using the Qblade software for the purpose of simulation. After subjecting to a simulation of time step of 360, it is observed that, the power obtained is 43.5 W for a wind speed of 4 m/s and a height of 10 m from the ground for the given area in Hubli.
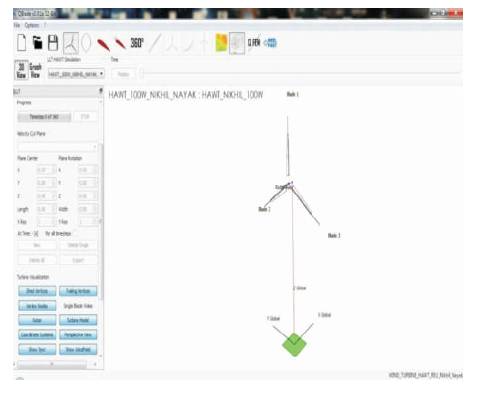
Figure 20. Hawt Simulation Setup
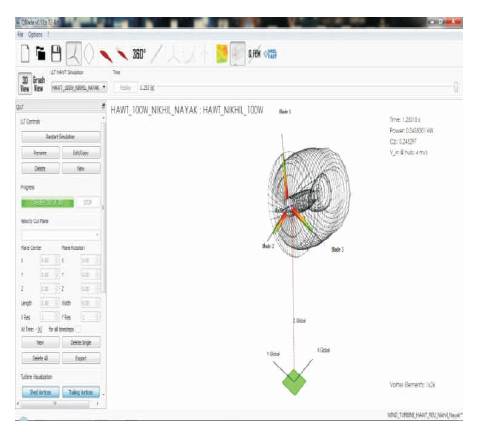
Figure 21. Simulation Results
From the Figure 22, it is clear that the horizontal axis wind turbine is a “lift based” turbine and the test foil has higher lift co-efficient when compared to the standard NACA profile.
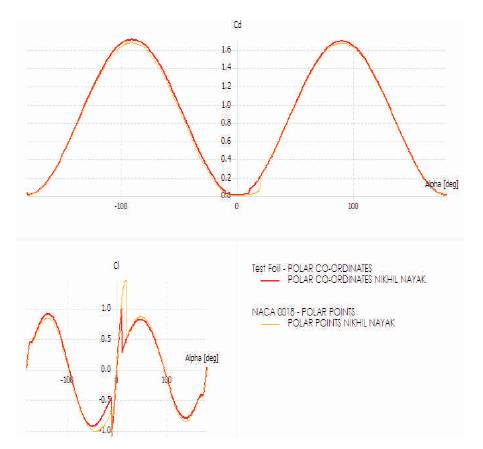
Figure 22. 360o Polar comparison between test foil and NACA 0018
Figures 23, 24 and 25 show different mode shapes for the blades along with the corresponding Eigen frequency along with the mass of the blade. The highest Eigen frequency was observed for the blades under torsional mode 1181.13 Hz and lowest under flapwise mode 24.70 Hz.
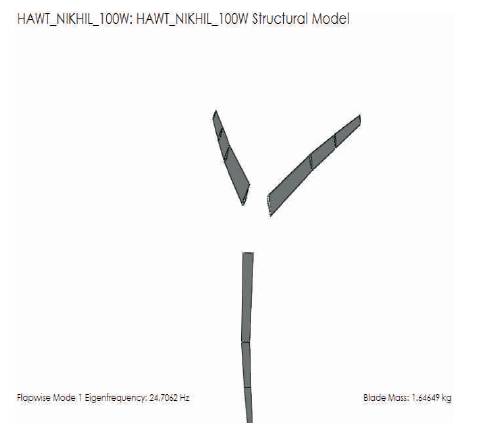
Figure 23. Flapwise Mode Shape
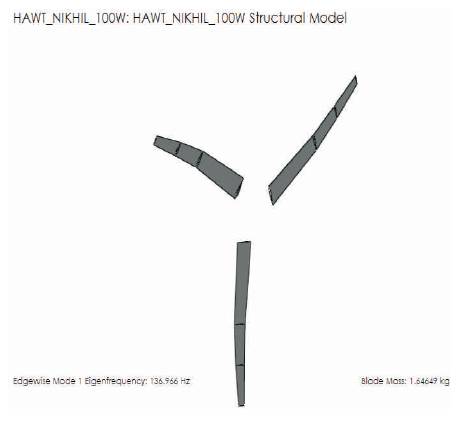
Figure 24. Edgewise Mode Shape
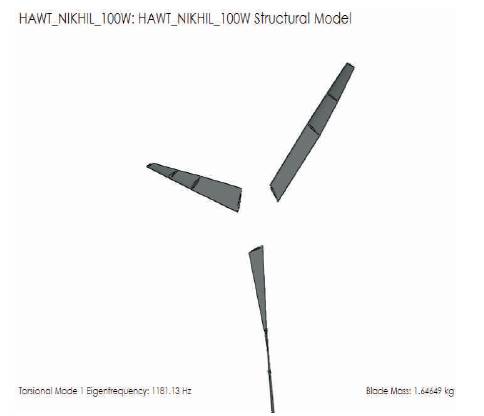
Figure 25. Torsional Mode Shape
Triangular lattice towers consist of three legs positioned at the corners of an equilateral triangle. Figure 26 shows the Proposed Tower.
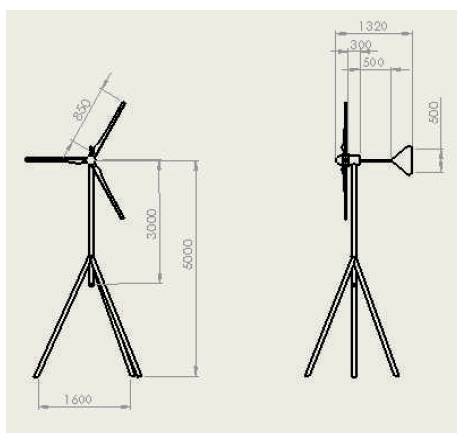
Figure 26. Dimensions of Designed Wind Turbine in mm
Total load = 100 W
Period of operation=12 Hours
Then, Total Watt-Hour = 100×12= 1200 W.hr
The period of the solar panel exposed to the sun = 8 hrs.
(Between 9am and 3pm)
Therefore,
Solar panel wattage = 1200/8=1500 W
Hence solar panel of 150W will be needed for this design [15].
If solar panel of 15 W is to be use the number of panels to arrange in parallel to achieve 150 Watt will be:
Number of panels required=150 W/15 W=10
For this design of 100 W solar power supply,
P=IV
where,
I=Expected charging current,
V=Voltage of the battery and = 12 V,
P =Power supply rating= 100 W,
I =83 A
Charging controllers is not readily available in the market hence “Buck-Boost controller” will be used [11].
Since the total load is 100 W, it is suggested to size the required inverter to be 150 W as designed for solar panel ratings.
Hence 150 W “PURE SINE WAVE” will be used.
For domestic applications, this wind turbine and solar panels can be used to engineer the required capacity requirements and accommodate the needs.
The analysis from the tools like Qblade and solidworks support the calculations made and show that the material used for the blade Balsa wood and the tower, a tripod can withstand the loads acting on them and can be expected to produce a power output of 100 W for an average wind speed of 4 m/s. This may not be a significant amount of power, but it can be employed to ensure that remote areas can benefit from the solution proposed.