This paper presents an approach for measuring and classifying power quality disturbances using discrete wavelet transform and artificial neural network. The various power quality events considered are voltage sag, swell, harmonics, sag with harmonics, swell with harmonics and interruption. Due to the power quality disturbances, the signal is distorted. The energy of the distorted signal is first evaluated with the help of the Multi-Resolution Analysis (MRA) technique of Discrete Wavelet Transform (DWT) and the Parseval's theorem. Second, the energy deviation of the distorted signal with respect to pure sinusoidal signal at different levels is calculated. From these energy features and transient duration, the artificial neural network classifies and identifies the disturbances.
The term 'quality of electrical power' may be described as a set of values of parameters, such as continuity of service, variation in voltage magnitude, harmonic content in the waveforms for AC power [2].
The main power quality deviations are voltage sags and swells, harmonic distortions, notching, interruption, etc. In the available commercial power quality detecting instruments, power quality events are detected by pointby- point comparison of the faulted signal with a pure sinusoidal signal and identifying the deviations. When the deviation is above or below a certain threshold, Power quality events are said to occur. The drawbacks of this method is that it is insensitive to harmonics and sensitive to the threshold value. Several other techniques are available in literature for power quality detection. In the last decade, the wavelet transform has been widely used to study and analyze power quality events during disturbances [1-8].
Discrete Wavelet Transform (DWT) can detect any sharp changes or discontinuities in a signal and can extract the features of a signal. So it is very efficient in signal analysis. The use of intelligent methods such as Artificial Neural Network (ANN), Fuzzy Logic (FL) along with DWT will be able to overcome the limitations mentioned above. Over the last ten years, a number of different approaches to the PQ disturbance analysis using intelligent methods were suggested [9-12].
In this paper, different power quality disturbances such as sag, swell, harmonic, sag with harmonic, swell with harmonic, are considered for classification. The distorted signals are analyzed by db4 mother wavelet up to 10 levels of decomposition. The energy deviations of all the detail levels are given as input to the neural network; the outputs are types of power quality disturbances, percentage sag or swell and Total Harmonic Distortion (THD).
The Wavelet transform is a mathematical tool which is capable of providing the time and frequency information simultaneously.
There are two types of wavelet transforms:
Since in this analysis of Power Quality problems, the authors have used Discrete Wavelet transform. So here they have concentrated mainly on it.
Multi-resolution analysis in DWT is a technique in which a signal is decomposed into scales with different time and frequency resolution by using two filters, one High Pass Filter (HP) or Wavelet Filter and one Low Pass Filter (LP) or Scaling Filter. The results are divided by a factor two and again two filters are applied to the output of the low pass filter from the previous stage. The output of the HP filter is called as detail wavelet coefficient. The LP filter on the other hand, delivers a smoother version of the input signal. Its output is called as approximate wavelet coefficient. This process of converting a time domain signal into wavelet domain is termed as sub-band codification. This is explained in Figure 1.
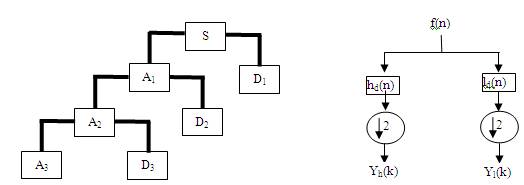
Figure 1. Sub-Band Codification Scheme of a Signal
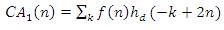
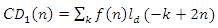
At the end of the first level of signal decomposition (as illustrated in Figure 1), the resulting vectors yh (k) and yl (k) will be, respectively, the level 1 wavelet coefficients of approximation and of detail. In fact, for the first level , these wavelet coefficients are called CA1(n) and CD1(n), respectively, as stated below:
Next, in the same way, the calculation of the approximated (CA2 (n)) and the detailed (CD2 (n)) version associated to the level 2 is based on the level 1 wavelet coefficient of approximation (CA1(n)). The process goes on, for the “n-1” wavelet coefficient to calculate the “n” approximated and detailed wavelet coefficients. Once all the wavelet coefficients are known, the discrete wavelet transform in the time domain can be determined. This is achieved by “rebuilding” the corresponding wavelet coefficients, along the different resolution levels [13].
Here, a wavelet-based neural network classifier for classifying and measuring the power quality disturbances is implemented and tested under various transient events like sag, swell, harmonics etc. First, the Multi-Resolution Analysis (MRA) technique of DWT and the Parseval's theorem is employed to extract the energy distribution features of the distorted signal at different levels. Second, a Probabilistic Neural Network (PNN) classifies these extracted features to identify the disturbance type according to the transient duration and the energy features. Various transient events are tested, the results show that, the classifier can detect and classify and quantify different power disturbance types efficiently.
Here the authors have taken the following variables as inputs to the neural network:
The outputs are as follows:
The Basic steps involved are as follows,
Step 1: Generation of pure sinusoidal signal and generation of distorted signal like sag, swell harmonics.
Step 2: The signal under study is decomposed by DWT.
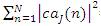
Step 3: The norm of energy of each wavelet coefficient level of distorted signal is calculated in.
This can be mathematically expressed as:

where,
f(n) = Time domain signal in study.
N = Total number of samples of the signal.
 = Total energy of the f(n) signal.
 =Total energy in the level “j” of the approximated version of the signal.
 = Total energy in the level “j' of the detailed Version of the signal.
Step 4: In this stage, the steps 1, 2 and 3 are repeated for the Corresponding “Pure Sinusoidal Version” of the signal in study.
Step 5: The deviation of total distorted signal energy of the signal in study (found in step 4) from the corresponding one of the pure signal version (evaluated in step 5) is given by:
where,
i=j: wavelet transform level.
eng_dist(j)= energy distribution in jth wavelet transform level of the signal in study.
eng_ref(j)= energy distribution in jth wavelet transform level of the correspondent fundamental component of the signal in study.
Step 6: The magnitude of pure sinusoidal waveform, duration of occurrence of disturbance, energy deviation of 10 level of wavelet transform are fed as input to the neural network. Type of disturbance, % of sag and swell, THD are the outputs.
The proposed method is applied to various signals containing power quality disturbances. The authors have considered pure sinusoidal waveform with frequency 50 Hertz. Here they have divided 1 cycle into 256 samples and they considered 16 such cycles. Total number of samples=256*16=4096 samples. 256 samples are present in 1 time period (20 ms). So, 1 sample is present in 20/256 ms. Expressions for different types of disturbances are shown in Table 1 [3].
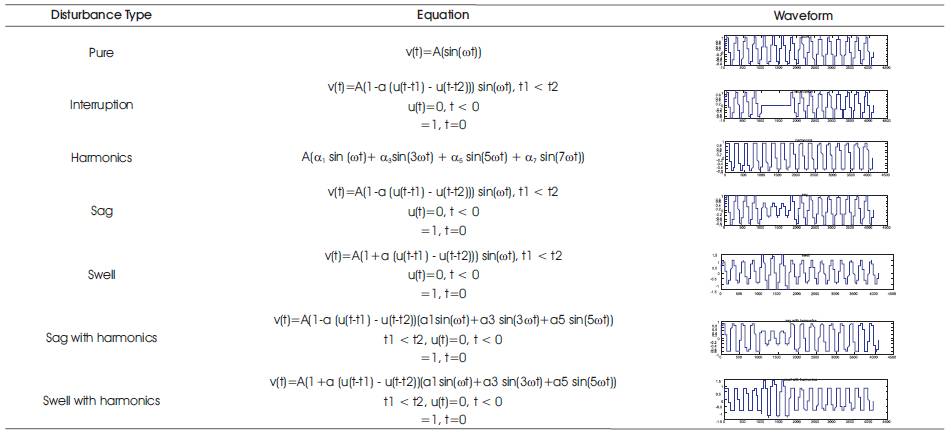
Table 1. Expression for Different Waveforms
The energy deviation is plotted for seven different classes of disturbances. Figure 2 shows the energy deviation for seven different classes of disturbances. It is seen that, the energy deviation curve is different for each type of disturbance. Energy deviation for different percentage of sag and swell and different time duration are shown in Figure 3 to Figure 6. It is clear from these Figures that, the deviation curves vary according to these two parameters. So these two parameters are taken as input to neural network.
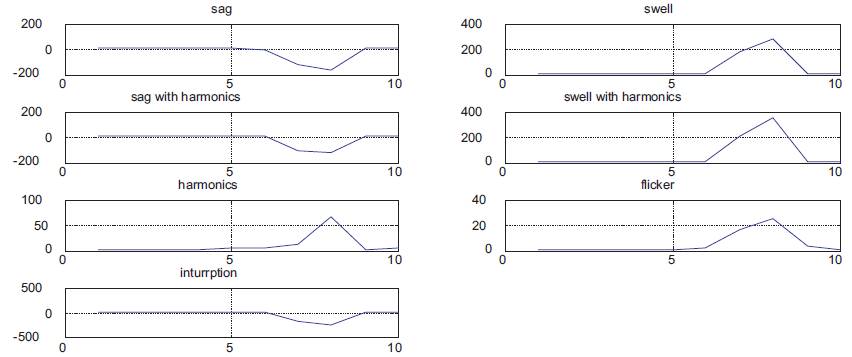
Figure 2. Energy Deviation for Different Types of Disturbance
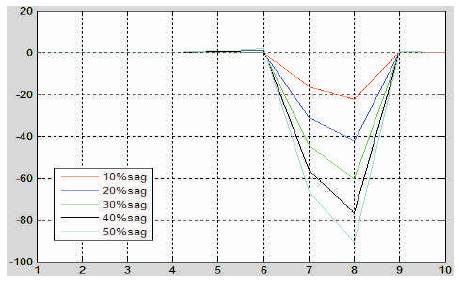
Figure 3. Energy Deviation for Different % of Sag for Duration 30 msec
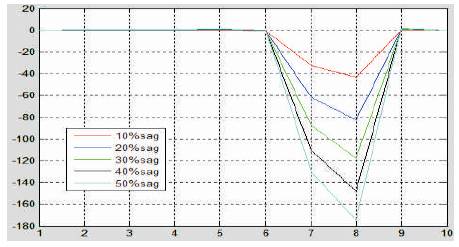
Figure 4. Energy Deviation for Different % of Sag for Duration 60 msec
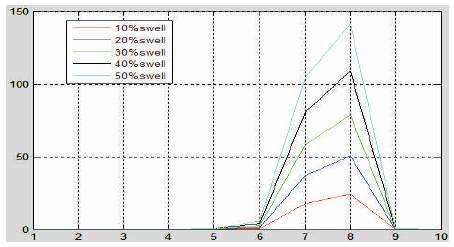
Figure 5. Energy Deviation for Different % of Swell for Duration 30 msec
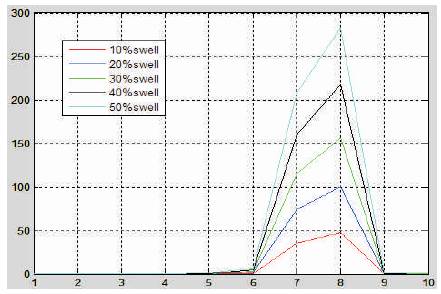
Figure 6. Energy Deviation for Different % of Swell for Duration 60 msec
Data for classification problems are set up for a neural network by organizing the data into matrices, the input matrix X. Neural networks however cannot be trained with non-numeric data.
Hence, the textual data must be translated into a numeric form. There are several ways to translate textual or symbolic data into numeric data. Here the authors used code 1 for sag and code 2 for swell code 3 for harmonic with sag and so on. For coding of percentage of sag/swell and THD, they are grouped in to different classes according to their values. Then this dataset is loaded into the neural network.
Here the authors have used 250 signals. Out of these, 201 are training signals and 49 are test signals. Plots for the measured and actual values of percentage sag/swell and THD are shown in Figure 7 and Figure 8. Performance plot of neural network are shown in Figure 9. Percentage of Correct measurement and classification are shown in Table 2.
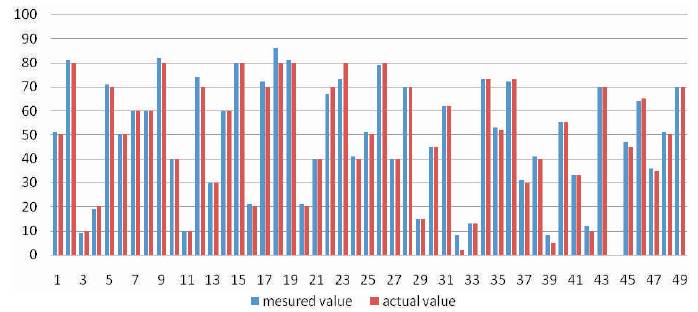
Figure 7. Plot of Measured Value and Actual Value of % Sag/Swell
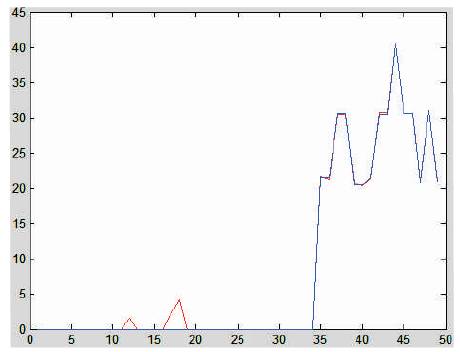
Figure 8. Plot of Measured Value and Actual Value of Data for THD
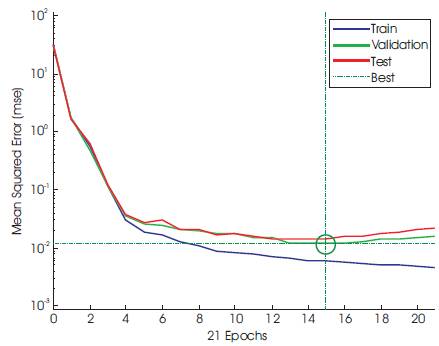
Figure 9. Performance Plot of Training and Test Data
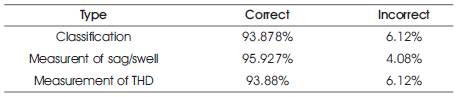
Table 2. Percentage of Correct Classification and Measurement
Here an attempt has been made for classification and quantization of power quality disturbances. The pattern recognition methodology based on wavelet transform is used. The energy values of different power quality disturbances are computed and compared with that of the pure signal. The disturbance classification is performed by neural network. This model is capable of identifying 5 classes of disturbances. In this paper, the authors have used 249 signals. More the number of signals used, better is the result obtained.