This paper presents an innovative digital instrument the Tri–Squared Calculator © that uses the novel Trichotomous Visual Analytics [TVA] as a supportive research model for traditional confirmatory trichotomous statistical analyses. This research adds to the publication entitled, “Trichotomous Exploratory Data Analysis [Tri–EDA]: A Post Hoc Visual Statistical Cumulative Data Analysis Instrument Designed to Present the Outcomes of Trichotomous Investigative Models” published in the imanager's Journal on Instrumentation and Control Engineering. This narrative provides an epistemological rational for the use of “Trichotomous Exploratory Data Analysis” and other trichotomous statistical analytical models for the in–depth analysis of the transformative process of qualitative data into quantitative outcomes through the Tri–Squared Test. The Tri–Squared Test was first introduced in the i-manager’s Journal on Mathematics, and further detailed in the Journal on Educational Technology, Journal on School Educational Technology, and in Journal on Educational Psychology. TVA is used in Tri–Exploratory Data Analysis as a series of graphical and visual statistical models that are a part of the Tri–Squared Calculator ©. The Tri–Squared Calculator © digital instrument was created, designed, and developed by the author to quickly calculate and report Tri–Squared Test outcomes. It also allows the researcher to rapidly check the validity and reliability of Tri–Squared Test results. This is a novel approach to advanced statistical Tri–Squared modeling and reporting. It adds a potent new tool to the mixed methods approach of the trichotomous research design (that intrinsically involves the holistic trichotomous combination and comparison of qualitative and quantitative data outcomes).
In the field of Visual Statistical Data Analysis, the “Tri–Squared Test” statistic (Osler, 2012a) and its “Triple–I” instrumentation procedures have been shown to be ideal assets in determining the verifiability, validity, and viability of trichotomous investigative inquiry through innovative statistical measurement. The addition of a digital tool that aids in rapidly calculating and reporting Tri–Squared Test outcomes is greatly needed. The Tri–Squared Test Calculator © meets this need. For example, it can be used to quickly conduct a Tri–Squared Test for the post hoc “TRINOVA” statistic (Osler, 2014a). It has also proven to be a very valuable in providing the outcomes for post hoc “Triostatistics” (Osler, 2014b). It is the use of the Tri–Squared Calculator © in these operations that has greatly added value and verifiability to the arena of Tri–Squared statistical metrics.
The purpose of this paper is to present an innovative digital instrument that is called the Tri–Squared Calculator © that is used to rapidly calculate Tri–Squared Test Data and present it visually as “Trichotomous Visual Analytics” [TVA]. TVA supports a variety of research models, from traditional Trichotomous Confirmatory Data Analysis (Tri–CFA) and the innovative field of Trichotomous Exploratory Data Analysis (Tri–EDA). Tri–Squared Test and TVA procedures are described in the narrative and are carefully introduced so that the value of each can be seen and TVA as an investigative methodology can be completely detailed and meticulously presented.
As the information being visualized and the process of understanding it both become increasingly complex, it is necessary to develop new visualization approaches that facilitate the flow of human reasoning (Green, Ribarsky and Fisher, 2008) . This is especially true of statistical models that can be deemed as rather complex by audiences that wish to ascertain knowledge through meticulous research inquiry. In this paper, trichotomous research designs and their statistical tests as outcomes can be readily viewed through Trichotomous Visual Analytics (TVA). TVA is a form of Trichotomous Exploratory Data Analysis (Tri–EDA) (Osler, 2015). The Tri–Squared Calculator © can be used to determine, display, and present TVA outcomes that follow an inputted Tri–Squared Test (the initial qualitative data calculated and encoded into the Tri–Squared Calculator interface).
The rapid determination of the “Tri2 Calculated Value” for the statistical significance test of hypotheses for the Tri–Squared Test is precisely the reason why the Tri–Squared Calculator was created. Hypothesis testing is the core of traditional “Confirmatory Data Analysis” (or in this case “Trichotomous Confirmatory Data Analysis”, denoted by the acronym, “Tri-CDA”). TVA is also a form of “Multi- modal Visualization” of Tri-Squared Test outcomes. One extension of the knowledge building process that holds great potential for “Multi-modal Visualization” is in the creation of hypotheses. Hypothesis generation can be fraught with human cognitive bias, as humans are wont to seek out evidence that proves what they already believe or want to believe. Getting past theses biases can be timeexpensive and destructive to the process (Green, Ribarsky and Fisher, 2008) . As Heuer described the process, hypothesis analysis starts with a list of hypotheses and a list of evidence that proves and disproves each one (Heuer, 1999). As the human (as the primary research investigator creates of list of hypotheses, the computer can aid in finding relevant evidence (thus, establishing a need for the Tri–Squared Calculator to conduct Tri–CDA trichotomous hypothesis testing). From there, the computer, with its superior working memory, creates a weighted matrix which the human edits with superior reasoning (Figure 1). Using the edited matrix, the human draws conclusions about which hypotheses are correct, and if desired, sets up a data watch in the visualization which will notify the user of data changes (Figure 3). Hypotheses generation is initiated by the human, but the computer plays a significant role in shortening the process, as contributing to more solid conclusion through use of its strengths (Green, Ribarsky and Fisher, 2008).
Pike et al. (2007) demonstrate the capacity of visual analytics to aid in hypothesis generation and analysis. For example, queried information can become “Reasoning Artifacts” to be used as the basis of hypotheses, or as evidence for hypotheses represented in “Thought Chains" (Pike, May, Baddeley, Riensche, Bruce, and Younkin, 2007) . The human (as the primary research investigator) is then free to manipulate these artifacts directly in a sandbox-like information space, which encourages reasoning flow insularity (Green, Ribarsky & Fisher, 2008) .When the information being explored is semantically rich, and could be visualized through a variety of categorization levels, it is often left to the discretion of the visualization developer as to which level merits the primary view (Figures 6 through 11). It is important to categorize information to aid the human in directing attention, but we would argue that a visualization that utilizes multiple organizational views of the same information can be a powerful aid. As the human interacts with information in any view, the relational changes are visualized in all views (Green, Ribarsky and Fisher, 2008) (Figures 6 through 11).
One goal of intuitive visualization should be the facilitation of the flow of human reasoning. Once the human has focused cognitive resources in an area of interest, the visualization should not hamper the rhythm of reasoning until the human chooses to refocus resources elsewhere (Green, Ribarsky and Fisher, 2008). This insulation can be achieved partially through direct interaction within context and intuitive computer-aided information discovery. But insulation would also encompass any interface process or rendering feature that has the potential to interfere rather than inform the reasoning flow (Green, Ribarsky and Fisher, 2008). Concomitant with the concept of reasoning flow is the idea of being “in the zone” (referring here to the encoding of visual analytics data). This metaphor has been used in a myriad of ways, but we will use it to discuss the ebb and flow of reasoning combined with what Vygotsky called the “Zone of Proximal Development” (ZPD) (Vygotsky, 1980). A human in the zone is focused on a problem to solve, a question to answer, or an area of interest to explore. The ZPD, simplistically defined, is a zone in which what the human wants to accomplish is just out of reach but can be attained with the right support—in this case, the Tri–Squared Calculator interface. This further describes how TVA can be used by a researcher to explain and present valid trichotomous research data through “Tri–Squared Calculator Visual Analytics”.
A description of the Tri–Squared Test follows with sample data to illustrate the statistical mechanics of the trichotomous metric followed by its subsequent TVA outcomes to illustrate exactly how TVA is presented via the Tri–Square Calculator © in the following: Table 1 which displays the offers the sample outcomes of the Tri–Squared Test; Figure 1 which shows the TVA Tri–Squared Calculator © initial data interface upload; Figure 2 which illustrates the TVA Tri–Squared Calculator © internal data traditional calculator; Figure 3 which presents the TVA Tri–Squared Calculator © statistical significance critical value reporter; Figure 4 which delivers the TVA tri–coordinate graphic model reporting title; Figure 5 which expresses the TVA tri–coordinate graphic model mathematical model [in the reporting title]; Figure 6 which indicates the TVA tri–coordinate graphic model one, the initial aggregated tri–squared cuboid qualitative data; Figure 7 which reveals the TVA tri–coordinate graphic model two the initial aggregated tri–squared triangular qualitative data; Figure 7 which includes the TVA tri–coordinate graphic model two, the initial aggregated tri–squared triangular qualitative data; Figure 8 which discloses the Tri–Squared transformation of qualitative data into quantitative data initial aggregated tri–squared parallel qualitative data; Figure 9 which makes evident the TVA tri–coordinate graphic model four—the tri–squared transformation of qualitative data into quantitative data; Figure 10 which exhibits the TVA tri–coordinate graphic model five, the tri–squared transformation of qualitative data into quantitative data [analysis by trichotomous outcome variable magnitude]; and lastly Figure 11 which reveals the TVA tri–coordinate graphic model six, the tri–squared transformation of qualitative data into quantitative data: percentage of qualitative output deviation.
Table 1 illustrates how a sample Tri–Squared Test is conducted to illustrate how the Tri–Squared Calculator © can be used as a measure of TVA.
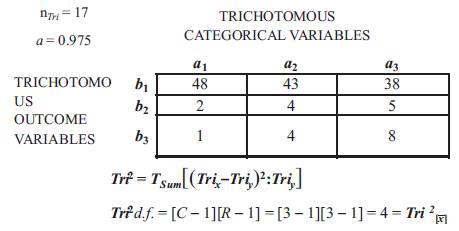
Table 1. Sample Outcomes of the Tri–Squared Test
Data analyzed using the standard Trichotomous–Squared Three by Three table designed to analyze the research questions from an Inventive Investigative Instrument with the following Trichotomous Categorical Variables: a1 = Successful via: Impact, and Positive Testing [the summation of the outcomes of the assessment instrument item 1]; a2 = Made a Difference via: Participation, andGraduation Rate [the summation of the outcomes of the assessment instrument item 2]; and a3 = Aided in Retention via: Drop Out Rate, and Attendance [the summation of the outcomes of the assessment instrument item 3] (Osler, 2014a). The 3 × 3 Table has the following Trichotomous Outcome Variables: b1 = Yes; b2 = No; and b3 = Unknown (Osler and Waden, 2012b). The Inputted Qualitative Outcomes are reported as follows:
The Tri–Square Test mathematical formula for the transformation of trichotomous qualitative outcomes into Trichotomous Quantitative Outcomes to determine the validity of the initial research hypothesis is illustrated above. The outcome (results) of the initial Tri–Squared Test yielded the following: Table Two illustrates the qualitative mathematical application of the Trichotomous–Squared (“Trichotomy–Squared”, “Tri–Squared” or “Tri–Square”) statistical analysis procedure. The results are: Tri2 Critical Value Table = 8.131 (with d.f. = 4 at α = 0.975). For d.f. = 4, the Critical Value for p > 0.975 is 0.484. The calculated Tri–Square value is 8.131, thus, the null hypothesis (H0) is rejected by virtue of the hypothesis test which yields the following: Tri–Squared Critical Value of 0.484 < 8.131, the Calculated Tri–Squared Value (Osler and Waden, 2012b).
To conduct a Trichotomous Visual Analytics a digital instrument entitled, “The Tri–Squared Calculator ©” was created and designed by the author. The purpose of this digital tool is twofold. First it provides rapid assessment of trichotomous data using the “Standard 3 × 3 Tri–Squared Table” and secondly it calculates exploratory data models for TVA in a variety of statistical graphical formats. The second part of the digital instrument reports the Trichotomous Visual Analytics in six unique tri–coordinate visual analytics graphical models. The first three tri–coordinate graphical models are dedicated to the initially reported Tri–Squared Test qualitative data (Figures 6 through 8, respectively). The second set of tri–coordinate graphical models are designed to illustrate the transformed data after the initial qualitative data has been recalculated into the quantitative “Standard 3 × 3 Tri–Squared Test Table” (Figures 9 through 11, respectively). Trichotomous Visual Analytics are illustrated further along in this narrative to show that additional novel statistical metrics can be implemented to idealistically derive further conclusions about trichotomous data through visual representations of the same trichotomous data. To start the TVA Figures, the Tri–Squared Calculator digital instrument reporting title for TVA is illustrated in Figures 1 and 2.
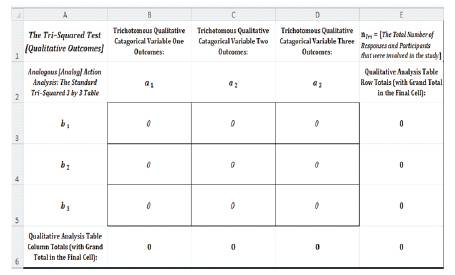
Figure 1. TVA Tri–Squared Calculator © Initial Data Interface Upload
Figure 2 displays the Internal Traditional Calculator contained inside the Tri–Squared Calculator used to conduct base operations. This tool is accessible through the primary calculator interface via a “clickable” button (right mouse click to “turn on” this particular tool in a new window—and the “×” or “close window” located in the upper right corner to turn the tool “off” and close it). Figure 3 displays the “Tri–Squared Test Critical Values” used in the digital instrument (the Tri–Squared Test Calculator ©) for the specific purposes of rejecting the null hypothesis (in Tri–CDA).
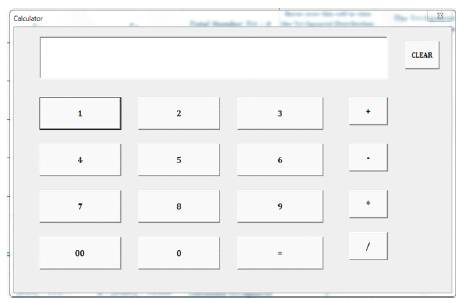
Figure 2. TVA Tri–Squared Calculator © Internal Data Traditional Calculator
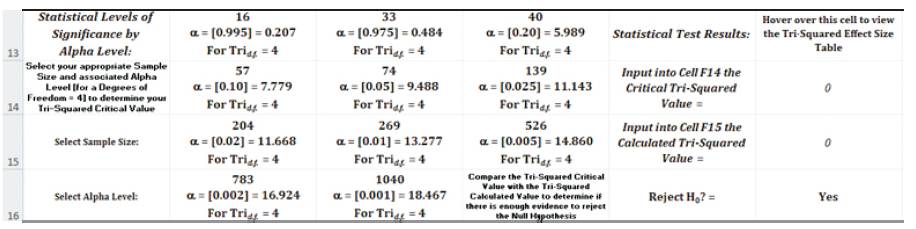
Figure 3. TVATri–Squared Calculator © Statistical Significance Critical Value Reporter
Figure 4 displays the introductory title used in the digital instrument (the Tri–Squared Test Calculator ©). The purpose of the title is to prepare the user to be introduced to the six forthcoming tri–coordinate graphics reported in initial aggregated qualitative and subsequent quantitative forms. The data is reported as “Trichotomous Categoric l Var bles = a ia ” [“TCV”] in terms of outputted “Trichotomous Outcome Variables” = [“TOV”] in a set of different tri–coordinate graphics that unique in their varied geometric outputs as displayed in the Tri–Squared Calculator ©.

Figure 4. TVA Tri–Coordinate Graphic Model Reporting Title
Figure 5 displays the mathematical formula that delivers the “Standard Tri–Squared 3 × 3 Table” (in variables a1 through a3 and b1 through b3 respectively). This mathematical equation appears in the title of the second part of the “Tri–Squared Calculator ©”and provides the user with a reference point that clearly illustrates the mathematical concept that forms the foundation of trichotomous research designs. The formula as displayed is defined thusly, “Tri–Squared (or “The Tri–Squared Test”) is equal to the concentrated trine squared (as defined in Osler, 2013a & 2013b , respectively) for tri – coordinates “x” times concentrated output “y” multiplied by three which is equal to nine times (Cartesian coordinates) “x” times “y” which is equal to the “Standard Tri–Squared 3 × 3 Table” (Osler, 2015).
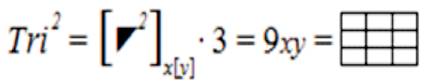
Figure 5. TVA Tri–Coordinate Graphic Model Mathematical Model [in the Reporting Title]
Using the sample data provided in Table 1, the statistical Trichotomous Visual Analytics (“TVA”) resulting data is reported as follows using the digital instrument which is the “Tri–Squared Test Calculator ©” (also known as the “Tri–Squared Calculator ©” in the subsequent Figures 3 through 8),
Figure 6 Summary: The sixth Figure displays the dramatic difference in the initial aggregated qualitative graphically (in cubic form) for “Trichotomous Categorical Variables” = [“TCV”] in terms of outputted “Trichotomous Outcome Variables” = [“TOV”] in hierarchal cuboids (or “rectangular prisms”) in the respective colors blue, red, and green according to their relative position on the “Standard Tri–Squared 3 × 3 Table” in variables a1 through a3 and b1 3through b3 respectively). The cuboids differ in height 3 according to their amounts as indicated on the Cartesian coordinates as listed in the “y” (or “ordinate”) axis of the graph. The abscissa or “x” axis displays the TCV data. The “z” (or “applicate”) axis creates the tri–coordinate dimensionality of the data set. This data set is further explained in the qualitative report below the graphic which serves as a key for the initial aggregated data gathered from the Tri–Squared Test “Inventive Investigative Instrument” (also called the “Tri–Squared Test: Triple–I”) data as displayed in the qualitative initial “Standard Tri–Squared 3 × 3 Table” in the Tri–Squared Calculator © (Osler, 2015).
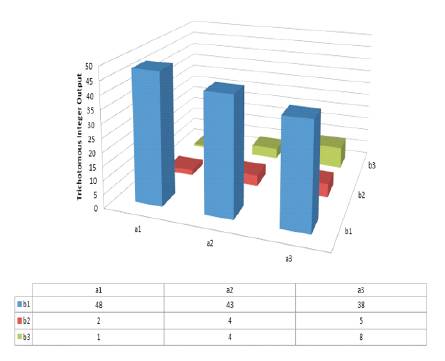
Figure 6. TVA Tri–Coordinate Graphic Model One [The Initial Aggregated Tri–Squared Cuboid Qualitative Data]
Figure 7 displays the dramatic difference in the initial aggregated qualitative data graphically (in a triangulated pattern) as “Trichotomous Categorical Variables” = [“TCV”] in terms of outputted “Trichotomous Outcome Variables” = [“TOV”]. The data is presented in a triangle graph. This particular set of Tri–Squared data is a triangular grouping of hierarchal diminishing triangles indicating the “expansion” or “contraction” (depending upon the viewer's perspective) of the trichotomous categorical data in units of “ten” in the respective colors blue, red, and green according to their relative position on the “Standard Tri–Squared 3 × 3 Table” (in variables a1 through a3 and b1 through b3 respectively). The data indicator triangles differ in size and shape according to variables a1 through a3 in a vertical pattern in amounts that range from 0 (at the center) to 50 (at the apex). The triangles differ in color according to their amounts and variables b1 through b3 respectively with b1 = a rectilinear blue rhombus (at the three triangular intersecting points for the largest amount of data); b2 = a rectilinear red square (at the three triangular intersecting points for the smallest amount of data); and lastly b3 = a rectilinear green triangle (at the three triangular intersecting points for the second largest amount of data) ( Osler, 2015).
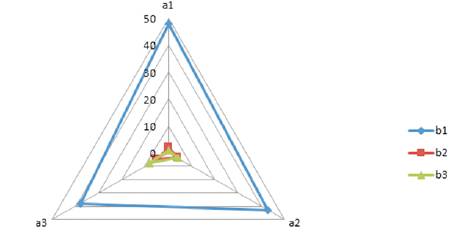
Figure 7. TVA Tri–Coordinate Graphic Model Two [The InitialAggregated Tri–Squared Triangular Qualitative Data]
Figure 8 illustrates the dramatic difference in the initial aggregated qualitative data graphically (in a rectilinear parallel series of declining or elevating planar “boards”) as “Trichotomous Categorical Variables” = [“TCV”] in terms of outputted “Trichotomous Outcome Variables” = [“TOV”] as rectilinear parallel tri–coordinate “boards” or “planks”. The data is presented in a tri–coordinate dimensional graph. This particular set of Tri–Squared data is a set of trichotomously grouped data in a tri–coordinate format for the specific purpose of illustrating the differences of aggregated data responses by participants in “Trichotomous Categorical Variables” = [“TCV ”] according to their output as recorded by the research “Tri–Squared Inventive Investigative Instrument” in the “Trichotomous Outcome Variables” = [“TOV”] “Standard Tri–Squared 3 × 3 Table” rows. The tri–coordinate “planks” according to “TOV”. The largest set of data by far is the b1 set of data (representing the specific set of responses recorded in “Standard Tri–Squared 3 × 3 Table” row b1 in cells a1b1; a2b1 ; and a3b1 ). The data is displayed in an elevated hierarchal fashion with the largest set of data at the highest point and its slope (either an “incline” or a “decline” depending upon the viewer's perspective) indicates the overall largest or conversely the smallest unit with that set of data. The data (in terms of specific amount) is illustrated on the “y” axis of the graph. Thus, the ordinate “ y ” tri–coordinate axis displays the trichotomous categorical data in units of “ten” in the respective colors blue, red, and green according to their relative position on the “Standard Tri–Squared 3 × 3 Table” (in variables a1 through a3 and b1 through b3 respectively). The data indicator tri–coordinate planar “boards” or “planks” differ in slope according to variables a1 through a3 in a vertical pattern in amounts that range from 0 (at the center) to 50 (at the apex) on the “y” axis. The planks (boards) differ in color according to their specified aggregated data responses in variables b1 through b3 respectively with b1 = a rectilinear blue parallel sloping plank (as indicated by the blue square tri–coordinate trichotomous output (outcome) variable for the largest amount of data); b2 = a rectilinear redparallel sloping plank (as indicated by the red square tri–coordinate trichotomous output (outcome) variable for the smallest amount of data); and lastly b3 = a rectilinear green parallel sloping plank (as indicated by the green square tri–coordinate trichotomous output (outcome) variable for the second largest amount of data) (Osler, 2015).
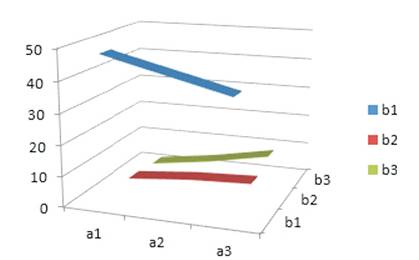
Figure 8. TVATri–Coordinate Graphic Model Three [The Initial Aggregated Tri–Squared Parallel Qualitative Data]
Figure 9 displays the dramatic difference in the initial aggregated qualitative graphically (for “Trichotomous Categorical Variables” = [TCV] and “Trichotomous Outcome Variables” = [TOV] as transformed quantitative “Transformative Integer Output” in hierarchal cylinders in colors blue, red, and green according to their relative position on the “Standard Tri–Squared 3 × 3 Table” in variables a1 through a3 and b1 through b3 respectively). This data set is further explained in the quantitative report below the graphic which serves as a key for the transformed data as the quantitative “Standard Tri–Squared 3 × 3 Table” in the Tri–Squared Calculator © further displaying the differences in the data shown above in a more traditional layout (Osler, 2015).
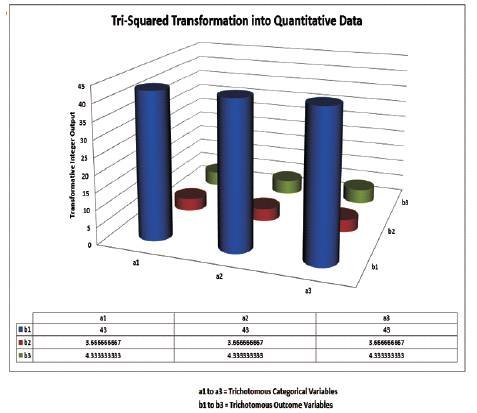
Figure 9. TVATri–Coordinate Graphic Model Four [The Tri–Squared Transformation of Qualitative Data into Quantitative Data]
Figure 10 illustrates the dramatic difference in the quantitative data graphically according to size or magnitude in relative comparison to its associated “Trichotomous Outcome Variables” = [TOV] as circular concentric torus or “doughnuts” in output colors blue, red, and green according to their trichotomous relative position on the “Standard Tri–Squared 3 × 3 Table” in variables a1 through a3 and b1 through b3 respectively. This data set shows the relative equality of the outputted data as the size (“magnitude”) of each variable is equal to its associated transformed output data (idealistically this is further explained in the second part of Figure 1. As the quantitative report below the Figure 1 graphic, which serves as the key for the Figure 1 transformed data) (Osler, 2015) .
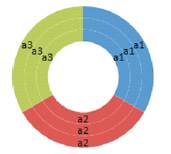
Figure 10. TVATri–Coordinate Graphic Model Five [The Tri–Squared Transformation of Qualitative Data into Quantitative Data: Analysis by Trichotomous Outcome Variable Magnitude]
Figure 11 highlights the dramatic difference in the quantitative outcome data variables graphically according to percentage in relative comparison to its associated “Trichotomous Outcome Variables” = [TOV] as a set of “longitudinal” bar graphs that display the equality of the TOV data (as blue = blue; red = red; and green = green). Sections of the bars are in the output colors blue, red, and green according to their trichotomously relative positions on the “Standard Tri–Squared 3 × 3 Table” in variables a1b1 through a3b3 respectively (Osler, 2015).
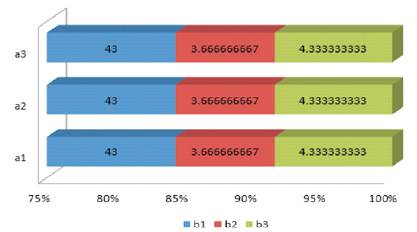
Figure 11. TVATri–Coordinate Graphic Model Six [The Tri–Squared Transformation of Qualitative Data into Quantitative Data: Percentage of Qualitative Output Deviation]
The Trichotomous Visual Analytics final results provide definitive evidence to support the initial rejection of the null hypothesis that took place when the initial Tri–Squared Test data was tabulated and aggregated. Each of the six individual tri–coordinate data models provide additional evidence as to why and how there was a calculated significant difference in the data based upon qualitative and subsequent quantitative outcomes. The graphical models provide a visual reference point for further detailed in–depth analysis of the data that actually was recorded and took place during the time in which the study was conducted (Osler, 2015).
The implications for TVA as a supportive or alternative model of in–depth investigative research in support of Trichotomous Exploratory Data Analysis are extremely positive. Using this research methodology, an investigator can now support their research findings with visuals and graphical models that clearly represent the research findings. This makes the trichotomous research outcomes more palatable to non–researchers (who can therefore view the outcomes with a greater level of understanding). This greatly aids in making trichotomous-based research more approachable, more usable, and more practical to the greater community who are interested in research outcomes and conducting the research in and of itself. As such the author recommends the following:
The utility of the Tri–Squared Calculator © and its use of Trichotomous Visual Analytics can be seen in the data provided in Table 1 and in Figures 1 through 11 respectively. The data outcomes reported in Tri–coordinate Modular Graphical Visual Analytics format give a detailed in–depth analysis of the Tri–Squared Test. This form of “visual reporting” completely sanctions and confirms the initial Tri–Squared Test by providing a richer, more detailed, and more in–depth look at the outcomes of “Trichotomous Confirmatory Data Analysis”. The utility of this technique and its presentation tool is an other addition to the traditional frequent trichotomous statistical methodologies to further validate and verify the outcomes of trichotomous–based research designs. The application, utility, and viability of Tri–Squared Calculator © and TVA makes them welcome accompaniments to the field of “Tri–Squared Research” and post hoc “Triostatistics” (Osler, 2014a). This thereby enhances “Triostatistical Analysis” where it now has digital research tools that enhance and empower researchers who seek to use “Triostatistical Research Designs”.