Fuse Deposition Modeling (FDM) is one of the most widely used Rapid Prototyping (RP) technology in market which uses additive manufacturing technic. FDM is not only known for the good mechanical property of its build model but a defame for producing poor surface quality parts compared to other available technologies. The need to ensure that the build part has a good surface quality thus exists. In this paper, the authors concluded the different process parameters and their effects on surface roughness from past studies. Most common parameters used to optimize the surface quality are layer thickness, raster width, air gap, raster angle and orientation. But there are few more parameters which they can use to control the quality of surface. Some of them are humidity, build envelope's temperature and multi-contouring and build style. So, a few pilot experiments were conducted for checking the feasibility of some rarely used process parameters, which are build style and multi-contouring, as optimization parameters for surface roughness. Their results of these experiments show that for the future experiment, they can consider as one of the parameter for building part with a good surface quality. Based on this study, they can use different approaches to achieve their motive to improve quality of build part in FDM machine with a good surface quality.
At the time of throat cut competition between different manufacturers, they have to launch new consumer products more rapidly and frequently to remain in the market for long term (Chua & Leong, 1997) [1]. Reduction in product development cycle is a necessity for the survival in industrial economies (Gunasekaran & Agile, 1998) [2]. Hence a technic which is neither very new or old, is making its space in field of different production technics. This technic is known as Rapid Prototyping (RP). RP is slowly penetrating into different area of production method and product. Although it is acclaimed for its inability in the use of mass production of a product, this technic can help in reducing time and cost by directly not involving the final product, but by assisting in different phases of the development and production of a product such as prototype design, pattern for casting or as a fixture.
Many RP technologies are available in the market, but FDM technology is the most important process because of its mechanical strength, low cost of machinery of parts made by the process, easy material changeability and long life in normal working condition, as compared to other technologies (Levy et al.) [3].
Surface roughness is one of the most famous criteria for the acceptance of the building parts for product, pattern or prototype of many Engineering Application. Mechanical strength, Material consumption, dimensional accuracy and build time are also the criteria for optimization of parameter. Susila et al. [4] used building orientation as one of the parameters to optimize the build time. It is found that, a right choice of orientation can reduce the build time. A poor surface quality affects the function of RP parts, depending on the geometry of the enclosing surface, the building strategy, layer thickness and orientation of the part; this drawback may outweigh the advantages of RP parts (Kruth, Leu & Nakagawa, 1998) [5]. Also an account of converting CAD model into a Standard Triangularisation Language (STL) format results in the chordal approximation error, which further degrades the surface quality. As a consequence, a need for some post production work always remain.
This study focuses on the effect of different building parameters in FDM to improve the surface roughness for reducing the post process work. Parameters which are focussed here are layer thickness, build orientation, deposition speed, road width etc. Some parameters have significant effect on surface quality while some do not have.
In FDM, a build material in the form of a filament is partially melted and extruded from a tip in a thin layer, in a pattern according to the input data made from 3D CAD model. When a new layer fall onto the bottom layer, it partially melts the bottom layer, then cools, solidifies and bonds together with the bottom layer. When their entire layer spread, build platform move downwards and a new layer starts forming. In this way, the part builds layer by layer in FDM (Chua et al., 2010) [6]. Figure 1 shows the FDM process of a building part.
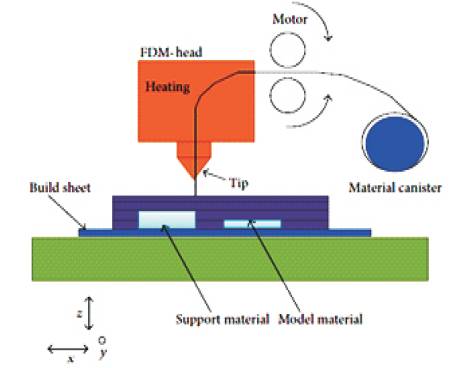
Figure 1. FDM Process (Godfre, Onwubolu & Farzad, 2014) [7]
Surface form in FDM is excessively rough, and this becomes worse in inclined surface because of an effect which is known as “stair stepping” [8]. The staircase effect cannot be eliminated on a RP part completely. Figure 2 shows the stair stepping effect. The quality of FDM fabricated part is dependent on the processing conditions (Zhou, J.G., Herscovici & Chen, 2000) [9]. Though it is impossible to achieve a very good surface directly from the FDM machine until now, the authors can impressively improve the surface roughness by choosing few optimal build parameters (Bharath, Dharma & Henderson) [10] .
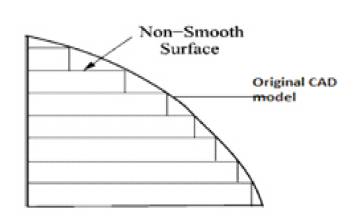
Figure 2. Stair Stepping Effect
A lot of studies have been done so far to improve the part quality. Han et al. [11] and Sun et al. [12] suggest that deposition speed affects the surface of the FDM part. Magrab [13] suggested the relationship between the surface roughness and tolerance of a part. The tolerance should be atleast ten times the value of the average surface roughness. Martínez et al. [14] uses Taguchi methodology and ANOVA analysis to select the best process parameters for surface finish of the FDM made part.
Anita et al. [15] have analysed the effect of road width, building thickness and speed of the deposition on surface roughness of FDM build part using taguchi's technics. Objective of the experiment was to minimize the surface roughness (Ra value). They analysed the results with Signal to Noise (S/N) ratio and the ANOVA analysis. They found out that the interaction between the layer thickness and speed of deposition and, speed of deposition and road width have negligible contribution on surface roughness. They pool out these interactions [16] due to which the contribution of other factors rise. The analysis shows that the layer thickness is the most significant factor to affect the surface quality of the part, by proving the contribution to 51.57% at 99% of significance level, whereas speed and road width are contributed to 15.83% and 15.57% at 99% level of significance.
Due to the “stair steeping effect”, surface roughness is very high on inclined surface. Ahn et al. [17] develop a theoretical model to show the variation of surface roughness value (Ra) with respect to the surface angle. They also consider the crucial factors layer thickness and overlap the interval which influences the roughness of the surface. In their theoretical approach, they considered the cross sectional shape of the model as an elliptical curve. Horizontal interval between the adjacent filaments of layer called air gap was not considered due to its lack of influence on the boundary profile (Ahn et al. [18] ). It is not treated in a determinate region (the region under the critical angle) because of its difficulty in defining the surface roughness profile. From their analysis of results, they 0 found out that at 90 , the surface, roughness value (Ra) is smaller than those of other surface angles. They also show that the input parameters like surface layer can further improve surface roughness with a smaller layer thickness. Computed value of surface roughness also improves with the increase in overlap interval. They verified the calculated data with the empirical data and demonstrated that the surface roughness can be predicted by analysing the main factor. Many other models were presented for better estimation of surface roughness by Dolenc and Makela [19], Campbell et al. [20], Mason [21], Byun and Lee [22] and Pandey et al. [23] . Roughness model by Pandey et al. [23] is one of the most accepted model for surface roughness estimation. Nourghassemi [24] found in his study that Pandey’s model performed better among other models with Campbell’s models as the worst for FDM build part for different orientation. Nourghassemi also suggested a hybrid model which further improves Pandey's model by 3.48% (Figure 3). Pandey et al. [25] concluded that for most of the RP process, surface roughness at a point on part is proportional to t/cosθ, where Ra is local surface roughness value, t is layer thickness and θ is build orientation i.e. angle between vertical and surface tangent at that point. It is the constant which differs for different RP processes.
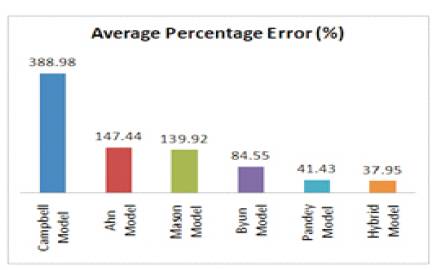
Figure 3. Comparison of the Average Percentage Errors for the Proposed Model and all Other Roughness Models (Nourghassemi, 2011) [24].
Bakar et al. [26] used FDM prodigy plus (Stratasys, Inc., Eden Prairie, MN, USA) to build a master pattern from ABS (P400) prior to Silicon Rubber Moulding (SRM). Since Silicon mould is good in duplicating any kind of surface condition, master pattern had to be of good surface quality. To improve surface quality, they selected the layer thickness, internal raster and contour width as the build parameter for optimization. They measured surface roughness value (Ra) on horizontal and vertical surface. They found that, horizontal surface had better surface roughness as compared to the vertical surface for every layer thickness and it was further improved with low layer thickness. This was due to the formation of fillet in vertical surface. According to them, low internal raster is good as it reduces the chances of formation void during the building process. Also contour width should be high to give the parts a good dimensional stability.
Build support plays a very important role at the time of building of the part. Khan et al. [27] observed that, the build support also affects the surface quality. In their study, they found that, the part surface with support material have a smooth surface structure compared to the surface without support structure. When the size of a single support structure is smaller than the slice thickness of the part produced, surface roughness of the part’s surface is adjacent to the support which means that the bottom layer have a good surface roughness finish compared to the support which is at the top layer.
P. Vijay et al. [28] experimented shows the effects of orientation on surface roughness. They showed that with the increase in orientation, the roughness slightly increases and then starts decreasing.
Galantucci et al. [29] in their experiment observed that the roughness value improves with the reduction of air gap. With a positive air gap, there is a gap between the adjacently laid roads. When semi-liquid material extruded, it can flow in the gap in an unexpected manner and can create variation in the surface. Negative air gap obtains flawed surface. With no air gap, the road laid adjacent to the other road, blocks the flow and fusion in an expected manner. Figure 4 shows the three conditions of air gap. They also found that after chemical treatment of part with a solution of Dimethyl ketone (90%) with water (10%) for 300 sec significantly improved the surface roughness of the top layer specimens. It was deduced that, the chemical treatment dissolves the single filaments that subsequently join together, reducing the roughness as shown in Figure 5.
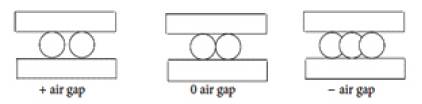
Figure 4. Air Gap Application (Sood, Ohdar & Mahapatra, 2010) [30]
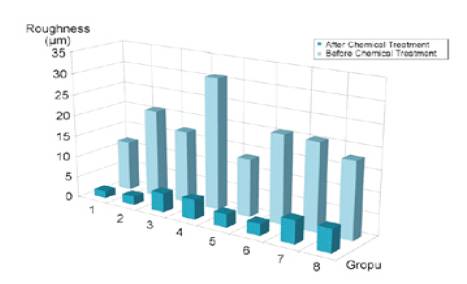
Figure 5.Effect of the Chemical Treatment on Top Surface (Galantucci, Lavecchia, Percoco, 2009) [29].
Ali et al. [31] observed that at 90⁰ raster angle, surface roughness reduces. They gave an explanation that at other angle, synchronisation of servo motor is required in X and Y direction during deposition of road and due to the servo motors' delay timing belts, fluctuations develop during the deposition of roads straight. This fluctuation produces voids, which raises the surface roughness. They also suggests low raster width. That is because, due to any variation in small raster width will produce less effect as compared to the variation in large raster width.
Gautham et al. [32] conducted experiments to obtain the surface roughness values as a function of orientation and layer thickness and developed a decision support software which allows dynamic color-coded visualization of surface quality with respect to the two build parameters.
It is observed from the study of past work that most of the time only single response was considered to optimize the parameter. Significance of any parameter for single response does not mean that, it is significant for optimization for other responses (Antony, 2001) [33] . Akande et al. [34] performed some experiments to optimize the parameters for two responses, dimensional accuracy and surface roughness. They assumed layer thickness, fill density and speed of deposition as optimizing parameters. They observed that optimum factor level was different for dimensional accuracy and surface roughness. For good dimensional accuracy, layer thickness should be high but for low surface roughness layer, thickness should be low. Because of this mismatch in result, optimization was carried out to find the global optimization parameter. Table 1 gives the summary of some important literature surveys.
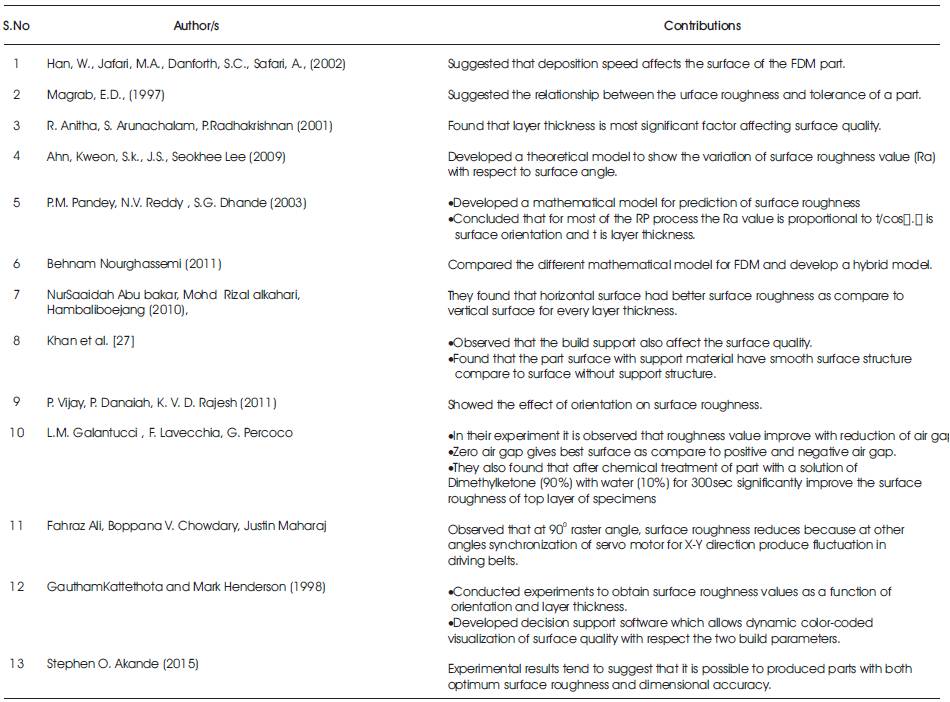
Table 1. Summary of Some Important Literature Surveys
Experiment was run to check the feasibility of input parameters i.e. whether the parameters chosen had any impact on response parameter i.e. surface roughness and choosing an optimum set from orthogonal array would give any relevance to the end product. Input parameters study here are build style and multi-contouring since not much works have been done by checking feasibility of these parameters to affect the surface roughness. Parameters were taken at three levels as shown in Table 2 and Table 3 respectively to check the feasibility in which the samples specimen were tested for surface roughness.
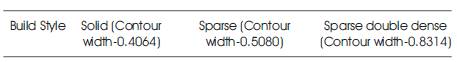
Table 2. Levels of Build Style Selected
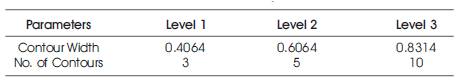
Table 3. Multi Contouring Levels
Build Style denotes the type of part interiors manufactured, depending on the application. The types of various build styles are mentioned below.
1) Solid - normal fills the part completely with fully dense raster tool paths. Figure 6 shows the pattern followed in case of solid fill pattern during the build.
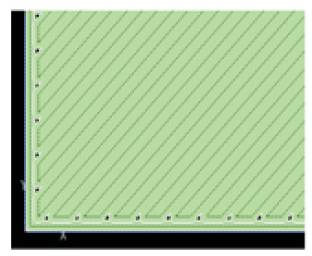
Figure 6. Solid
2) Sparse - minimizes the amount of model material used by utilizing a unidirectional raster with the gaps between raster legs for interior regions. Top and bottom exposed layers are built with the solid raster pattern. On layers with sparse, an extra contour is added to the part boundary and a separate contour encloses the unidirectional sparse rasters. Figure 7 shows the sparse fill pattern for the build.
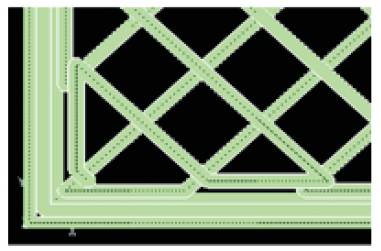
Figure 7. Sparse
3) Sparse Double Dense - minimizes the amount of model material used, but utilizes a crosshatch raster pattern. Top and bottom exposed layers are built with the solid raster pattern. Like sparse fill, an extra boundary contour is applied to the layers with sparse - double dense fill and a contour enclose the sparse bi-directional rasters. Figure 8 shows the pattern in form of bi rasters.
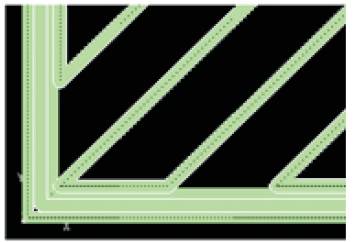
Figure 8. Sparse Double Dense
The machine use for fabrication of specimens is FORTUS 400mc, one which is shown in Figure 9. It is based on the fused deposition modelling. The built material is ABS M30i and the support material is SR 30. Specimen is a plate of thickness 5mm with a length and breadth of 5cm x 5cm. Three readings of average surface roughness (Ra) on top and bottom surface are taken. Mean of the observation is taken as the representative value of respective surface roughness. For measuring surface roughness, a contact type roughness tester is used, as shown in Figure 10.
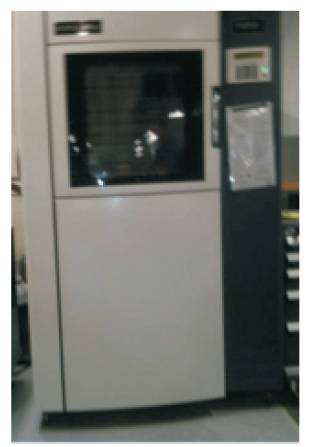
Figure 9. Fortus 400mc
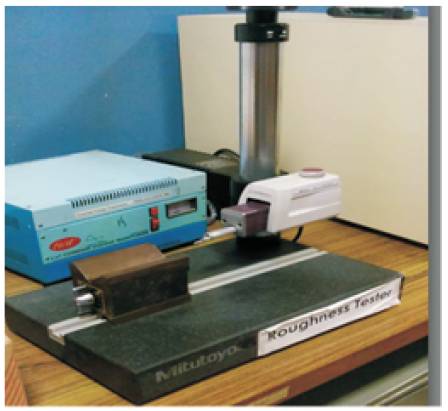
Figure 10. Surface Roughness Tester
In the case of build styles, the results are analyzed by ANOVA techniques to check the type of hypothesis to be applied; null or alternate hypothesis. Upon changing the build style, the variations obtained in the surface roughness are mentioned in Table 4. Table 5 is the analysis of variance. For this case, Table 4 shows that the calculated value of F is 4.883358 which is more than the table value of 3.68 at 5% level with d.o.f being v1 = 2, v2 = 15. This analysis which rejects the null-hypothesis of no difference is the sample means. Authors conclude that, the difference in surface roughness value due to variation in build style is significant.
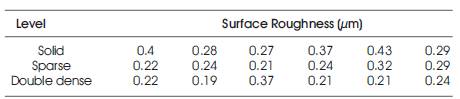
Table 4. Surface Roughness for Various Build Style
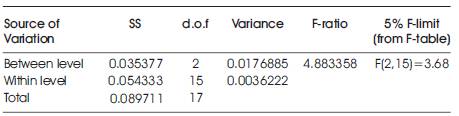
Table 5. Analysis of Variance
Multi-contouring means a adding number of contours covering the inner part. In FDM, it was interesting to see how multi contouring changed the response parameters. Along with a number of contours, contour width was also varied. In this case, it was interesting to consider the effect of surface roughness as the numbers of contours, were increased in multi-contouring. This was because of the effect of change in the material density on the outer layer of the surface. The results are analyzed by ANOVA technique to check the type of hypothesis to be applied; null or alternate hypothesis. Upon changing the number of contour, the variations obtained in the surface roughness are as mentioned in Table 6. Table 7 shows that the calculated value of F is 1.07652 which is more than the table value of 3.68 at 5% level with d.o.f being v1 = 2, v2 = 15 and hence could have arisen due to a chance. This analysis supporting the nullhypothesis of no difference is the sample means. They concluded that, the difference in surface roughness value due to variation in a number of contour is significant and is just a matter of chance.
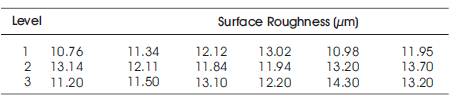
Table 6. Surface Roughness at Various Contour Widths
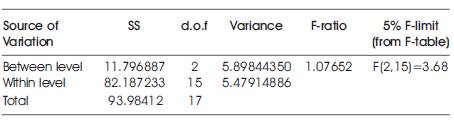
Table 7. Analysis of Variance
From the result, it can conclude that,
From past work, it is observed that the right choice of layer thickness and orientation always remain as a most significant parameter for surface roughness. While other parameters like road width, air gap and speed of deposition may also play an important role in enhancing the surface roughness. Also, a theoretical model can be developed to understand the effect of different parameters on surface. A post production process of chemical treatment had shown a significant improvement in the surface roughness. It is also observing that, the support structure affects the surface quality.
From pilot experiment, it is concluded that, build style can be an important process parameter for surface roughness, whereas variation in a number of contours does not have a significant effect on surface roughness.