With an increase in demand for high performance UAV (Unmanned Aerial Vehicles) for various demanding applications such as defense, search and rescue and weather monitoring, the design and production of the UAVs is of prime importance and with the UAVs comprising of many complex systems, the reliability of each system decides the reliability of the overall aircraft. One of the UAV’s critical components is its landing gear. High stiffness and lightweight are the main design criteria for the landing gear. Apart from the fatigue cycles, the propagation of crack in the landing gear structure due to the fatigue loading is also another important criterion for the design of the landing gear structure. This study is conducted using the Structural analysis available in ANSYS R15.0 using Mechanical APDL solver. In this paper, the authors have studied the effect of contours and crack length on variation of stress intensity factor for different modes and fatigue crack propagation rate. Static analysis is performed to locate the position of critical region. The variation of J Integral is studied for different contours along the crack front. The crack propagation rate was found to increase with the increase in crack length. The critical stress intensity factor is evaluated using modified Paris Law referred to as Forman Law.
Landing gears are structures which aid the aircraft in takeoff, landing and provide support during taxing. Different aircrafts require different structural systems of landing gear according to its application. Landing gear absorbs the horizontal and vertical loads during landing and acts as energy attenuation systems preventing damage to the aircraft systems. Thus energy absorption and toughness are the primary requirements of a landing gear. Design of landing gear involves various disciplines such as aeronautical, material science, and mechanical design. Fitness considerations for long time implications involves understanding phenomenon such as impact, creep, stress corrosion cracking, fatigue that affect the reliability, durability of structure and life expectancy [13].
Design of aeronautical components can be regarded as a challenge. Environmental [11,6] and financial issues [7], [8] are barely related to need for lightweight structures, while aviation organization [9], [10] and aircraft certificate specification [12] require construction of safe and reliable systems. Need for lightweight material with strength and stiffness has shifted the emphasis from conventional metals to composites. Less structural weight implies less fuel consumption and strength and stiffness increases the life expectancy of the landing gears and ensures reliable and safe landing.
Landing gears are subjected to constant fatigue loading due to frequent cycles of take-off, landing and vibration of propellers. Essam studied the cumulative damage ratio of a landing gear’s leg for an UAV using material S-N fatigue curve [11]. Dorothea C. Walden [3] discusses the application of composites in commercial airplanes and explains the design of aircraft parts using composites. Static analysis of glass fiber reinforced plastics for landing gears were presented by Goyal [4]. Fujimoto and Gallagher [2] studied the causes of crack generation in landing gears and found that inherent material defects, mechanical damage and crack growth at corrosion pits and operation conditions were the determining factors.
Literature survey suggests more work on static analysis and impact loading of landing gears. From the literature survey, it is noticed that the analysis of landing gears are limited to impact loading conditions. In practice, the landing gears are subjected to fatigue loading during take-off and landing. This paper deals with analysis of landing gears for fatigue loading and evaluate crack propagation rate and stress intensity factor along the crack front for different values of initial crack length. Here the authors present the analysis and fatigue loading conditions using ANSYS Mechanical APDL solver.
As Solanki et al. [5] pointed out that in FE simulation, it is important to recognize that an incremental crack growth simulation with the node release involves no consideration for the physics of fatigue crack growth since the increment is determined independently of stress and strain levels in the vicinity of the crack tip. Accordingly, the results of FE analysis should be used with caution to predict the fatigue crack growth behavior. Nonetheless, to promote the understanding of material behavior, it is useful to develop or use the models to simulate the material response. The authors believe that the FE analysis is an effective means to study some aspects of the fatigue crack behavior.
The need for high strength and tough materials along with lightweight has broadened the scope for application of composite materials in aerospace structures. Here they use Glass Fiber Reinforced Epoxy (GFRE) for fabrication of the landing gear structure. Table 1shows the material properties of GFRE. Figure 1 shows the SN curve for GFRE.
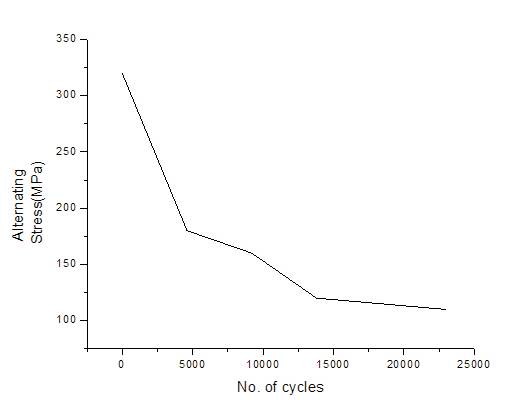
Figure 1. SN Curve for GFRE
From Table 1, E is the Young’s Modulus, v is the Poisson’s ratio, G is the Rigidity Modulus, and the subscripts indicate the directions along principle axis.
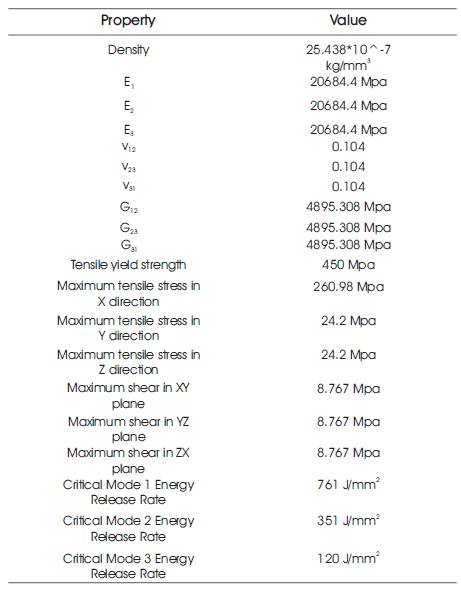
Table 1. Material Properties [4]
The landing gear was modeled using DDS Solidworks (version 2013). Figure 2 shows the 2D top view and front view dimensions, Figure 3 shows the 3D model of actual landing gear used by UAV (Unmanned Aerial Vehicles).
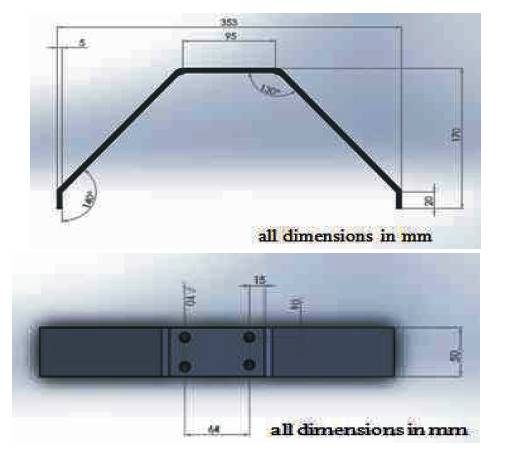
Figure 2. Geometry of Landing Gear
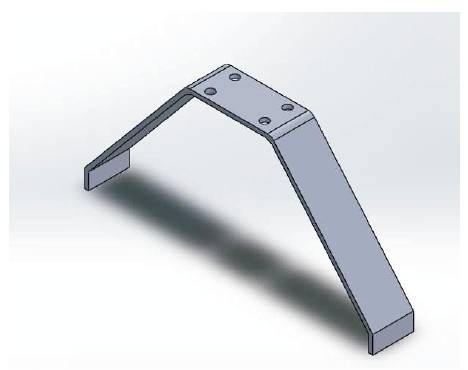
Figure 3. 3D Model of Landing Gear
The Finite Element Analysis was divided into 2 modules; Static Structural and Fatigue Analysis. Static Structural Analysis gives the location of most probable location of crack initiation, while in fatigue analysis, stress intensity factor and J Integral was evaluated along the crack front. Table 2 shows the meshing details of the model. The largest contour of the crack was considered to be 0.3 mm diameter with 6 mesh contours. The major and minor diameter of the crack was varied to study the effect of crack length on crack growth rate and fatigue life. Figure 4 shows the nomenclature of the crack.
The following assumptions were made for analysis:
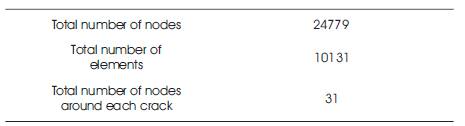
Table 2. Mesh Characteristics
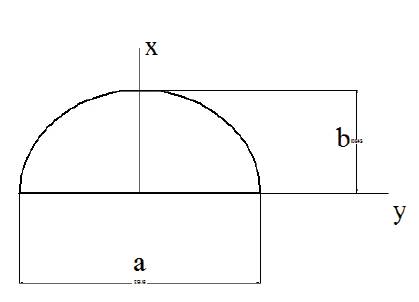
Figure 4. Crack Nomenclature
Static analysis was done to ascertain the most possible position of crack initiation. Von-Mises failure criterion was considered for the analysis. Figure 5 shows the loads acting on the structure with 1600 N acting on the mounting and 800 N acting on the base. The load acting on the mounting is due to the weight of the aircraft structure, this weight was found to be 160 Kg, and hence the load acting on the mounting is 1600 N. This load is distributed among the two base faces giving rise to a load of 800N on each of the faces. Figure 6 shows the stress induced in the structure due 2 to static loads. The maximum Von Mises stress is 323 N/mm . The obtained stress is less than yield stress of the material, so the structure is safe for the applied loads. Figure 7 shows the total deformation due to the loads. The maximum stress is acting at the bent region, hence probability of initiation of crack at the point is high and can be regarded as the critical region.
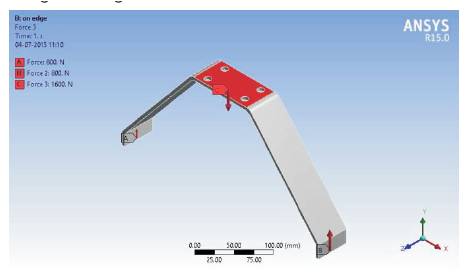
Figure 5. Loads Acting on Landing Gear
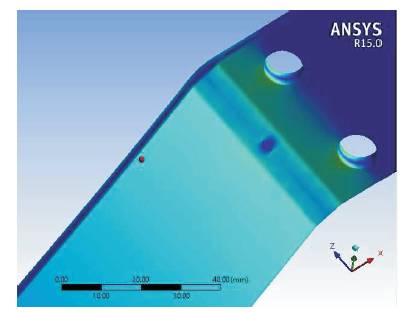
Figure 6. Stress Distribution and Location of Maximum Stress
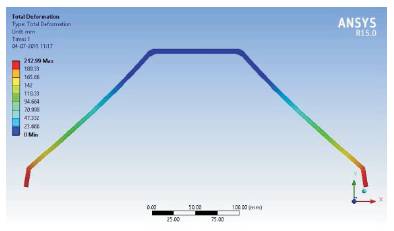
Figure 7. Total Deformation Due to Loads Acting on Structure
A semi elliptical crack was initiated at the junction as shown in Figure 8. Figure 9 shows the mesh created around the crack. The fineness-coarseness of the mesh is adaptive i.e., the mesh becomes finer for each iterations. The minor and major radii of the elliptical crack were set as parameters and the parametric study was conducted for each crack length. For each crack length, the maximum and minimum values of K1 were obtained. Also, the Stress intensity factor was calculated numerically along the length of the crack front.
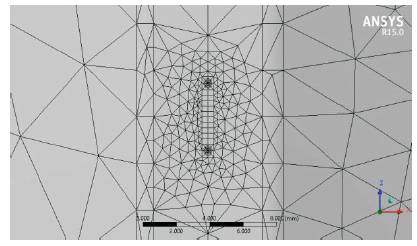
Figure 8. Semi Elliptical Crack Tip
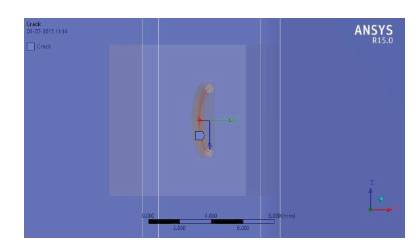
Figure 9. Crack Mesh
ANSYS uses contour integration to solve a given problem. By this, ANSYS solves the conditions around the crack not as a bulk solution but by using the contour paths around the crack tip. Both rectangular and semi-circular paths are used with the former in regions distant from the crack tip, and the latter close to the crack tip.
Figure 10 shows the variation of K1 along the crack front for different contours. Figure 11 shows the variation of J Integral along the crack front with different contour paths. The comparison between the geometries reveals that the shape of curve for J Integral remains same irrespective of contour chosen. However, for SIF the shape of the curves changes for each contour. Figure 12 shows the variation of K1, K2, K3 along the crack front position. It is seen from the figure that mode 1 dominates with maximum SIF of 470 Mpa and 0.5 Variation of K1 along the crack front is shown in Figure 13. It is maximum at points 1 and 2 due to high stress induced by maximum crack mouth opening displacement.
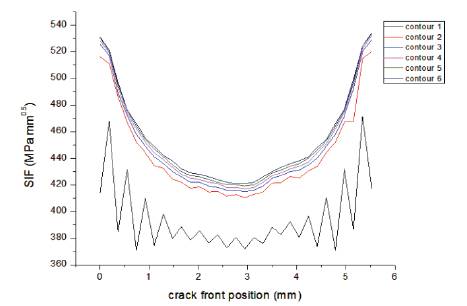
Figure 10. Variation of K1 for Different Contours
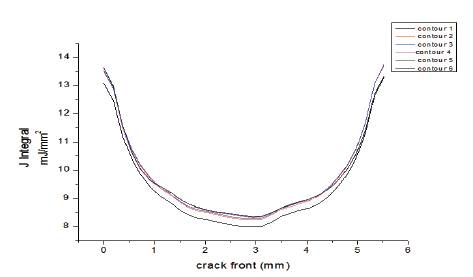
Figure 11.Variation of J Integral for Different Contours
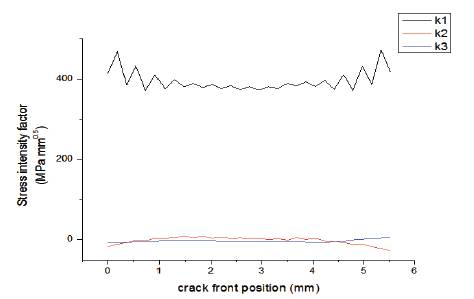
Figure 12. Different Modes of Stress Intensity Factor along Crack Front Position
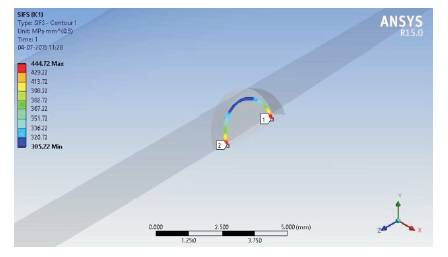
Figure 13. Variation of K1 Along Crack Front
A crack is found to initiate at the tip of an existing crack or region of high stress concentration. The crack grows with each applied load cycle and hence the parameter crack growth rate (da/dN) becomes important. Initially da/dN is small of the order of one lattice parameter. As the crack grows, da/dN increases according to Paris law given by Equation 1.
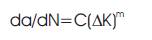
where ‘C’ and ‘m’ are material constants and ΔK is the difference between maximum and minimum Stress Intensity factor. With increasing load cycle, the crack grows and da/dN eventually becomes quite large and crack becomes critical. Figure 14 shows a plot of crack growth rate as a function of stress intensity factor. It is observed that initially at smaller DK, da/dN is as low as 0.0034 mm/cycle. As the crack grows, da/dN increases erratically with ΔK and reaches a maximum of 1.23 mm/cycle.
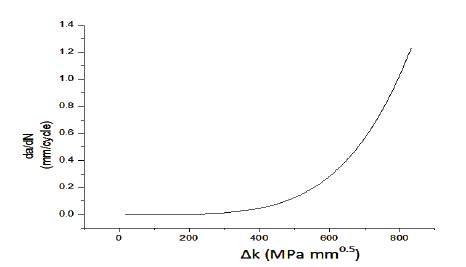
Figure 14. Crack Growth Rate vs ΔK
The crack growth rate analysis was done for various crack length. Figure 15 shows a plot of crack propagation rate as a function of initial crack length. It is observed that, as the crack length is increased from 3mm to 5mm, the rate at which crack propagates increases from 0.4 mm/cycle to 2.25 mm/cycle.
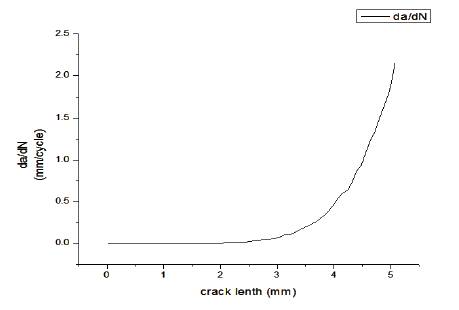
Figure 15. Crack Propagation Rate for Different Crack Length
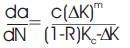
Critical stress intensity factor (KIC) is evaluated using Forman law. If the value of R is to be considered to determine the crack growth rate, Paris law has to be modified. Forman [1] proposed the equation to determine critical SIF using crack growth rate:
KIC is calculated for different values of crack length from 0.1mm to 5 mm. It is observed from Figure 16 that, the value of KIC increases gradually from 5 MPam0.5 to 27.5 MPam0.5.
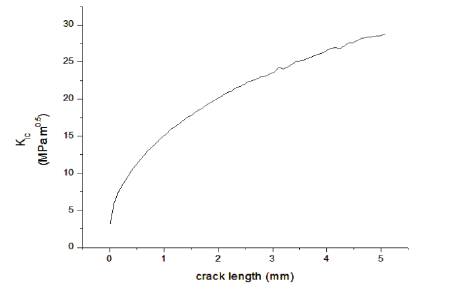
Figure 16. Variation of KIC for Increasing Crack Length
In this paper, Finite Element Analysis of the crack was done with the help of ANSYS R15. Static analysis was performed to identify the crack initiation position. The maximum Von- Mises stress was found to be 323 Mpa. The effect of crack length on different modes of stress intensity factor and crack propagation rate was studied. The shape of the graph for K1 along the crack front varied for each contour whereas the shape of graph remained the same for J Integral. Mode 1 was found to dominate over mode 2 and mode 3 for the given geometry and loads. The maximum value of K1 was found to be 423 Mpa mm at the surface intersection. Crack propagation rate was studied as a function of ΔK and initial crack length. The value of critical stress intensity factor was evaluated using Foreman’s law. The effect of initial crack length on KIC was also studied.
The authors thank R.V. College of Engineering, Karnataka, India, for its support in making this study possible. They would like to thank the Professors of the Department of Mechanical Engineering who provided insight and expertise that greatly assisted the research and improved the manuscript.