Figure 1. Logical subnet of Nodes in LANMAR Routing Protocol
Multi-hop network is a wireless network that is formed for a temporary purpose. Unlike wired network, there is no centralized control over the network. So, all the devices act both as nodes and routers. Nodes have the property of moving with certain speed. Due to this property, there is a dynamic change in the connections among nodes. At any time, there is a change in number of nodes and their speed of moving in the network. Network size is the number of nodes participating in the networks. It has a noticeable influence on the network scalability and connectivity. These two properties have a great impact on MANET. This paper makes an effort to study the influence of one of the most important parameters, i.e. network size on the performance of MANET while implementing LANMAR routing protocol.
Mobile Ad hoc NETwork (MANET) is a group of self-organizing wireless mobile devices connected together (Ilyas, 2003). It is called as the multi-hop network since it takes the help of in-between nodes to forward the data packet from source to destination due to its limited transmission range. MANET has the properties of mobility, unpredictable topology changes, limited energy resources, etc. Due to this mobility property, there is a dynamic change in the connections amongst nodes in the network. At any time, there is a change in number of nodes and their speed of moving in the network (Anveshini & Pallam, 2018). Network size is the number of nodes participating in the networks. It has a considerable effect on the network scalability and connectivity. These two properties have a noticeable impact on the performance of MANET. This paper makes an effort to study the influence of one of the most important parameters, i.e. network size on the performance of MANET while implementing LANMAR (LANdMARk) routing protocol.
To provide QoS, the network is likely to guarantee a collection metrics like throughput, routing control overhead, etc. Based on the topology, the routing protocols are characterized into flat, hierarchical and geographical routing protocols (Mehran, Tadeusz, & Eryk, 2003; Neeraj & Sarita, 2017). In flat routing, all the nodes work at the same level with same routing functionality. Flat routing is easy and green for small networks. If the network becomes huge, the extent of routing data will become huge and it will take a long term for routing data to arrive at far flung nodes. This makes flat routing not suitable for scalable routing. Hierarchical routing protocols are best suitable for efficient scalable routing in High mobile ad hoc networks. One of the examples of hierarchical routing protocols is LANMAR routing protocol (Tsuchiyaj, 1988).
There are many factors affecting the performance of the routing protocols in MANETs. For example, various parameters like mobility speed, mobility models, terrain region, number of nodes in the network, traffic type, etc., have an impact on the performance of the routing protocol. This paper makes an effort to study the influence of one of the most important parameters, i.e. network size on the performance of MANET while implementing LANMAR (LANdMARk) routing protocol in MANETs.
Anveshini and Pallam (2018) have investigated the effect of the mobility speed on the performance of LANMAR routing protocol in MANETs. They observed that there is a change in the performance of the routing protocol as the mobility of the nodes increase or decrease, i.e. they observed that as the mobility speed increases the delay increased and the energy consumption also increased. The reason is, as the mobility speed increases, the link breakages are more. Due to this dynamic change in topology, the delay and the energy consumed is observed to be more when compared to the performance with respect to the low mobility speed.
Surinder, Dhaliwal, Rahul, and Mahendra (2017) carried out simulation study in terms of packet delivery ratio, Throughput, end to end delay, routing overhead, and energy consumption for dissimilar Terrain area and node mobility. From the study, it was detected that packet delivery ratio and throughput fall as node density and node speed rise. End to End Delay and Energy consumption increases as number of node and node's speed increases.
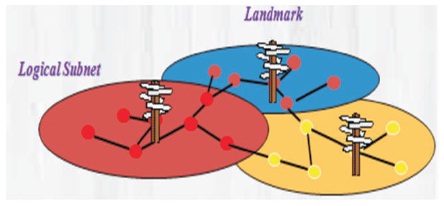
LANMAR Protocol (Pei & Gerla, 2000; Mario, 2003) adopts the idea of logical groups in which nodes travel as a group (Dinesh, Ashish, & Anil, 2011; Koushik, Vetrivelan, & Ratheesh, 2015; Harish, Sanjeev, & Santoh, 2011) in a coordinated fashion (E.g., Battle Field, Search, and Rescue Operations). Every logical subnet of nodes (Figure 1) has a header node (LANDMARK header), which takes the responsibility of forwarding the packets to the node in its subnet. Such LANDMARK header maintains subnet data. The concept of “nodes moving in a coordinated fashion in a group” has real-time applications in battle field and disaster-relief rescue operations, conferences, etc.
Figure 1. Logical subnet of Nodes in LANMAR Routing Protocol
The LANMAR protocol uses Fisheye state routing (FSR) protocol as the local scope routing protocol in which scope is measured in hop distance (Figure 2). All the nodes in the network which have the same commonality of moving together are grouped together and in each group, a node is selected which covers the maximum number of nodes in that group and such node is called as landmark. The landmarks locations are distributed by a distance vector mechanism. All nodes maintain a distance vector for headers in all scope. FSR is used to forward the packets to the nodes within the scope of a landmark by the landmark. The distance vector table maintains all the logical subnets addresses present in the network. The nodes which are distant from the scope of landmark are called as drifters.
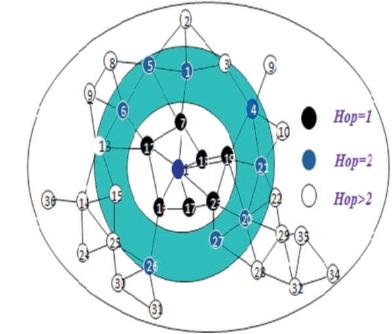
Figure 2. Scope of Landmark Measured in Hop Distance
Always there is an exchange of the distance vectors of landmark nodes and the drifters by a continuous periodical updates. The LANMAR is a proactive routing protocol that has the necessary routing data of the nodes inside the scope. For routing inside the scope, each node periodically interchanges the routing information to its one hop neighbours. In each update, the node includes all the routing table entries and sends to the nodes present in the scope.
When a node wishes to transmit a packet to the destination node within its scope it refers the routing table, the packet will be forwarded straightaway by FSR protocol (Pei, Gerla, & Chen, 2000). A landmark is dynamically elected in each group. Every node in fisheye scope uses FSR to route packets to the landmark header that directs the packet to the corresponding landmark of the destination node. The transmission between the landmark headers is done by Landmark routing protocol with respect to their scope ID.
The eye of a fish captures the pixels with high detail which are nearer a focal point. The detail of the object shrink as the distance from the focal point increases. In FSR (Gerla, 2002), each node gradually reduces down the update rate for destination with growing hop distance. Therefore, entries related to nodes within a scope are disseminated to neighbour nodes with a frequent rate. Eventually, the topology table entries (corresponding to far away destinations) are repressed, hence reducing network overhead.
The various timing parameters used in LANMAR are shown in Table 1. LANMAR timing parameters values have worked well for high mobile large networks. The timing parameters should be managerially configured for different network sizes at different mobility speeds dynamically either experimentally determined values or dynamic adaptation.
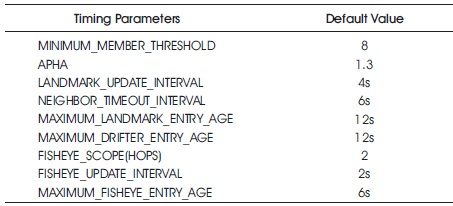
Table 1. LANMAR Routing Protocol Timing Parameters
Here, minimum member threshold-states the least number of neighbours in order to be considered a landmark, alpha-specifies the multiplication factor required to update the landmark, landmark update interval-specifies the landmark update interval, neighbour timeout interval-specifies the landmark neighbour timeout interval, maximum landmark entry age-specifies the maximum age for landmark entries, maximum drifter entry age-specifies the maximum age for drifter entries, fisheye scope-specifies the Fisheye scope for local routing, fisheye update interval-specifies the routing table update frequency within the Fisheye scope, and maximum fisheye entry age-specifies the maximum age for Fisheye entries.
The existing methods for assessing the performance of protocols include mathematical analysis, direct measurement, and computer simulation. The direct measurement as a choice of technique will be high priced, however is an alternative to simulation. In direct measurement the evaluation is to be achieved on an operational network, which could lead to disruptive condition and an operation network could be very costly in terms of configuration complexity. The benefit of direct measurement is accuracy in results. After taking all of the limitations into consideration, mathematical and computer simulation (Yeng-Zhong et al., 2008; Tamilselvan, 2010; Bharti, Naveen, & Bhupender, 2012) are appropriate for our research. There are numerous benefits of mathematical evaluation like cost, time, and the potential of presenting fine predictive results.
SCALABLE was founded in 1999 by Dr. Rajiv Bagrodia. There are various versions: QualNet, EXATA (2008) EXATA/ Cyber (2010). EXATA is a widespread collection of tools for simulating and emulating different networks. It develops tests, and evaluates and train users on cyber war and network security technologies. It maps physical devices using EXATA applications, EXata simulator/emulator 5.41 is used to create a simulation environment. The simulation parameters are given in Table 2.
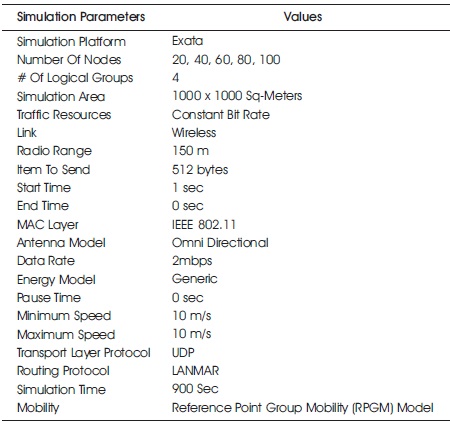
Table 2. Simulation Parameters
In Table 2, the specification of mobility model parameters and its values for the variable network size are shown.
In group mobility models, the nodes are prearranged into four different groups (0-3 groups), each group has equal number of nodes with different mobility speeds.
The MANET scenario is created with different network sizes (20, 40, 60, 80, and 100) by dividing the nodes into four groups (group 0, 1, 2, and 3). Each colour represents different group. Number of mobile nodes as created and they are connected through wireless links in 1000 x 1000 square meters terrain. All the nodes are set to move in 'reference point group mobility' fashion. The transmission and reception of data between nodes in the same group is done by using Fisheye State Routing Protocol and the transmission and reception of data between nodes in different groups is done by using Landmarks as mentioned in Section 2.
The figures shown below (Figures 3 and 4) are the screenshots taken during the simulation in EXata simulator. During simulation, the mobile nodes of different groups in the terrain region start transmitting data by moving in a 'reference point group mobility' fashion with different mobility speeds.
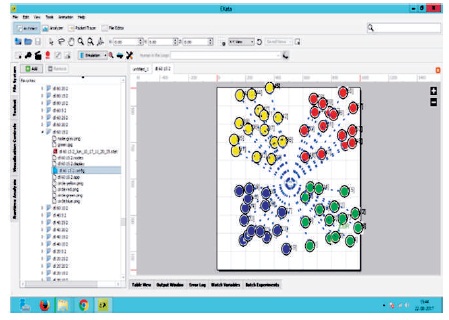
Figure 3. Snapshot of Simulation Environment of LANMAR Protocol before Simulation Starts
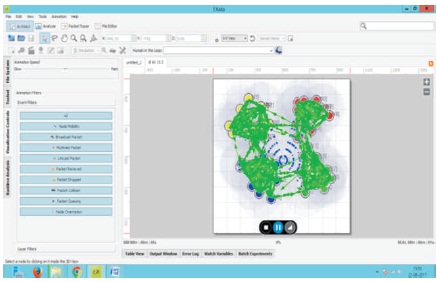
Figure 4. Snap Shot of MANET Scenario of LANMAR Routing Protocol during Simulation
To assess, how the increase in number of nodes affects the routing protocols' performance in terms of various metrics is shown below.
It is the number of bits sent in the network during the simulation.
In the below graph (Figure 5), maximum throughput is accomplished on 40 nodes. The simulations are done with various network sizes at mobility speed of 10 m/s. It is observed that LANMAR achieved high throughput at 40 nodes.
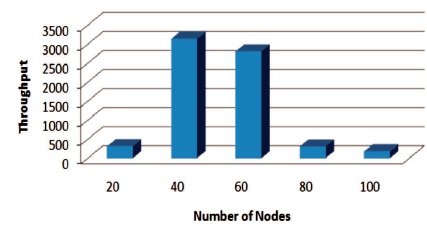
Figure 5. Variation in Throughput with the Network Size
It is the average time it takes for a data packet to reach the destination.
In the below graph (Figure 6), end-to-end delay is minimum at 40 nodes. The MANET environment is created with different number of nodes in the network. It is observed that LANMAR achieved less end-to-end delay for 40 number of nodes.
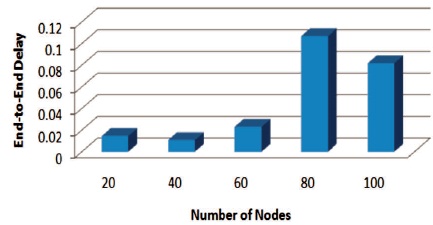
Figure 6. Variation in End-to-End Delay with the Network Size
It is the variance of minimum and maximum delay is jitter.
In the below graph (Figure 7), jitter is minimum for 20 nodes. It is observed that LANMAR achieved less jitter for 20 number of nodes.
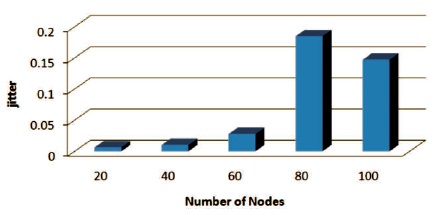
Figure 7. Variation in Average Jitter with the Network Size
It is defined as the total number of bytes sent as control packets.
In the below graph (Figure 8), the control overhead increases with the increase in network size. As the number of nodes in the network increases, the number of control packets also increases. The control packets used to send the actual data packets are called as control overhead.
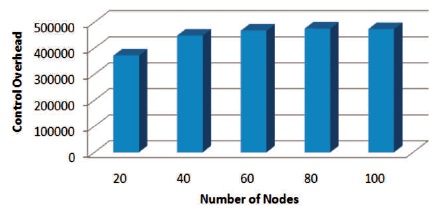
Figure 8. Variation in Control Overhead with the Network Size
Energy Efficient Routing Algorithms address the total energy consumption issue, which in turn in creases the network lifetime. The main drive of energy efficient algorithm is to make the network function long. In MANETs, energy is consumed in transmitting, receiving, and sleeping modes. Nodes require more energy to transmit. Nodes in idle state neither transmit nor do receive any signals.
Energy consumed by a node when it sends data packet to other nodes in network and is formulated as:
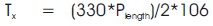
where Plength - length of data packet (Bits).
In the below graph (Figure 9), we can observe a rise in energy consumption with the rise in network size. As the number of nodes in the network increases, the transmissions among nodes in the network also increases. Therefore, the energy consumed for transmission of data packets also increases.
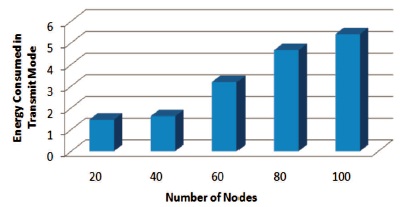
Figure 9. Variation in Energy Consumption in Transmit Mode with the Network Size
Energy consumed by a node to receive a data packet and is given as:
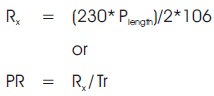
where PR- Power consumed to receive packet, Rx -energy consumed to receive packet, Tr-time taken to receive data packet and Plength -length of data packet (Bits).
In the below graph (Figure 10), we can observe a rise in energy consumption with the rise in network size. As the number of nodes in the network increases, the transmitting and receiving of data packets among nodes in the network also increases. Therefore, the energy consumed for receiving of data packets also increases.
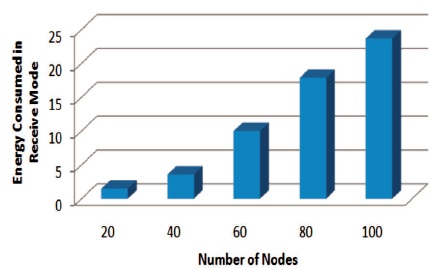
Figure 10. Variation in Energy Consumption in Receive Mode with the Network Size
The node is not transmitting or receiving any data packets in this mode. But, eavesdrops the wireless medium constantly to detect a packet that it should receive.
PI = PR
where, PI and PR are power consumed in Idle and Reception modes, respectively.
In the below graph (Figure 11), we observe that there is a fall in energy consumption with the rise in network size.
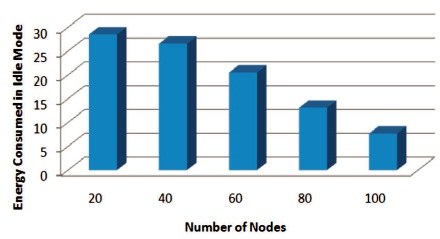
Figure 11. Variation in Energy Consumption in Idle Mode with the Network Size
It is defined as the sum of all the energy consumptions in transmit, receive, and idle modes.
In the below graph (Figure 12), we observe the rise in the total energy consumption with the rise in network size. As the number of nodes in the network increases, the amount of energy consumed also increases because the overall average battery capacity of the nodes and the energy consumption of nodes in the network increase.
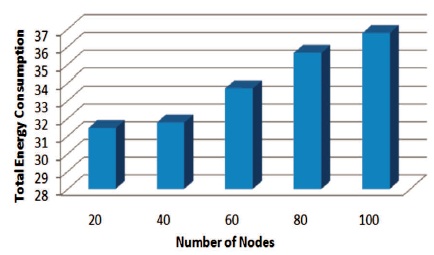
Figure 12. Variation in Total Energy Consumption with the Network Size
The paper brings forth the effect of network size (20 nodes-100 nodes) on the LANMAR routing protocol's performance in terms of various metrics. For this, MANET environment is created with the 1000 * 1000 sqm terrain region with number of nodes placed in it and four groups are formed and LANMAR routing protocol is configured. The communication (transmission/ reception) of data among nodes in the same group is done using Fisheye State Routing Protocol and the communication among nodes within different groups is done using Landmarks. RPGM model is incorporated into MANET nodes. To assess the LANMAR routing protocol's performance with different network sizes, we considered nine output metrics. Network size is the number of nodes participating in the networks. It has an evident effect on the network scalability and connectivity. These two properties have a noticeable impact on the MANET's performance. The variation in network size has effect on the energy consumption because if the number of nodes in the network increases then the number of transmission and reception of data increases, which obviously increases the energy consumption. It is analyzed that as the network size increases, the energy consumption also increases in LANMAR routing protocol in MANETs.