(1)
Mobile Ad hoc Network (MANET) attracted many proficient researchers because of its various features. In MANETs, routing is a challenging issue because of route changes and link breaks. Among the reactive routing protocols in MANETs, Dynamic MANET On-demand (DYMO) routing protocol is selected because it is scalable for larger networks and it has less routing overhead. The drawback of DYMO routing protocol is that it does not support for smaller networks with low mobility speed. In this paper, the authors apply Taguchi Design of Experiments approach to identify the most significant factor that enhance QoS (Quality of Service) performance of DYMO routing protocol for smaller networks with low mobility by considering Route Request Wait Time (RRWT), Route Timeout (RT), Route Request Retries (RRT) as influencing parameters of DYMO routing protocol. The impact of three influential factors on two QoS performance metrics, i.e, Average Throughput and Packet Delivery Ratio has been evaluated. The experiments are run on NS2 simulator and the results are analyzed through Statistical tool Minitab using Main Effects Plot, Response Table and validated using Normal probability plot of Residuals, Residual Histogram, Residuals vs. Fits, and Residuals vs. Order. The Route Request Wait Time (RRWT) is identified as the most significant factor among the other factors for enhancing QoS of DYMO routing protocol for smaller and medium network sizes.
Mobile Ad Hoc Network (MANET) is an ad hoc network, which is a collection of wireless mobile devices that does not require any fixed infrastructure and centralized administration for carrying data packets between nodes (Pandey, 2015). MANET is a self-configuring, selforganizing, multi-hop, infrastructure-less network of mobile devices connected wirelessly. Mobile ad hoc networks hold a flat network infrastructure. It has a shared medium, which is highly required for radio communication. In MANET architecture every node acts as a router as well as end host. The nodes in the MANET architecture are autonomous (Mirza & Bakshi, 2018) MANET has a dynamic topology architecture where the nodes support highly mobility and change from one place to another (Khan et al., 2007). In the MANET architecture, every node also works as a sender, receiver as well as a router to carry out information exchange as well as control information.
Routing in MANETs is a challenging problem because of route changes and link failures due to the mobility of nodes. A large number of routing protocols have been proposed in MANETs (Perkins, 2001; Abolhasan et al., 2004). Routing protocols can be broadly divided into two major categories: proactive and reactive routing protocols. Proactive routing protocols transmit routing information from each node to other periodically and maintains routes of each and every node in the network, whereas reactive routing protocols find routes on demand, i.e. only when a source requires to send information to a destination. Overall, analysis indicates that reactive protocols outshine proactive protocols and also reactive routing protocols have less routing overhead (Mohamed et al., 2010). So the reactive routing protocols are considered for the research work. The major reactive routing protocols considered are Ad Hoc On-demand Distance Vector Routing (AODV) and successor of AODV –Dynamic MANET On-demand routing (DYMO) (Saxena & Sinha, 2014; Manohar, 2018). DYMO is best reactive routing protocol when compared to AODV.
The performance analysis of routing protocols is calculated usually by simulation as it is cost effective, easy to run, and takes less time than in real time (Mohamed et al., 2010; Boukerche, 2004; Broch et al., 1998; Perkins et al., 2001). Most of the studies carried out by researchers on analyzing the performance of MANET routing protocols have been worked on the one factor at a time analysis approach, but it is restricted on identifying the impact of factors on one or more performance metrics (Mohamed et al., 2008b). In one factor at a time approach, the experimenter considers the vital factor that has a significant effect on protocol performance and varies that parameter across the range while keeping all other factors constant. From the previous articles, it is understood that a little work has been done to optimize the performance of the network with several factors analyzed simultaneously (Mohamed et al., 2010). Thus, an attempt has been made in this paper, to enhance the research methodology by varying multiple factors at a time and evaluating different performance metrics using Taguchi Design of Experiments approach.
This paper identifies the most significant factor of DYMO routing protocols using Taguchi Design of Experiments by considering the effective factors Route Request Wait Time (RRWT), Route Timeout (RT), and Route Request Retries (RRT) with two QoS metrics -Packet Delivery Ratio (PDR), Average Throughput (ATP). Finally, selects the most significant factor of DYMO routing protocol to enhance the QoS for smaller and medium networks in MANETs. By means of Taguchi approach, the anticipated information can be acquired through the less number of simulation runs (Mohamed et al., 2009) and the most important factors can be achieved along with the best level of the factors. The performance metrics are investigated using Main Effects plot, Response table for Signal-to-Noise Ratio, and validated using Normal probability plot of Residuals, Residual Histogram, Residuals vs. Fits, Residuals vs. Order through the Statistical tool -Minitab.
Mohamed et al. (2010) assess the performance of Dynamic Source Routing (DSR) protocol in MANETs for single-performance metric using Analysis of Means (ANOM) and multi-performance metrics using Analysis of Variance (ANOVA). Using Taguchi's Design of Experiment, identifying the main effects of six influential factors (terrain, network size, node speed, pause time, number of sources, and transmission rates) on two performance metrics were examined (Mohamed et al., 2008a). Intended to study and identify the important factors that affect the performance of Destination-Sequenced Distance-Vector (DSDV) routing protocol using Taguchi's Design of Experiments technique with performance metric as Packet delivery ratio. Lee et al. (2008) describes the application of Taguchi approach in investigating the performance of MANETs with respect to packet drop rates on AODV and DSR routing protocols using NS2 Simulator. (Rawat et al., 2015) details a method of considering multiple metrics and different network parameters concurrently to analyze the loss factor of AODV routing protocol. The author used Taguchi’s loss function to evaluate the best parameters giving high throughput, Packet Delivery Ratio (PDR) and low average delay, Drop and routing overhead simultaneously for AODV protocol considering various network parameters - Terrain size, Network size, Number of source nodes, Transmission rate, Mobility speed, Pause time, Transmission range, Queue size, Antenna height, and receiving power (Saxena & Sinha, 2014) incorporates the multi-response analysis of Adaptive Fault Tolerant Replication (AFTR) routing protocol through five performance metrics like throughput, packet delivery ratio, delay, routing overhead, and packet drop using the variation of five factors - network size, transmission rates, mobility speed, optimal number of copies, and pause time.
Reactive (on-demand) routing protocols: Reactive routing protocols are also named as on-demand or source-initiated routing protocols since the nodes do not maintain routing information if there is no communication and a route is established only when a source node wants to transmit data packets to the destination node. The source first checks the availability of a valid route, if it is present, it will transmit accordingly otherwise, it performs a route discovery process by flooding the network with route request packets initially to immediate neighbours to find a path to the destination on-demand (Venkataramana & Shetty, 2014). A route maintenance phase is used when the link breaks and to re-establish the link for the continuous transmission of the data between source and destination.
The major advantage of these routing protocols is that it has relatively less routing overhead as compared to proactive routing protocols. The important disadvantage of it is that the delay observed in route discovery process to send a first data packet (Jhaveri et al., 2010; Chadha & Joon, 2012). Major routing protocols of this category include Ad hoc On Demand Distance Vector (AODV), Dynamic Source Routing (DSR), Dynamic MANET Ondemand (DYMO) routing protocol (Perkins et al., 2001; Taneja & Kush, 2010; Wister et al., 2011).
DYMO (Dynamic MANET On-demand routing protocol) is an on-demand, reactive, multi-hop unicast routing protocol. DYMO consists of two protocol functions: route discovery and route maintenance. On-demand routes are discovered when a node has to send a packet to a destination that is not currently in its routing table. A route request (RREQ) message is flooded via broadcast in the network and when the packet reaches its destination, a reply message containing the discovered accumulated path is sent back. Every node preserves a routing table comprising node information. Sequence number should be kept by each node. When a route request message is delivered by the node, the sequence number is increased every time. This enables other nodes to decide the sequence of discovery messages so as to prevent stale routing information, identify duplicate messages, and guarantee loop freedom. When a route for the destination is unknown or the link is broken, the originator node of the packet is notified. A route error (RERR) packet is sent toward the originator to indicate the existing route to a particular destination is invalid or not reachable. When the originator node receives the RERR, it removes the route. If the source node has to send a packet to the same destination, it is required again to perform route discovery process for that destination (Sharma & Gupta, 2013; Mobile Ad hoc Networks Working, 2006; Rawat et al., 2015; Manohar, 2018).
The important factors selected in DYMO routing protocol are given as follows.
Once a route request (RREQ) has been issued, the source node is waiting for a route to be created to the destination node. If a route is not received in RREQ_WAIT_TIME milliseconds, this node may attempt to find a route again by issuing another RREQ.
In order to evaluate the designs proposed in this paper and to choose the most suitable evaluation methodology, three evaluation methodologies were identified.
The mathematical methodology is highly restrictive which contains assumptions and hypothesis that cannot suit to realistic environments. Researchers would at the most need accuracy for further enhancement of their work and want to conduct their experiments on the real devices, using test beds. But, the experimental methodology is not practicable due to high cost and their lack of flexibility and setup for such networks, experimentation is mostly accomplishable through simulation (Cavin et al., 2002) Simulation is an economical and an easy approach to carryout experiments.
The simulations are helpful to view the simulated outputs match closely to reality (Cavin et al., 2002). By using simulation, a simulator has to undergo a certain level of imprecision. This imprecision has many causes including the impact of granularity, Mobility models, Radio Propagation Models, and Simulation Size (Cavin et al., 2002). A simulator is said to be best if it supports fidelity, dependable and realistic (Hogie et al., 2006). Considering the elements of dependability such as granularity and support for mobility, popularity, open source and available documentation, three simulators were ranked top in the list namely Network Simulator 2 (Ns2), Optimized Network Engineering Tool (OPNET) and Global Mobile Information System Simulator (GLOMOSIM) (Hogie et al., 2006). Among them, NS2 simulator is chosen for its features, advantages, and highly preferred in Networking Research Community.
Network Simulator 2 (NS2) is an object-oriented, discrete event driven network simulator, which is highly reliable within the networking community was developed first at University of California-Berkeley. It supports both wired and wireless environments (Hogie et al., 2006). Ns2 contains two key languages which are C++ and Object-oriented Tool Command Language (OTcl). The purpose of C++ is to define the internal mechanism used as backend of the simulation and the purpose of OTcl is to set up simulation by assembling and configuring the objects as well as scheduling discrete events used as front end. So the combination of these two languages makes it powerful and efficient (Cavin et al., 2002).
This paper identifies the most significant factor of DYMO routing protocol using Taguchi Design of Experiments by considering the effective factors RRWT, RRT, RT with two QoS metrics - Packet Delivery Ratio (PDR), Average Throughput (ATP). The most significant factor along with the optimum level of factors is measured using Taguchi Design of Experiments. Through the simulation run with optimum factors, it is validated that these values are ideal for enhanced performance metrics.
In general, performances of routing protocols are evaluated through simulation. Most of the studies are based on one-factor-at-a-time approach, in which, only one factor is changed, keeping other factors constant. Such technique does not consider the interaction among factors. This strategy of analysis can be enhanced by quantifying the effects of various factors and their interactions on the performance. The statistical Design of Experiment (DoE) can also be used that considers the simultaneous study of effects of several factors rather than one at a time.
Minitab supports four kinds of design approaches, namely factorial designs, response surface designs, mixture designs, and Taguchi designs (also called Taguchi robust designs) (Quality Training Portal (n.d).)
In this paper, DoE using Taguchi Design approach is used. The Taguchi Design Approach (TDA) also known as a robust parameter design was successfully applied in different areas of biological science, engineering and physical science to compare the effects of multiple factors with their interactions (Minitab 17 Support (n.d)) compared to the traditional full factorial Design of Experiments, TDA significantly reduces the number of experiments, and thus accelerates the experimental process (Mohamed et al., 2008b). The Orthogonal Arrays (OAs) and the Signal-to-Noise Ratio (SNR). OA's allow researchers to study many combination factors simultaneously and can be used to estimate the effects of each factor. The SNR is the quality indicator by which one can evaluate the effect of changing a particular factor on the performance of the process. According to the TDA, the SNR is the signal to noise ratio, where signal represents the desired value, and noise represents the undesirable value (Minitab 17 Support (n.d)). The TDA has three types of quality characteristics; lower-the-better (LB), nominal-the-best (NB), and higher-the-better (LB) (Mohamed et al., 2008b).
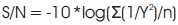
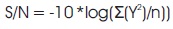
The intention of this study is to maximize the performance metrics Average Throughput and Packet Delivery Ratio and minimize Average End-to-End Delay (AEED), and Routing Overhead (RO). Therefore, SNR quality characteristic Larger-the-better is used for ATP, PDR, and SNR quality characteristic Smaller-the-better is implemented for AEED and RO. The formulation of SNR for Larger-the-better and Smaller-the-better can be written using equations (1) and (2) as (Minitab 18 Support (n.d)),
In TDA, the appropriate Orthogonal Array for the simulation experiment depends on the number of factors and the number of factor levels as shown in Figure 1. The degree of freedom for the orthogonal array should be greater or equal to those for the factors under study.
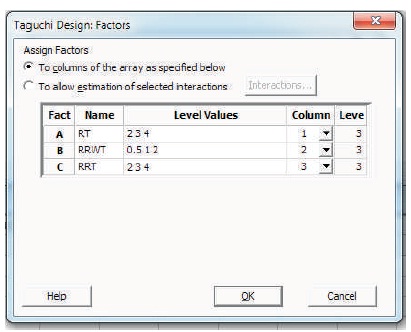
Figure 1. Factors and its Levels
Considering the number of parameters and their levels, an L9 orthogonal array is suitable for the analysis. Hence nine experiments are evaluated. Table 1 shows the experimental design of L9 orthogonal array. Two performance metrics and their experimental results are also shown in Table 1. Each row consists of design point that corresponds to a simulation scenario. Simulations were run using NS2 simulator and results are obtained.
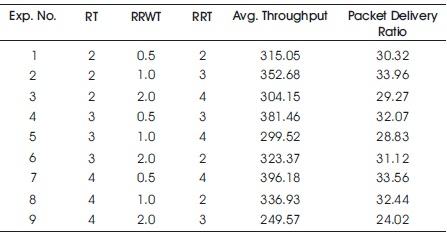
Table 1. L9 Orthogonal Array and Results of Performance Metrics
The results of the experiments are statistically analyzed using Main Effects Plot, Response Table, and validated using Normal probability plot of Residuals, Residual Histogram, Residuals vs. Fits, Residuals vs. Order by MINITAB statistical software.
Main effects plot is used to indicate the effects graphically for each of the response metrics. The main effects plot envisions the performance metric change as the level of the factor is changed. The corresponding low, medium, and high value of a factor is represented along the x-axis and the corresponding performance metric is traced along the y-axis. The two - point connecting line illustrates the average main effect on the performance metric when the level of the factor changed from one level to another. The slope of this line indicates the extent to which a factor mainly affects the metric performance. The larger the slope is the significant average main effect on the metric performance. A small slope shows the average main effect. It is observed that the main effect plots for the range of values used for different factor levels are drawn (Saxena & Sinha, 2012, 2013).
The Response Table consists of an entry for the average signal - to - noise ratio for each factor level, Delta and Rank. The table comprises of a column for each factor.
Delta: The difference between the highest and the least average signal to noise ratios for the factor contained within.
Rank: indicates the rank of each Delta, the largest Delta being Rank 1.
Optimum level: Optimum level indicates the best level of the influencing factor (Minitab 18 Support (n.d)).
This is a tool for investigating general residual properties, including typical values, spread, and shape. A long-tail on one side designates a skewed distribution. If one or two bars are far apart, they may be outliers (Minitab 18 Support (n.d)).
When the residuals are normally distributed, the points in this plot should generally form a straight line. If the points on the plot leave a straight line, the assumption of normality can be invalid (Minitab 18 Support (n.d)).
On both sides of 0, this plot must indicate a random pattern of residuals. If a point lies outside from most points then it can be an outlier. The residual plot must not contain any identifiable patterns. For example, if the distribution of residual values increases with the fitted values, this may disrupt the assumption of constant variance (Minitab 18 Support (n.d)).
This is a plot of all the residuals in order to collect the data and to find non-random errors, in particular time - related effects. This plot helps one to check if the residuals are uncorrelated to each other (Minitab 18 Support (n.d)).
The experiments designed using Orthogonal Array of Taguchi approach is conducted on UBUNTU OS 12.04 LTS with NS2 (Network Simulator 2) for the performance evaluation. The performance analysis is observed with three factors, namely RRWT, RRT, and RT. All the factors considered are with three levels. The simulator parameters and their values are shown in Table 2.
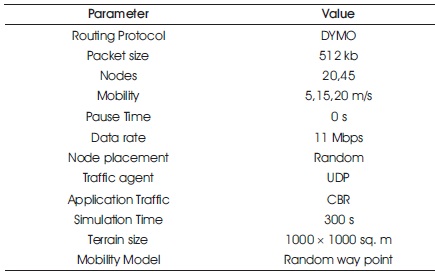
Table 2. Parameter Setting for Simulation Process
It is defined as the average number of packets successfully received from the source node to destination node in a simulation amount of time. It is measured in bits per second using the formula.
Average Throughput = Σ(number of packets successfully received / total duration of simulation)*(8/1000)
Figure 2 illustrates the Main effects plot by varying the levels of factors - RRWT, RRT, and RT, the Average Throughput is affected. The response table for Signal to Noise ratio with quality characteristic Larger the better is shown in Table 3. It is found that RRWT is the most important. Average Throughput is slightly affected by RRT and RT factors. The Optimum level of the factors for Average Throughput is RT –3, RRWT – 0.5, and RRT – 4.
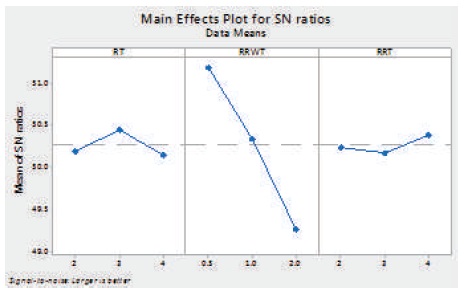
Figure 2. Main Effects
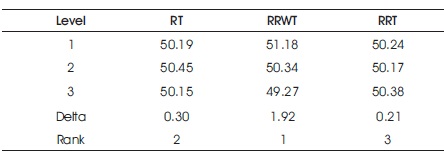
Table 3. Response Table for Signal to Noise Ratios - Larger is Better
Figure 3 illustrates the normal probability plot of the residuals and also displays the residuals versus their expected values when the distribution is normal. Here, the normal probability plot of the residuals follows approximately close to a straight line.
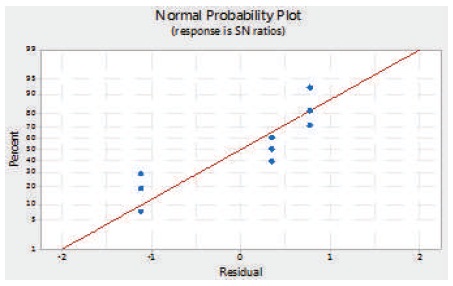
Figure 3. Normal Probability Plot of Residuals for SN Ratios
Figure 4 illustrates Histogram of the residuals is used to determine whether the data are skewed or include outliers. A long tail in one direction indicates Skewness. A bar that is far away from the other bars indicates an outlier. Here, an outlier is partially identified.
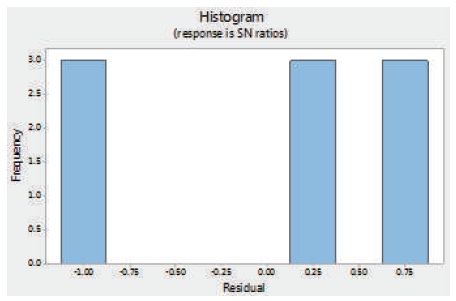
Figure 4. Residual Histogram for SN Ratios
Figure 5 illustrates the residuals versus fits graph plots, where the residuals on the y-axis and the fitted values on the x-axis. The Residuals versus fits plot is used to verify the assumption that the residuals are randomly distributed and have constant variance. Here, the points fall randomly on both sides of 0, with no recognizable patterns in the points.
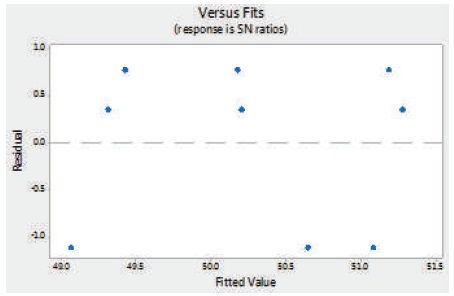
Figure 5. Residuals vs. Fits for SN Ratios
Figure 6 illustrates the residuals versus order plot and displays the residuals in the order that the data were collected. The residuals versus order plot are used to verify the assumption that the residuals are independent from one another. Here, the residuals on the plot fall randomly around the center line.
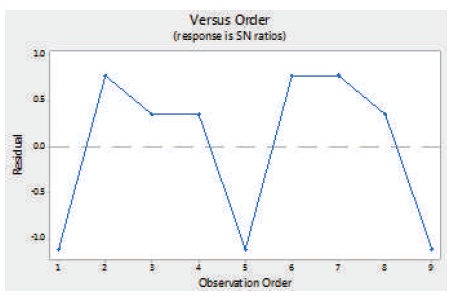
Figure 6. Residuals vs. Order for SN Ratios
The RRWT is the most vital factor for average throughput. RRT and RT are insignificant factors.
It is defined as the percentage of the total number of packets received against the total number of packets sent.
Packet Delivery Ratio=Σ(total packets received)/ Σ(total packets sent)*100
Figure 7 illustrates the Main effects plot by changing the levels of factors - RRWT, RRT, and RT, where the Packet Delivery Ratio is affected. The response table for Signal to Noise ratio with quality characteristic Larger the better is shown in Table 4. It is found that RRWT is most significant. Packet Delivery Ratio is slightly affected by RRT and RT factors. The Optimum level of the factors for Average Throughput is RT –2, RRWT – 0.5, and RRT – 2.
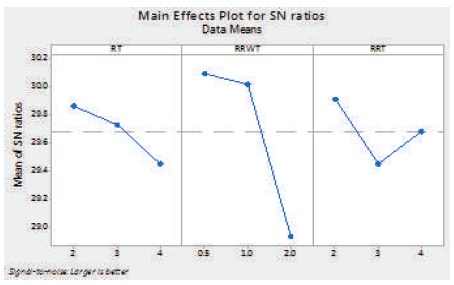
Figure 7. Main Effects Plot
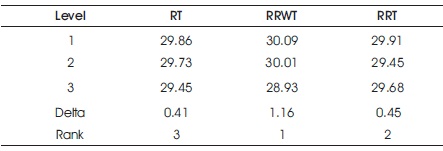
Table 4. Response Table for Signal to Noise Ratios - Larger is Better
Figure 8 illustrates the normal probability plot of the residuals and displays the residuals versus their expected values when the distribution is normal. Here, the normal probability plot of the residuals follows approximately close to a straight line.
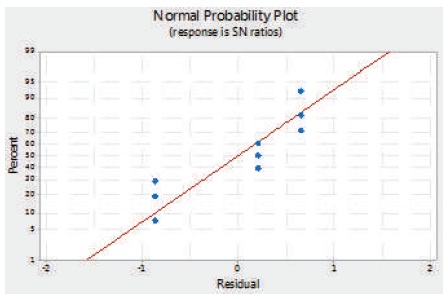
Figure 8. Normal Probability Plot of Residuals for SN Ratios
Figure 9 illustrates Histogram of the residuals is used to determine whether the data are skewed or include outliers. A long tail in one direction indicates Skewness. A bar that is far away from the other bars indicates an outlier. Here, an outlier is partially identified.
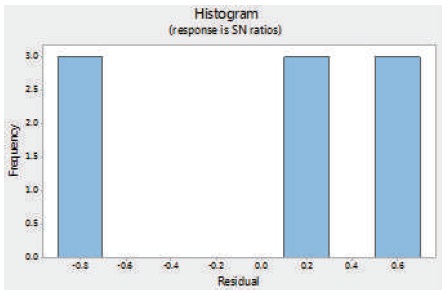
Figure 9. Residual Histogram for SN Ratios
Figure 10 illustrates the residuals versus order plot and displays the residuals in the order that the data were collected. The residuals versus order plot are used to verify the assumption that the residuals are independent from one another. Here, the residuals on the plot fall randomly around the center line.
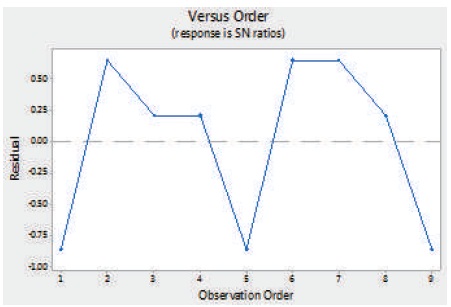
Figure 10. Residuals vs Order for SN Ratios
Figure 11 illustrates the residuals versus fits graph plots the residuals on the y-axis and the fitted values on the x-axis. The Residuals versus fits plot is used to verify the assumption that the residuals are randomly distributed and have constant variance. Here, the points fall randomly on both sides of 0, with no recognizable patterns in the points.
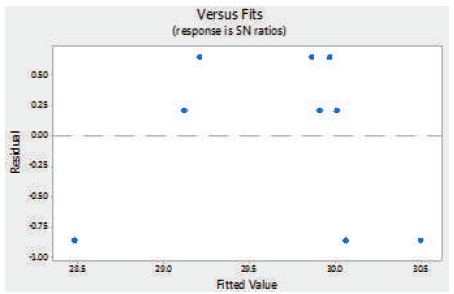
Figure 11. Residuals vs Fits for SN Ratios
The RRWT is the most significant factor for packet delivery ratio. RRT and RT are insignificant factors.
This paper implements Taguchi Design of Experiments approach to improve the QoS performance of DYMO routing protocol in MANETs for smaller network sizes by selecting most significant factor among RRWT, RRT, RT and its appropriate levels. Two quality metrics - Average Throughput and Packet Delivery Ratio are used. The experiments are run on NS2 simulator and the results are analyzed through Statistical tool Minitab using Main Effects plot, Response table for SNR, and validated using Normal probability plot of Residuals, Residual Histogram, Residuals vs. Fits, Residuals vs. Order.
The optimal level of significant factors for all metrics is verified experimentally and found the best outcome. From the results considering Average Throughput and Packet Delivery Ratio, it is observed that RRWT outperforms when compared to RRT and RT for small and medium networks. It is found that Route Request Wait Time (RRWT) is the most significant factor among the other factors. So, RRWT factor is identified to enhance the performance of QoS metrics of DYMO routing protocol with small and medium network sizes and fine tuning of RRWT using soft computing techniques is selected as the future scope of work.