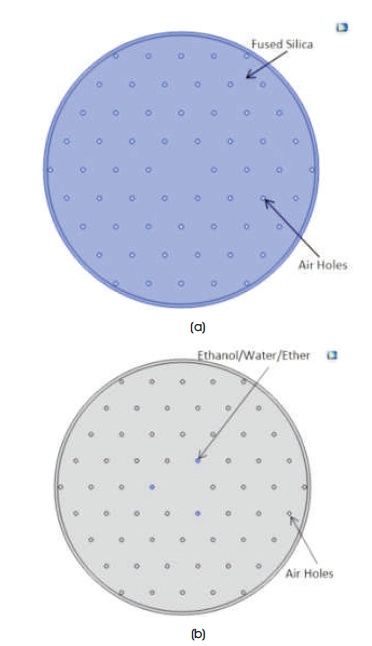
Figure 1. Proposed Hexagonal PCF Structures showing (a) Fused Silica Material and Air Holes (b) Doped Liquids
A comparative analysis of different parameters of a hexagonal photonic crystal fiber doped with some other liquid materials, whose refractive indices are lower than the refractive index of the actual core, has been proposed in this paper. Circular air holes are placed in four hexagonal shaped rings. Three holes from the innermost ring are filled not only with air, but also with water, ethanol, and ether to demonstrate the overall analysis of confinement loss, dispersion, and effective area. Finite Element Method is used in the software known as COMSOL Multiphysics for the calculation of effective refractive indices, while the calculation of confinement loss, dispersion and effective area, and the comparison graphs have been plotted in MATLAB. The photonic crystal fibers doped with some specific liquid can also be used for the calculation of sensitivity of that particular liquid or can be used as liquid sensors. It has been observed that the effective refractive indices and the confinement loss not only vary by changing the wavelength, but also by varying the structural parameters like pitch length and diameter of air holes. For this research work, the Perfectly Matched Layer was kept constant and the responses were calculated between diameter of holes, confinement loss, dispersion, effective area, and wavelengths.
Photonic crystal fibers, the emerging technical substitute of the existing ordinary optical fibers are showing a center of attraction for new researchers in the field of optical communication due to its unique properties, such as flexible dispersion, birefringence, effective area, confinement loss, etc. (Joshi et al., 2017a; Liang et al., 2015; Joannopoulos et al., 2011). The easiest photonic crystal fibers to understand are those that employ index guiding. They guide light by virtue of the smaller average refractive index of the cladding relative to the core (Joshi et al., 2017b). Dispersion is the property which can be useful in dispersion compensation fiber (Musin & Zheltikov, 2008; Liang et al., 2011; Chen et al., 2014). The parameter Perfectly Matched Layer (PML) is kept constant throughout the process (Joshi et al., 2017a, 2017b). It is an improvement in design of conventional optical fiber used for high frequency communication, where in order to achieve a good quality of communication, one always improves the technical aspects like multiplexing, photonic receivers, etc., rather than the optical fiber. One of the primary applications of index-guiding photonic crystal fibers has been to enhance the strength of nonlinear optical effects. Nonlinear phenomena in fibers are due to Kerr Effect, in which the index varies in proportion to the intensity of the field. Just because of this effect, one can perform super continuum generation also (Joannopoulos et al., 2011). Now the photonic crystal fibers or holey fibers are one kind of improvement in this field for its novel features as stated above (Akowuah et al., 2012). Previous researches show the properties of general air hole photonic crystal fibers (Joshi et al., 2017a), but this paper will demonstrate the behavior of only Hexagonal photonic crystal fiber selectively filled with some specific liquids, whose refractive indices are less than the refractive index of fused silica – the material which is used to fabricate the core of the optical fiber. Some of the air holes were replaced by water, ethanol, and ether and the behavior of the PCFs were examined, which can be used for designing of optical sensors (Jensen et al., 2003). The effective area and dispersion (Hossain & Maniruzzaman, 2014) have also been calculated.
The two values of dispersion show two different properties, the positive explains the anomalous behavior and the negative one defines the normal, which make the PCF as dispersion flexible (Kumar et al., 2015). Razzak and Namihira (2008) have proposed for highly nonlinear dispersion of flattened octagonal photonic crystal fibers. Previous researches explain that the octagonal PCFs show much better responses than the other non-octagonal PCFs in terms of confinement loss, dispersion, effective area, etc. (Joshi et al., 2017a), but in this work, Hexagonal PCF structure is simulated which is filled not only with air, but also with other liquid, materials with refractive indices less than the refractive index of the core material are used to fill some of the air holes in the PCF for all the structures. These liquids are water (refractive index (n) = 1.333), ethanol (refractive index (n) = 1.361), diethyl ether (refractive index (n) = 1.3526) considering the atmospheric temperature, humidity, and pressure constant. We cannot use these liquids in a massive amount because it will result in the turning of core to cladding. Another reason to choose such liquids is for sensing applications. Arif et al. (2016) have proposed high sensitive PCF based chemical sensor for ethanol detection. H-PCF shows quite narrower effective area than D-PCF (Razzak et al., 2007).
The analysis of various parameters has been done on Hexagonal PCF (H-PCF). The structure has four concentric rings in Hexagon shape, in which circular air holes are placed, hence the name H-PCF. The PCF structure was designed in COMSOL Multiphysics. Figure 1 shows the HPCF structures showing the fused silica material (a) and the holes filled with selected liquids, i.e. ethanol, ether, and water. Accordingly to calculate the confinement loss, effective area, dispersion, etc., the PML is kept constant, whereas the other parameters like pitch length (⋀), diameter of holes (d), and wavelength (λ) are variable, whose responses are explained further.
Figure 1. Proposed Hexagonal PCF Structures showing (a) Fused Silica Material and Air Holes (b) Doped Liquids
In homogenous media, Phase change per unit length is calculated by using refractive index. The same role plays the Effective Refractive Index (ηeff) in case of waveguide transmission or optical transmission (in Optical Fibers). The property of this is that it does not depend only upon the wavelength of light, but also the mode of the optical signal by which it travels. Effective refractive index has two parts: real part (Re(ηeff)) for dispersion and effective area calculations and imaginary part (Im(ηeff)) for the confinement loss calculation.
Various types of losses occur in photonic crystal fiber similar to the ordinary optical fibers due to different reasons like bending, structural imperfection, etc. One of the kinds of loss is known as confinement loss, which is due to the poor confinement of electric field present in optical signal. Actually Confinement means, how an optical signal is traveling coherently along the axis of waveguide. This can be calculated by using the imaginary part of the effective index (ηeff) (Chen et al., 2014) using the following equation.
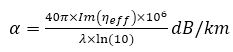
where α is the confinement loss in dB/km, Im(ηeff) is the imaginary part of effective index, and λ is wavelength.
Dispersion(D) is the broadening of an optical pulse during transmission. In case of photonic crystal fiber, the dispersion parameter can be calculated by the equation given below:
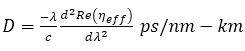
where Re(ηeff) is real part of effective index, and c is speed of light in vacuum.
The lateral area, over which the electric field of fundamental mode is confined during its propagation in optical link is known as effective area (Aeff) and can be calculated by the equation given below:
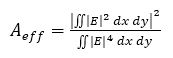
where, E is the normalized electric field in the medium which can be obtained in frequency domain analysis.
The maximum part of the electric field of the propagating wave is concentrated at the center is known as the confinement of Electric field, which is shown below for the proposed structure.
Since the electric field confinement figures do not show large amount of difference, the structure filled with water has been displayed below in Figure 2 (d). The difference between the confinement of the electric fields with (d) and without (b) doping of other liquids can be easily observed. Figure 2 (e) shows the meshing in H-PCF. Mesh generator generates finer mesh to show more details.
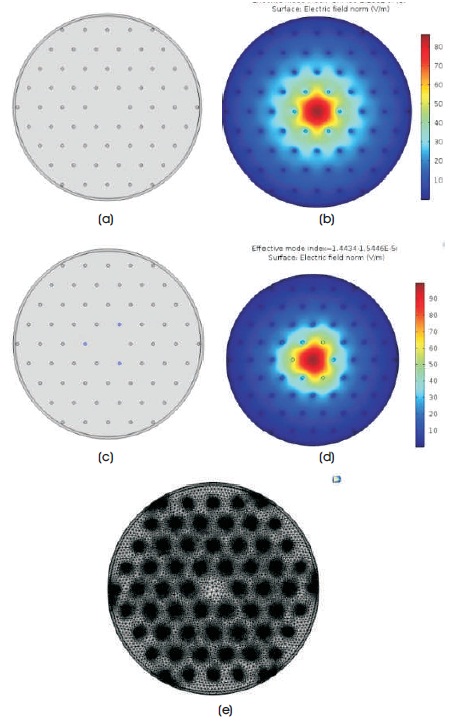
Figure 2. Geometry and E-Field Patterns (a & b) H-PCF without Doping, ( c & d) H-PCF with Doping, (e) Meshing in Hexagonal PCF
Figure 3 shows the variation in real part of effective index with variable pitch length (⋀= 3-4 μm), for 4 rings H-PCF with 3 holes of the innermost ring are filled with air, water, ethanol, and ether, respectively. It can be observed that all the results show exponentially increasing curves where the air filled PCF has lowest value. Water and ethanol give quite similar real values to the variation in pitch length.
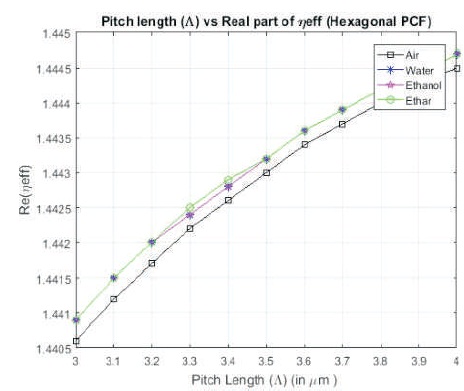
Figure 3. Pitch Length vs. Real Part of Effective Index for H-PCF
Figure 4 shows the variation in confinement loss with variable pitch length (⋀ = 3-4 μm), for 4 rings H-PCF with 3 holes of the innermost ring are filled with air, water, ethanol, and ether, respectively. It can easily be observed that the ether filled structure shows the lowest confinement loss as compared to other materials.
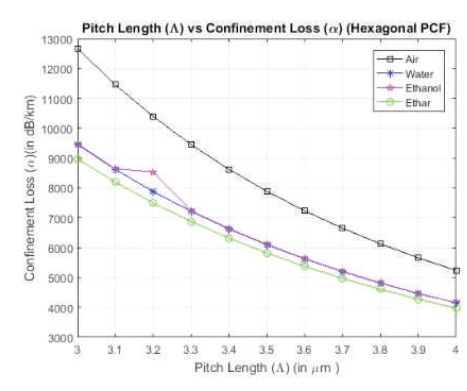
Figure 4. Pitch Length vs. Confinement Loss Characteristics for H-PCF
Figure 5 shows the variation in Real part of effective index with respect to change in diameter of holes inscribed in PCF (d = 0.55 μm - 0.95 μm), for the given structure filled with air, water, ethanol, and ether, respectively. The air fill structure shows the lowest real values as compared to other liquids.
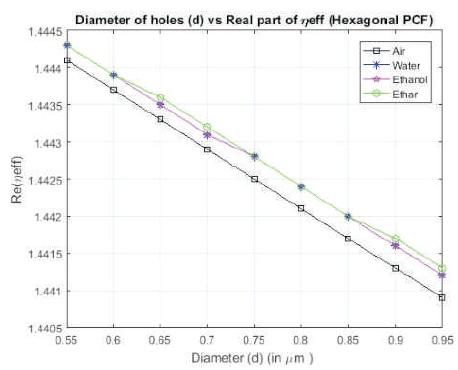
Figure 5. Diameter of Holes vs. Real Part of Effective Index for H-PCF
Figure 6 shows the variation in confinement loss with change in diameter of holes inscribed in PCF (d = 0.55 μm - 0.95 μm), for the same structure filled with air, water, ethanol, and ether, respectively. The result shows a large difference between the air filled structure and the ether filled structure. Ether doped PCF shows the lowest confinement loss values.
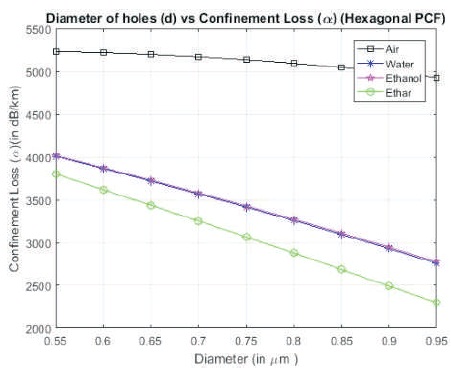
Figure 6. Diameter of Holes vs. Confinement Loss for H-PCF
Figure 7 shows the variation in Real part of effective index with respect to change in wavelength (λ = 1.32-1.55 μm), for 4 rings H-PCF with 3 holes of the innermost ring are filled with air, water, ethanol, and ether, respectively. It can be observed that air filled structure gives the lowest real values.
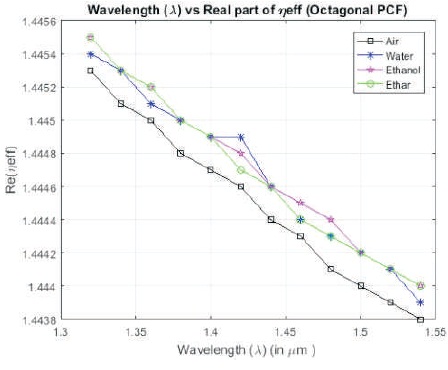
Figure 7. Wavelength vs. Real part of Effective Index for H-PCF
Figure 8 shows the variation in confinement loss for given H-PCF with 3 holes of the innermost ring, filled with air, water, ethanol, and ether, respectively. The confinement loss is calculated by using the imaginary part of the effective index obtained after the simulations to equation (1). It can be observed that only water filled H-PCF gives quite stable response between wavelengths 1.35 μm and 1.55 μm range, but ether and ethanol filled PCFs give more unstable responses.

Figure 8. Wavelength vs. Confinement Loss Characteristics for H-PCF
Figure 9 shows the dispersion curves plotted with respect to the variation in wavelength (λ = 1.32-1.55 μm) for the proposed PCF structure, which is calculated by the second order differential of the real part of effective refractive index with respect to the wavelength (equation (2)). It can be observed that the water filled Hexagonal PCF structure shows the lowest dispersion, whereas the ether filled structure shows the highest dispersion as compared to other materials.
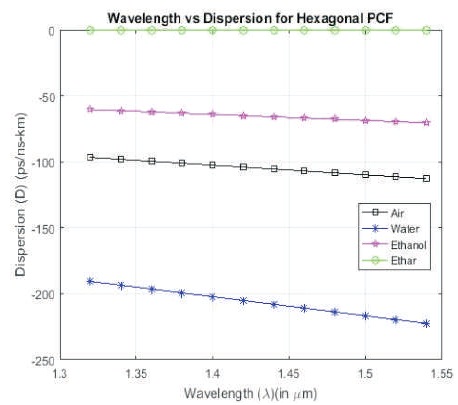
Figure 9. Wavelength vs. Dispersion Characteristics for H-PCF
Figure 10 shows the variation in effective area for the proposed PCF structure filled with air, water, ethanol, and ether, respectively. The effective area (Aeff) is calculated by equation (3), by obtaining the normalized Electric field value after a frequency domain analysis. It can easily be observed that the ether doped structure shows the lowest effective area between the 1.35 μm - 1.4 μm, and another lower value in 1.55 μm window, while the maximum effective area is shown by the water doped structure.
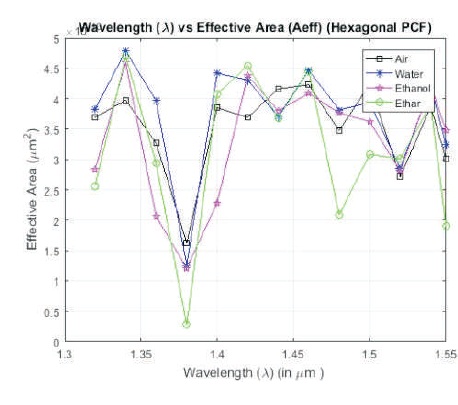
Figure 10. Effective Area for Different Materials for H-PCF
After a lot of simulations on the proposed structure for the selected liquids, it is clear that real part of effective index increases on increasing pitch length, but decreases on increasing diameter of hole or wavelength. Confinement loss decreases on increasing pitch length or diameter of holes, but increases on increasing the wavelength. Since the second order derivatives are calculated with respect to wavelength, the dispersion characteristics were drawn with respect to wavelength and water filled Hexagonal PCF has lowest value. The effective area has lowest value at 1.35 - 1.4 μm window for ether filled structure.
The author is thankful to the supervisor and the colleagues for their extraordinary guidance, help and support during the research work, both in simulation or the preparation of paper.