(1)
Orthogonal Frequency Division Multiplexing (OFDM) is a wireless transmission technique in which the digital data are transmitted in a radio environment at a very high speed. But one of the major drawbacks of OFDM system is, high peak to average power ratio which demands costly linear amplifiers with wide dynamic range. In this paper, less-complexity based partial transmit sequence technique is used for reducing the PAPR of OFDM system. PTS techniques can improve the PAPR statistics of an OFDM signals, but the computational complexity is a potential problem for the implementation in practical systems. Inorder to reduce this computational complexity, an optimization algorithm can be used. This paper shows the comparison between two population-based stochastic search techniques which is widely used in many scientific and engineering fields. Here, the Differential Evolutionary (DE) algorithm is compared with the Genetic Algorithm (GA).
Orthogonal frequency division multiplexing schemes have been used extremely in digital data transmission [1], such as digital video/audio broadcasting, digital subscriber line and so on. Benefits regarding wireless communication includes resistance to RF interference, and robustness against multipath fading. Still, there are some challenging issues related with the OFDM system. The high PAPR forces the High Power Amplifier (HPA) to operate in a non-linear region. Many PAPR reducing technique have already been proposed such as clipping, block coding, scrambling, selective mapping [10], partial transmit sequence [9] , [11], etc. These techniques achieve PAPR reduction at the expense of the transmit signal power increase, Bit Error Rate (BER) increase, data rate loss, computational complexity increase, and so on [12]. The conventional PTS scheme is an efficient and a distortion less phase optimization technique for the PAPR reduction by optimally combining the signal sub-blocks [10]. In this scheme, an input data block is divided into number of sub-blocks and each sub-block gets multiplied with the optimal phase factor. Subsequently, the sub-blocks are added to form the OFDM symbol for transmission. This technique improves the PAPR performance but unfortunately, it requires an exhaustive search from all combinations from all allowed phase weight factors [1]. Inorder to reduce this searching complexity, stochastic search techniques have been recently introduced. Some of them are, Simulated Annealing (SA) [15], Cross-Entropy (CE) [14], Genetic Algorithm (GA) [13], Particle Swarm Optimization (PSO) [8], and Differential Evolutionary (DE) [2]. The main objective of this paper is to reduce the peak to average power ratio [5] of OFDM system by using the PAPR reduction technique. PTS technique gives the better result as compared to other techniques. But there is a major setback of PTS technique, which is the computational complexity in searching phase factor. Inorder to reduce this problem, an optimization algorithm is used. Here, the differential evolutionary algorithm is compared with the genetic algorithm. DE algorithm was proposed by Prince and Stron. As compared with GA, the DE does not require any encoding procedure as used in the GA.
The rest of paper is arranged as follows. Section 1 provides the system model used for the OFDM signal. Section 2 gives the comparison between the two evolutionary algorithms. Section 3 shows results and discussion. Finally, the paper is concluded in the last section.
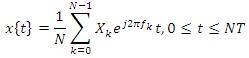
A block of N data symbols X = {Xk, k=0,1,...., N-1} is k parallelly transmitted. In the conventional OFDM system, an IFFT is usually implemented to modulate the multiple sub-band signals within an OFDM symbol. OFDM signal is represented as,
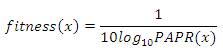
where, Xk is the data symbol of kth subcarrier. PAPR is defined as,
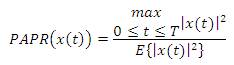
where, max |x(t)|2 is the maximum value of OFDM signal and E{.} is an expectation of OFDM signal. In order to evaluate the PAPR reduction, the Complementary Cumulative Distribution Function (CCDF) of PAPR is employed [3].
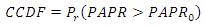
This expression shows the probability that the PAPR of a symbol exceeds the threshold level PAPR0.
In PTS technique, an input data is partitioned into a number of sub-blocks. The sub-carriers in each sub-block are weighted by a phase weighting factor. The phase weighting factors are selected such that the PAPR of the combined signal is minimized [1].
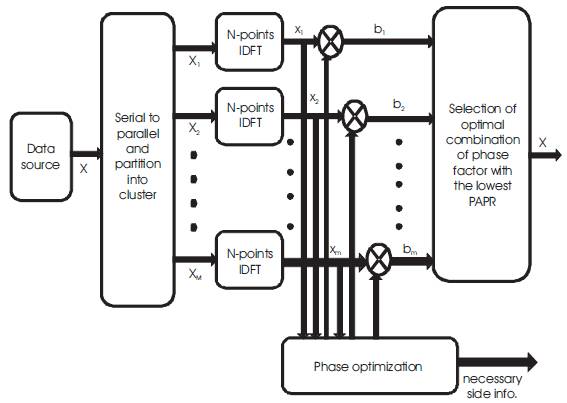
Figure 1. Block Diagram of PTS Technique
Figure1 shows the block diagram of the PTS technique. An Input data block is given as, vector X = [X1 , X2 ,....XN ]T . Then, X is divided into M disjoint sub-block such that,

Then, the weighted sum combination of M sub-blocks could be written as,
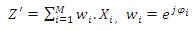
where, wi , i = 1,2,......M is the phase weighting factor. After transforming to the time domain, the vector becomes,

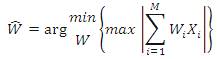
where, z denotes the candidate sequence. The objective is the optimal combination of M sub-blocks to obtain the time domain of the DM signals with lowest PAPR. The best phase factor is expressed as,

The two major problems which should be resolved in PTS are, high computational load in searching for the phase factors and the overhead of the optimal phase factors as side information needing to be transmitted to receiver for the correct decoding of the transmitted data [3].
The DE algorithm is a population-based stochastic parallel direct search technique for the global optimization problem [4]. DE uses the differential information of individuals in the current population of solutions to create new candidate solutions. The use of a few control parameters and the fast convergence are the main advantages of DE in finding the optimal points of problems.
The algorithm steps are given below,
Algorithm 1:
Initialize population(); evaluate fitness value
While termination criteria are not satisfied do
Mutation ( );
Crossover ( );
Selection ( );
End while
The general scheme for the DE algorithm is shown above, which consists of four main procedures: 'initialization', 'mutation operator', 'crossover operator' and 'selection operator'.
Parameters are chosen by the user such as population size, mutation factor, crossover rate, boundary constraints and the stopping criterion of iterations (generation).
Selection of an initial population is appropriately done for the evolutionary algorithm. These initial values are chosen randomly within the boundary constraints. The selection range is about [0, 2π]. According p to the DE, let us assume that the aim is to minimize the cost function F(w) with respect to vector of parameters w = [w1 ,w2 ,....wi ]. Here, the new generation are produced by mutation, crossover, and selection operators to the current set of candidate solutions. F(W) objective function defined as the amount of PAPR reduction can be expressed as,
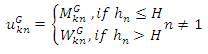
In this process, for each individual solution a mutant vector MGk is generated by,
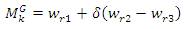
Where, r1, r2 and r3 ∈ 1, 2… K are selected randomly and they are different. δ is the mutation factor.
Crossover is applied between the primary and secondary
parent to produce offspring,  .
To ensure that the offspring is different from the primary
parent, the offspring inherits at least one component from
the secondary parent [2]. Thus MGk
= uGk and rest of the
component is given by,
.
To ensure that the offspring is different from the primary
parent, the offspring inherits at least one component from
the secondary parent [2]. Thus MGk
= uGk and rest of the
component is given by,
where, n =1, 2, ... , N, hn is a random number uniformly distributed within [0, 1] and H ∈ (0,1) is a predefined crossover probability.
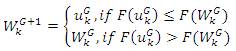
During selection, the offspring uk, competes with the initial solution candidates Wk. If offspring is fittest with respect to the cost function, it replaces Wk with the next generation (G+1) that is,
Step 6: Repeat the steps 3-5 for G = G + 1 until the maximum number of iteration is hold.
Genetic algorithms are a stochastic search method introduced in the 1970s in the United States by John Holland and in Germany by Ingo Rechenberg. Based on the simplifications of natural evolutionary processes, the genetic algorithms operate on a population of solutions rather than a single solution and employ heuristics such as selection, crossover, and mutation to evolve better solutions [7].
Considering the number of population size as N, and then initialize the algorithm parameter randomly. Here, an initial population is considered as 30 [6].
Evaluate the values of the fitness function corresponding to each chromosome.
Loop (until the maximum generation).
Select the best chromosome of the population in terms of their fitness and perform the roulette wheel for selection.
For i=1 to population size
Generate random number Si.
If (Gi > crossover probability)
th Select ith chromosome for crossover.
End if
End for
Perform the crossover operation on selected chromosome of the population.
For i=1 to maximum population size
If (Gi > mutation probability)
Select ith chromosome for mutation.
End if
End for
Perform the mutation operation on selected chromosome of the population.
Choose chromosome for the next generation and find the optimal solution and if criteria is achieved, terminate the loop, otherwise move to step 2 of the algorithm.
END
In this simulation, all experiments are performed in MATLAB 7.10.0(R2010a). Here, the configuration parameter of DEPTS is shown in Table 1 and Table 2 shows the configuration parameter of GA-PTS. QPSK modulation employed with the number of sub-carrier is about 128. The 128 subcarrier were divided into four sub-blocks and the 1000 OFDM blocks were chosen randomly.
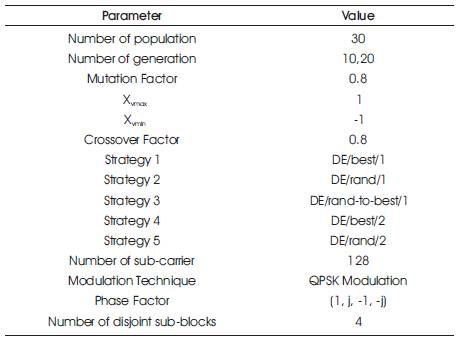
Table 1. The Parameters of DE-PTS
Table 2 shows the parameters of differential evolutionary algorithm. Here, the mutation factor is lying between 0 & 1, so we have taken 0.8 and crossover factor also lies between 0 & 1 so, 0.8 is taken to perform the simulation. And the maximum and minimum boundary are given by Xvmax =1 & Xvmin =-1.
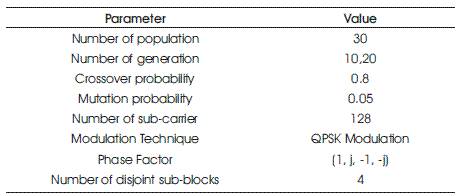
Table 2. The Parameters of GA-PTS
And to perform the mutation there are five strategies: DE/best/1, DE/rand/1, DE/rand-to-best/1, DE/best/2, and DE/rand/2. Figure 2 shows the PAPR performance of each strategy. The PAPR of strategy 1 (DE/best/1) is 7.296 dB, strategy 2 is 6.873 dB, strategy 3 is 7.004 dB, strategy 4 is 7.077 dB and strategy 5 is 7.15 dB.
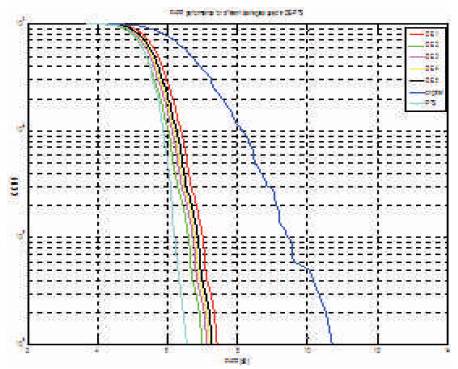
Figure 2. PAPR Performance for Different Strategies used in DE-PTS
After initializing all the strategies, it is concluded that the strategy 2 performs better when compare to others. In order to perform all simulation, strategy 2 is used.
The configuration parameter of GA-PTS is shown in Table 2. The crossover probability is usually selected between 0.1 and 1 and the probability of the mutation is usually between 1 and 2 tenths of a percent. So here, the crossover probability is about 0.8 and the mutation probability about 0.05 is selected.
Figure 3 shows the graph of PAPR Vs. CCDF performance of the QPSK- OFDM system based on the PTS technique of PAPR reduction with DE and GA, when the population size is 30 and the number of generation is 20. Figure 4 shows the zoom- in –view of Figure 3. It is observed that, when CCDF=0.001, then the DE-PTS is about 6.726 dB and the GA-PTS is about 7.006 dB.
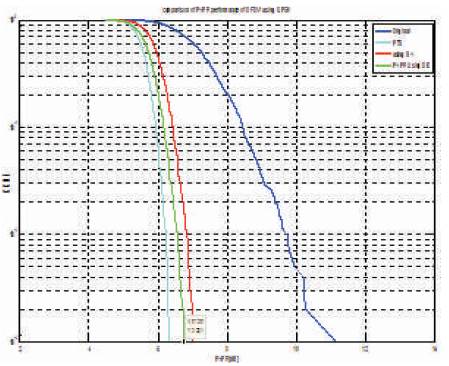
Figure 3. PAPR Vs. CCDF Performance of QPSK-OFDM System based on PTS Technique of PAPR Reduction with Optimization Algorithm (Population Size=30, No.of Generation =20)
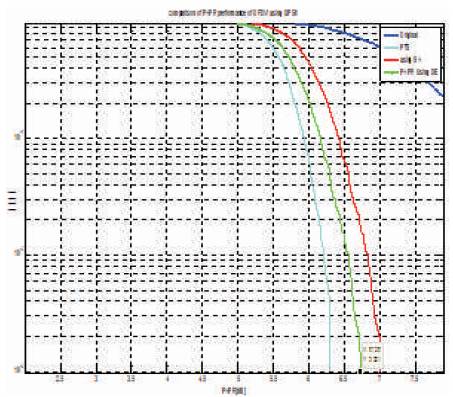
Figure 4. Zoom- in- view of Figure 3
Figure 5 shows the graph of PAPR Vs. CCDF performance of the QPSK- OFDM system based on the PTS technique of PAPR reduction with DE and GA, when the population size is 30 and the number of generation is 10. Figure 6 shows the zoom- in –view of Figure 5. It is observed that, when CCDF=0.001, then the DE-PTS is about 6.75 dB and the GA-PTS is about 7.041 dB.
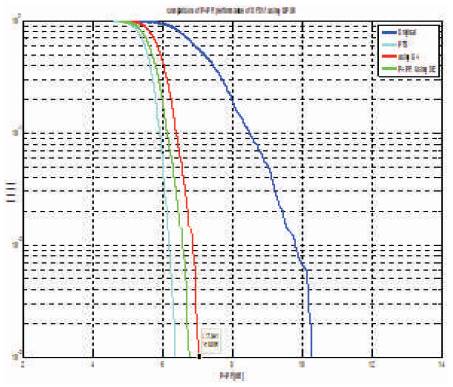
Figure 5. PAPR Vs. CCDF Performance of QPSK-OFDM System based on PTS Technique of PAPR Reduction with Optimization Algorithm (Population Size=30, No.of Generation =10)
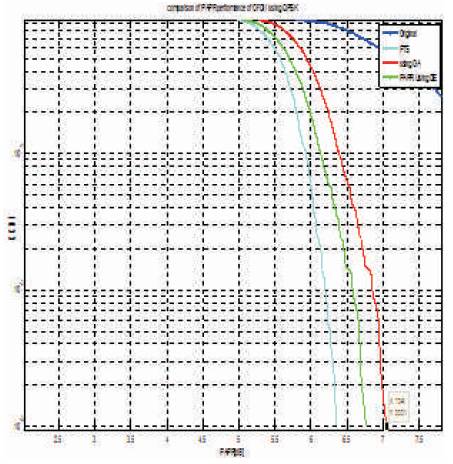
Figure 6. Zoom- in- view of Figure 5
Table 3 shows the comparison between DE-PTS and GAPTS.
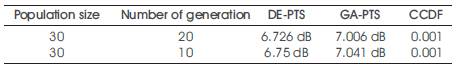
Table 3. Comparison between DE-PTS and GA-PTS
After analyzing the PAPR performance of the QPSK/OFDM system based on PTS technique with DE-PTS and GA-PTS, when the population size is of 30 and the number of generation is about 10, 20, the DE-PTS performs better than the GA-PTS at increasing the number of generations.
The PAPR have been analyzed, all of which have the potentiality to provide the substantial reduction in PAPR at the number of iterations increase, and BER performance improvement, computational complexity reduction and so on. The simulation results show that the DE-PTS method obtains the desirable PAPR reduction with the low computational complexity as compared with the GA-PTS techniques. Besides, the DE-PTS is more suitable for highdata- The PAPR have been analyzed, all of which have the potentiality to provide the substantial reduction in PAPR at the number of iterations increase, and BER performance improvement, computational complexity reduction and so on. The simulation results show that the DE-PTS method obtains the desirable PAPR reduction with the low computational complexity as compared with the GA-PTS techniques. Besides, the DE-PTS is more suitable for high-data rate, multi-carrier transmission systems because the computational complexity reduction ratio is increased with an increasing number of sub-carriers.
This optimization technique can be applied in PTS to search the optimum phase factor with reduced searching complexity and hopefully it can provide the OFDM signal with reduced PAPR. Recently, the multiuser OFDM became popular due to its applicability to highspeed wireless multiple access communication systems.