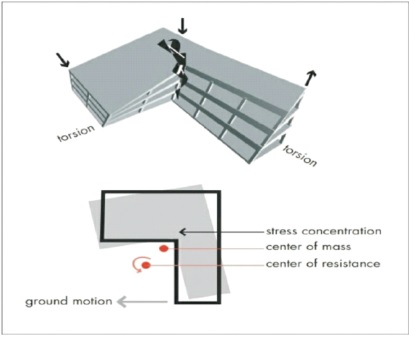
Figure 1. Problems Induced by the Building with Re-entrant Corners (Federal Emergency Management Agency, 2006)
Irregular configuration and multi-storey buildings are becoming necessary to accomplish one of the basic requirements of growing population. Nevertheless, the irregular configuration of the buildings poses design challenges when subjected to earthquake. Study of former seismic actions has disclosed that plan irregular buildings exposes to critical damage due to immoderate torsion and stress accumulation. This paper presents a performance study on high-rise RC building with reentrant corner, which is a form of plan irregularity, in high seismic zone by varying the plan aspect ratio. Four buildings of Lshape, Plus-shape, I-shape and T-shape with 30 stories are analyzed by carrying out pushover analysis using ETABS17 software. Parameters such as ductility ratio, displacement, storey drift, base shear and stiffness are considered for the performance evaluation. In this paper a detailed study of the ductility ratio has been made and it can be concluded that the I-shape building is more ductile compared to all the other shape buildings.
Presently, majority of the structures are entailed with an architectural prominence and it is eminently not feasible to develop regular profiled buildings (Sakale et al., 2014). “The earthquake, in a sense doesn't kill the people but the buildings do” (Sreenivas & Mathew, 2016). Shape and geometry of the building affects the performance on top of effect of seismic forces acting on it (Jereen et al., 2016). So, choice of the plan configuration of building enacts a remarkable mantle in the structural design for inhibiting seismic motion.
A building with non-uniform plan configuration undergoes intense damages due to excessive stress or force during seismic action (Raheem et al., 2018). One such form plan irregularity is the appearance of re-entrant corners where both the protrusions of the building beyond the re-entrant corner are above 15% of its plan dimension in the given orientation (Bureau of Indian Standard, 2016). These reentrant corners result in local stress accumulation due to differential motions between distinct extensions and creates torsion because of non-concurrence of the centre of mass and centre of rigidity geometrically which is represented in the Figure 1. Building Plans with re-entrant corner forms are a most useful set of building shapes for urban sites, particularly for residential apartments and hotels, which enable large plan areas to be accommodated in relatively compact form, yet still provide a high percentage of perimeter rooms with access to air and light (Divyashree & Siddappa, 2014).
Figure 1. Problems Induced by the Building with Re-entrant Corners (Federal Emergency Management Agency, 2006)
Ductility is technically defined as the ability to withstand cyclic deformations. Flexibility and stiffness are measurements of how far an element will deflect under given force, whereas ductility is more about how the element will deflect, especially at yielding and beyond. In short, a ductile structure is expected to bend and not break, which greatly reduces the risk of a catastrophic failure. The present study deals with the performance evaluation of high-rise RC building with varying plan aspect ratio in high seismic zone particularly with respect to global ductility of the building.
Some of the studies on the seismic behavior of RC building with re-entrant corner plan irregularity are summarized below. Amarloo and Emami (2019) offered a unique approach to study the irregularity of structure by presenting a three dimensional view for inter storey drift, ductility and destruction conveyance in non-uniform configuration RC buildings appraising seismic direction impacts. A considerable increase (20%-60%) in the responses has been remarked which relied upon response interpretation, earthquake direction, planar orientation and vertical transmission.
Jereen et al. (2016) evaluated the seismic functioning of buildings with plan irregularity by considering E, H, plus and swastika shape plan configuration. The swastika shape performed better compared to the other models due to its structural symmetry along both the axis. This study suggested that in case of irregular plan buildings, semi-rigid diaphragm must be considered.
Raheem et al. (2018) researched the effects of plan irregularity on seismic response insistence of L-shaped moment resisting frame buildings. The outcomes of this study proved that high irregularity buildings are more exposed to damage due to stress concentration and lateral torsional buckling behavior compared to the regular buildings.
Sakale et al. (2014) compared the seismic behavior of buildings having horizontal irregularity provided with and without shear walls. In zone IV and V, the buildings considered exceeded the permissible limits of drift and displacement largely and required shear wall throughout the height.
Sreenivas and Mathew (2016) analyzed the seismic functioning of re-entrant corner buildings with base isolator. The performance of plus shaped building has been better compared to the other two buildings due to plan symmetry. The incorporation of isolation techniques has been found to be significant in decreasing the base shear, storey drift and storey acceleration.
Divyashree and Siddappa (2014) investigated seismic functioning of RC building with re-entrant corners and vitalizing using ETABS software. Buildings retrofitted with shear wall and bracing at re-entrant corner of all storeys showed an improvement in base shear carrying capacity of 75% and 110% respectively while those retrofitted at ground level only showed an improvement in base shear carrying capacity of 31% and 22% respectively.
The aims of this study are as follows.
In this study, RC building with re-entrant corners of L-shape, Plus-shape, I-shape and T-shape with varying plan aspect ratio of 1:1, 1:2, 1:3 and 1:4 has been considered (Bureau of Indian Standard, 2017). ETABS 17 software has been employed for modeling and analysis. The structural details are indexed in Table 1.
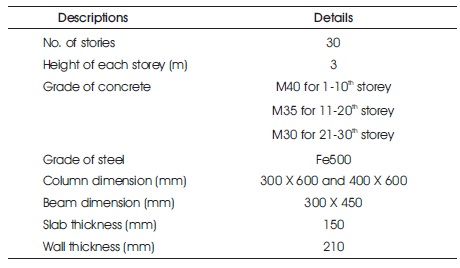
Table 1. Structural Details
Self-weight of the structural members considered on the basis of IS: 875 (Part 1) (Bureau of Indian Standard, 1987a). Since the building presumed as commercial, the live load on the floor has been taken as 5 kN/m2 as stated in IS: 875 (Part 2) (Bureau of Indian Standard, 1987b). Floor finish is taken as 2 kN/m. The wall load is 10.8 kN/m. The building is presumed to situate in seismic zone IV as per IS 1893 (Part 1) (Bureau of Indian Standard, 2016) and the earthquake factors considered are shown in Table 2.
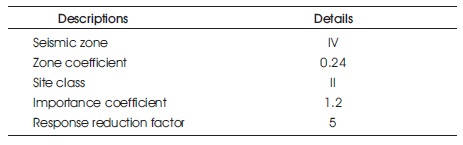
Table 2. Seismic Details
ETABS 17 software is used to create the models. Total sixteen models of L-shape, plus-shape, I-shape and T-shape with varying plan aspect ratio from 1:1 to 1:4 has been developed for the performance study. The plan configurations of the building models are represented in the Figure 2 to Figure 5. The plan of L-shape is given in Figure 2, plus shape in Figure 3, I-shape in Figure 4, and T-shape in Figure 5.
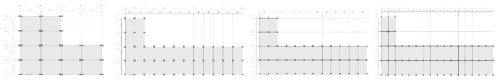
Figure 2. Plan of L Shape Building with 1:1 to 1:4 Aspect Ratio Respectively
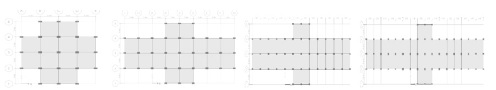
Figure 3. Plan of Plus Shape Building with 1:1 to 1:4 Aspect Ratio Accordingly
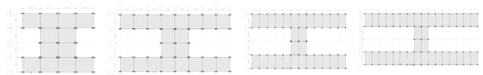
Figure 4. Plan of I Shape Building with 1:1 to 1:4 Aspect Ratio Respectively
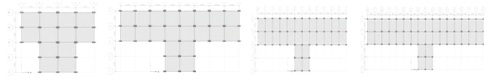
Figure 5. Plan of T Shape Building with 1:1 to 1:4 Aspect Ratio Accordingly
Analysis has been carried out using pushover analysis by capacity spectrum method in both X and Y direction (Applied Technology Council, 1996). This method lowers the elastic spectrum to cross the capacity curve in spectral co-ordinates to find a performance point. Results from the analysis are described in following parameters.
Ductility is the ability of structures to acquire great amount of lateral deformation along the height. It is defined in terms of ratio of maximum deformation ∆_max that can be sustained by the building just prior to failure to the yield deformation . Hence, a ductile building has greater ∆y inelastic deformation capacity without significant loss of strength (Amarloo & Emami, 2019). Results of ductility ratio are noted in the following Table 3.
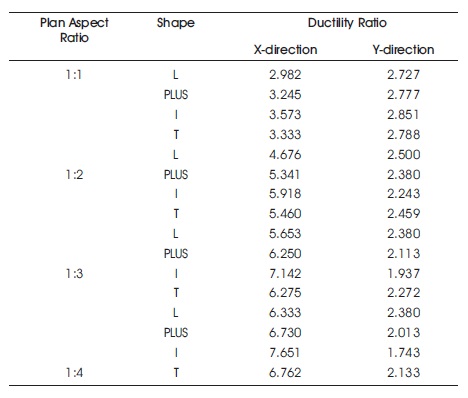
Table 3. Global Ductility Ratio
Ductility ratio of I shape building with 1:1 aspect ratio in Xdirection= ∆_max/∆y = 360/100.756 = 3.573.
From Table 3 it can be observed that as the plan aspect ratio increases, value of ductility is increased in X- direction, but in Y-direction it is vice-versa.
From Figure 6 it is noticed that as the plan aspect ratio increases, value of joint displacement also increases.
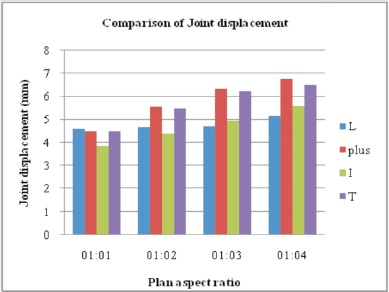
Figure 6. Comparison of Joint Displacement
Drift can be described as the lateral displacement of one floor comparative to another floor above or below. Drift value should be controlled to limit destruction to structural elements.
Observations of storey drift values from all shapes of buildings are as follows.
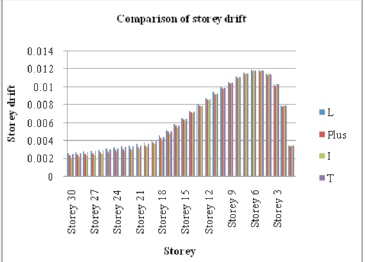
Figure 7. Comparison of Storey Drift with Respect to 1:1 Plan Aspect Ratio
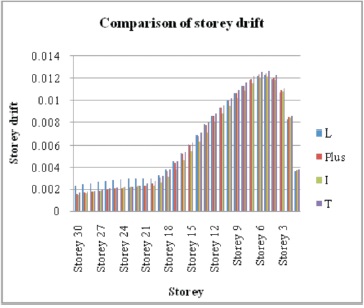
Figure 8. Comparison of Storey Drift of Buildings with 1:2 Aspect Ratio
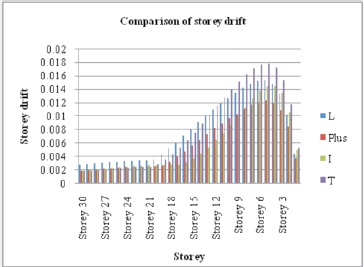
Figure 9. Comparison of Storey Drift of Buildings with 1:3 Plan Aspect Ratio
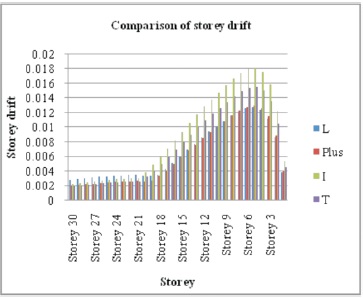
Figure 10. Comparison of Storey Drift with Respect to 1:4 Plan Aspect Ratio
Pushover curve obtained from the pushover analysis is displayed in the Figures 11 to 18 which illustrates the nonlinear characteristics of the buildings considered. The comparison of pushover curves with aspect ratios 1:1, 1:2, 1:3, and 1:4 in X-direction is shown in Figure 11, 13, 15 and 17 respectively. The comparison of pushover curves with aspect ratios 1:1, 1:2, 1:3, and 1:4 in Y-direction is shown in Figure 12, 14, 16 and 18 respectively.
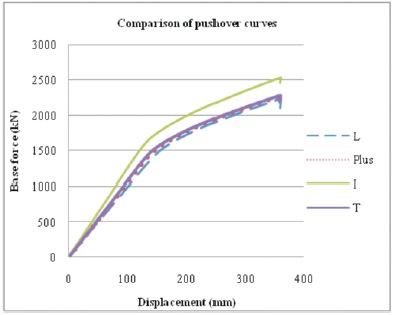
Figure 11. Comparison of Pushover Curves of Buildings with 1:1 Plan Aspect Ratio in X-direction
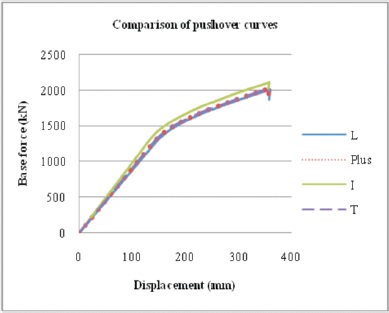
Figure 12. Comparison of Pushover Curves of Buildings with 1:1 Plan Aspect Ratio in Y-direction
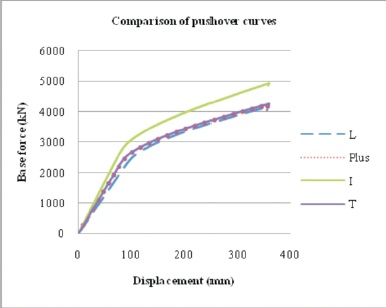
Figure 13. Comparison of Pushover Curves of Buildings with 1:2 Aspect Ratio in X-direction
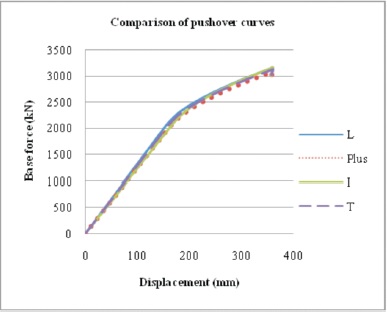
Figure 14. Comparison of Pushover Curves of Buildings with 1:2 Aspect Ratio in Y- Direction
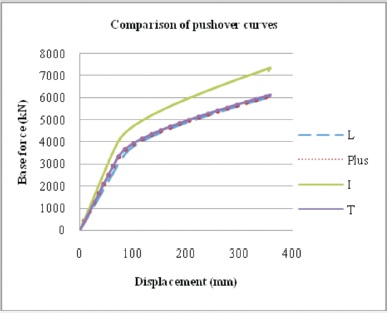
Figure 15. Comparison of Pushover Curves of Buildings with 1:3 Aspect Ratio in X-direction
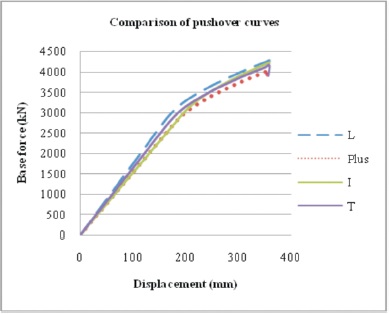
Figure 16. Comparison of Pushover Curves of Buildings with 1:3 Aspect Ratio in Y-direction
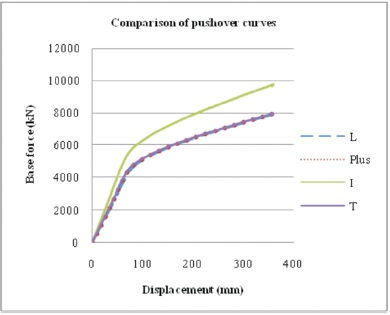
Figure 17. Comparison of Pushover Curves of Buildings with 1:4 Plan Aspect Ratio in X-direction
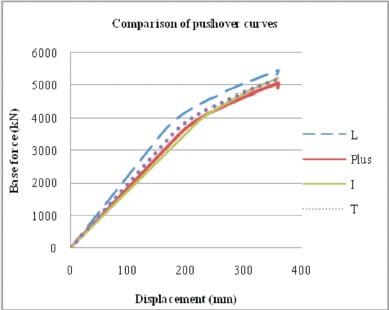
Figure 18. Comparison of Pushover Curves of Buildings with 1:4 Plan Aspect Ratio in Y-direction
Base shear can be explained as the value of absolute horizontal lateral load at the bottom of the building.
Figure 19 shows the comparison of base shear and the observations from the Figure 19 is as follows.
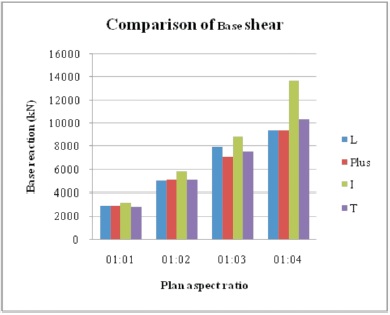
Figure 19. Plot of Base Reaction Versus Plan Aspect Ratio
Figures 20 and 21 shows the comparison of stiffness in Xdirection and Y-direction respectively. It is perceived that as the plan aspect ratio increases, stiffness value of the building also increases.
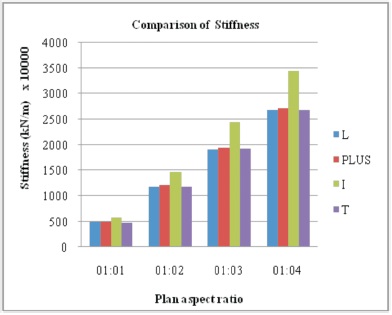
Figure 20. Comparison of Stiffness in X- direction
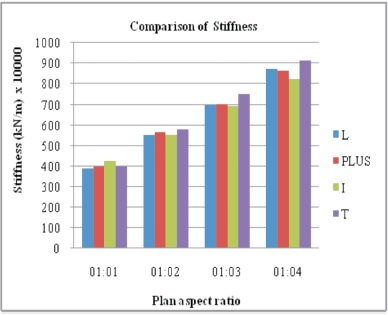
Figure 21. Comparison of Stiffness in Y-direction
In the present project, based on the results obtained following conclusions can be drawn,
The property which enables structure to withstand severe earthquake is ductility. By enhancing ductility in structure by optimum design and by studying the buildings by performance-based analysis, the design seismic forces can be reduced, and more ductile structure can be obtained.