The principle objective of this paper is to study the structural behavior of High-Rise RC structure for different plan configurations, such as rectangular building along with Plus, C, L, and H-shape in accordance with the seismic provisions suggested in IS: 1893-2002 using ETABS. The analysis involves load calculation manually and analyzing the whole structure on the ETABS 9.7.1 version for dynamic analysis, i.e. Response Spectrum Analysis and Time History Analysis confirming to Indian Standard Code of Practice. For time history analysis, past earthquake ground motion record is taken to study response of all the structures. Analysis is carried out for seismic zone IV by taking medium soil condition. After the analysis, various responses like maximum storey displacement, maximum storey drift, storey shear, and maximum overturning moment are plotted so as to match the results of the linear and non-linear dynamic analysis.
Earthquakes are most unpredictable and devastating of all-natural disasters. Earthquakes have the potential for inflicting the best damages among all the natural hazards. Since earthquake forces are random in nature and unpredictable, they cause severe destruction in human casualties, however it even has an incredible economic impact on the affected places. The priority regarding seismal hazards is to increase awareness and demand for structure designed to face seismal forces (Ashvin et al., 2015).
High-Rise RC structures are a special class of structures with their own peculiar characteristics and requirements. These structures are often occupied by a large number of people. Thus, their damage, loss of functionality, or collapse can have ver y severe and adverse consequences on the life and on the economy of the affected regions (Chopra, 2012).
In the modern era, most of the structures are delineated irregularly us in both plan and vertical configurations. Moreover, to analyse or design such irregular structures, high level of effort is needed. In other words, damages or loss in those structures with irregular options are over those with regular one. Thus, irregular structures should be analysed carefully to succeed in an acceptable behavior throughout a devastating earthquake. In most of the situations, the shape of the plot for the construction of a structure may not be a regular one. Thus, the shape of the structure may be influenced by the plot configurations. Further it will be interesting to study the stability of buildings with different geometry of shape and their behavior against seismic and other forces.
The following are the objectives of the present study.
Seismic analysis may be a major tool in earthquake engineering that is employed for the determination of seismal responses of the structure. Seismal analysis will be performed on the premise of external action, behavior of the structure or structural materials, and also the style of structure model designated (Nair & Akshara, 2017). Based on the type of external action and behavior of structure, the analysis can be classified as,
Response Spectrum Analysis is a dynamic-linear method in which maximum structural response is plotted as a function of structural period for a given time-history record and level of damping. In this method, the peak response of structure during an earthquake is obtained directly from the earthquake response, but this is quite accurate for structural design applications. The response spectrum technique is really a simplified special case of modal analysis. The advantage of Response Spectrum Analysis with respect to static methods is that higher modes can be considered (Duggal, 2011).
Time History Analysis is an important technique for structural seismic analysis, especially when the evaluated structural response is nonlinear. To perform such an analysis, a representative time history is required for the structure being evaluated. Time History Analysis involves the stepwise solution in the time domain of the multi-degree-of-freedom equations of motion which represent the actual response of a building. It is the most sophisticated analysis method available to a structural engineer. Its solution is a direct function of the earthquake ground motion selected as an input parameter for a specific building (Duggal, 2011).
Stefano and Pintucchi (2008) have presented a review of research on seismic behaviour of irregular building structures since 2002. In this paper, they have mainly focused on three areas like the results of plan-irregularity by that of single-storey and multi-storey building models, passive management as a method to mitigate torsional effects, using base isolation and alternative kinds of devices, and vertically irregular structures and reverse buildings.
Alavi and Rao (2013) have presented a paper on behaviour of the structure in high seismic zone. In this paper, they have investigated a 5 storey-high building on eight completely different configurations having re-entrant corners with an everyday configuration that served as a comparison. They found buildings with severe irregularity are more vulnerable than those with less irregularity particularly in high unstable zones.
Philip and Elavenil (2017) have presented a paper on 'Seismic analysis of high rise buildings with plan irregularity'. In this paper it has been concluded that story displacements increase linearly with height of the building; most story shear force was ascertained between ground floor and second floor for normal structure and at ground floor for irregular structure and also the width decreases linearly with height; story stiffness varies non - linearly for each structures with most values at ground floor.
Poonam and Gupta (2012) have presented a paper on 'Study of response of structurally irregular building frames to seismic excitations'. In this paper, they have found that the mass and stiffness criteria of the IS code leads to moderate increase in response quantities of irregular structures compared to regular structures.
Mishra et al. (2012) have presented a paper on various possible structural configurations and their corresponding seismic performance. This paper they mainly specializes in advantages and drawbacks of different configurations. They have analysed the behaviour of structures of various shapes. This paper provides an insight in understanding the contribution of structural layout to overall unstable resistance of the structural system.
Ashvin et al. (2015) have presented a paper on 'Effect of irregularities in Buildings and their consequences'. In this paper they have analysed the performance analysis of RC (Reinforced Concrete) Buildings with irregularity. Structural irregularities are necessary factors that decrease the seismic performance of the structures.
Modelling means the formation of structural body in the structure software and assigning the loads to the members as per loading consideration. Here each High-Rise RC structures having G+15 storey are selected to model in ETABS 2016 software.
The structure is 24 m in x-direction and 24 m in y-direction with columns spaced at 4 m from center to center. The storey height is kept as 3 m. Basically the model consists of multiple bay ten storey building, each bay having width of 4 m. The storey height between two floors is 3.0 m (Agrawal & Khedikar, 2018a, 2018b).
The material properties and geometry of the model are described below:
Length X width : 24 m x 24 m
Number of stories : G+15
Support conditions : Fixed
Storey height : 3 m
Grade of concrete : M30
Grade of steel : Fe415
Size of columns : 500 mm x 500 mm
Size of beams : 300 mm x 500 mm
Slab thickness : 150 mm
Height of parapet wall : 1 m
Thickness of main wall : 230 mm
Thickness of parapet wall : 115 mm
Density of Concrete : ϒ'c = 25 KN/m3
Density of Brick wall : ϒ'brick = 20 KN/m3
The structures are acted upon by different loads, such as Dead Load (DL), Live load, and Earthquake Load (EL) (Agrawal & Khedikar, 2018).
(i) Wall Load: weight unit of brick masonry x thickness 3 of wall x height of the wall = 20 KN/m x 0.23 m x 3 m = 13.8 KN/m (acting on the beam)
(ii) Parapet Wall Load: weight unit of brick masonry x 3 thickness of wall x height of the wall = 20 KN/m x 0.115 m x 1 m = 2.3 KN/m (acting on the peripheral top beam)
Seismic zone : IV (z = 0.24)
Soil type : Medium soil
Importance factor : 1
Response reduction factor : 5 (SMRF)
Damping : 5%
In this structural analysis study, the authors have adopted five different cases depending on the frame type of the building as follows:
Case 1 : Rectangular-shape Plan
Case 2 : Plus-shape Plan
Case 3 : C-shape Plan
Case 4 : L-shape Plan
Case 5 : H-shape Plan
Seismic analysis is carried out by the help of ETABS and the results of maximum story displacement, maximum story drift, story shear and maximum overturning moment were computed each for all cases. For determining the most stable structure among all modes that we have studied, graphs have been drawn for different shapes.
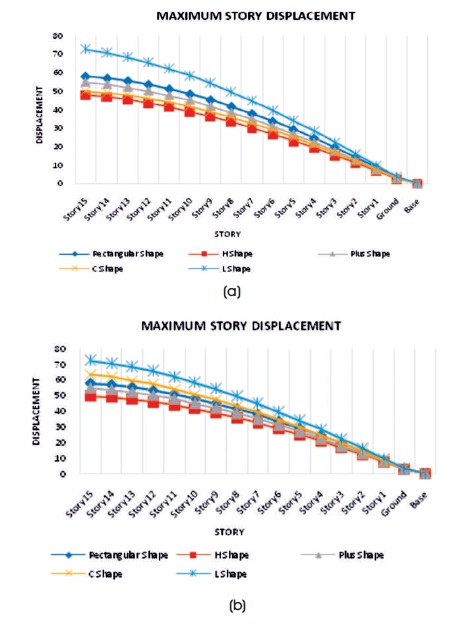
Figure 1 shows that story displacement increases with the increase in story height. According to Codal provision, maximum or permissible story displacement should be equal to or less than 0.4% of total building height. Hence here the maximum permissible story displacement = ((0.4 / 100) x 48000) = 192 mm. Displacement in rectangular and H shape building is less compared to other shape of the building.
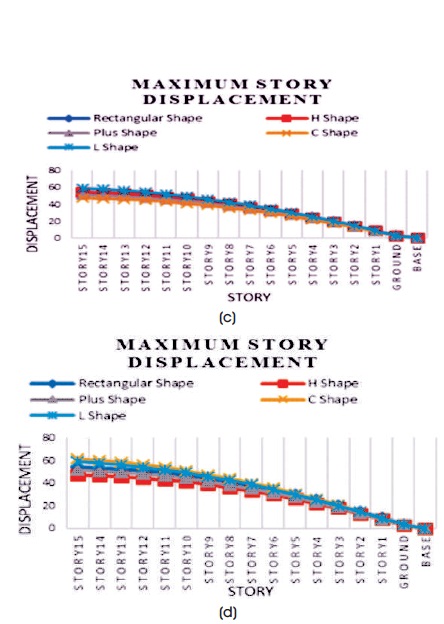
Figure 1. (a) Maximum Story Displacement by RSA in X-Direction, (b) Maximum Story Displacement by RSA in Y-Direction, (c) Maximum Story Displacement by THA in X-Direction, (d) Maximum Story Displacement by THA in Y-Direction
Figure 2 shows the variation of story drift between different floor of all cases. Story drift is the drift of one level of a multistory building relative to the level below. Here the story drift varies in a similar manner for all configurations. The maximum story drift permitted is 0.004 times the story height, i.e. 0.004 x 3000 = 12 mm for all story. Drift in rectangular shape building is less compared to other shape of the building.
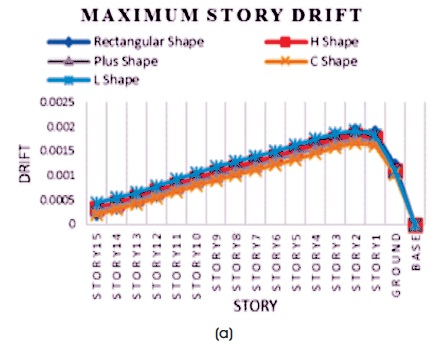
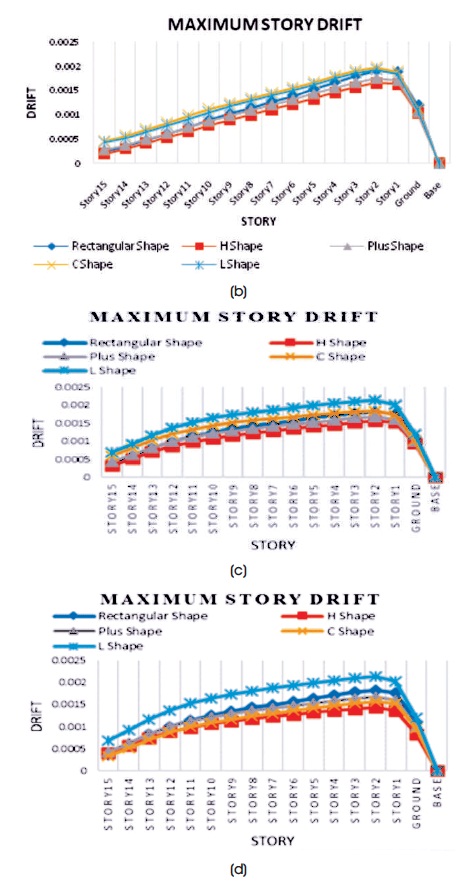
Figure 2. (a) Maximum Story Drift by RSA in X-Direction, (b) Maximum Story Drift by RSA in Y-Direction, (c) Maximum Story Drift by THA in X-Direction, (d) Maximum Story Drift by THA in Y-Direction
Figure 3 shows the Base Shear for all story for different shapes of the building. Story shear is a force that acts on any story in a direction perpendicular to its extension and is measured in 'KN'. It has been concluded that the story shear tends to decrease with the increase in height of the story. For all the structures it is highest at bottom and it decreases linearly towards top. Plus and L shape building has less story shear compared to other shapes of the building.
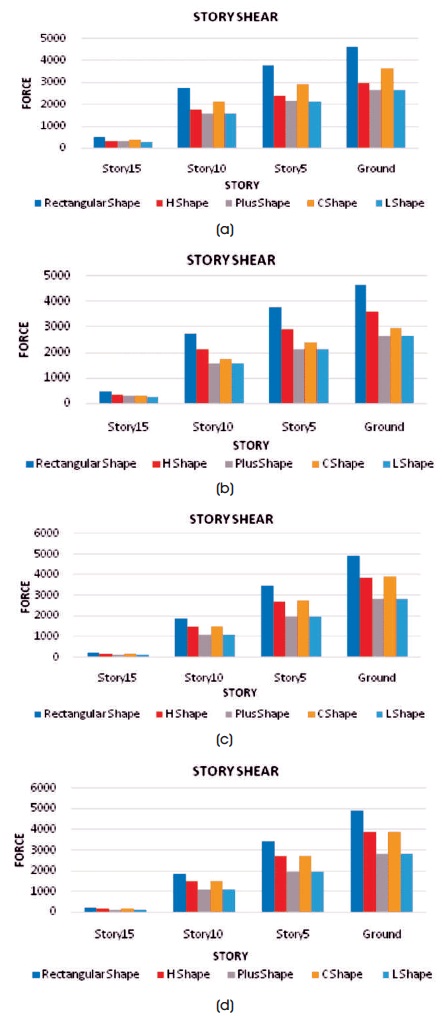
Figure 3. (a) Story Shear by RSA in X-Direction, (b) Story Shear by RSA in Y-Direction, (c) Story Shear by THA in X-Direction, (d) Story Shear by THA in Y-Direction
Figure 4 shows that story overturning moment varies reciprocally with the story height. Story overturning moment of a building is that the instant of energy capable of displacing the story, which is the purpose wherever the story has been subjected to enough disturbances that it ceases to be stable, it overturns, capsizes, collapses, topples and eventually the structure fails. Story overturning moment decreases with increase tall of the story for all cases.
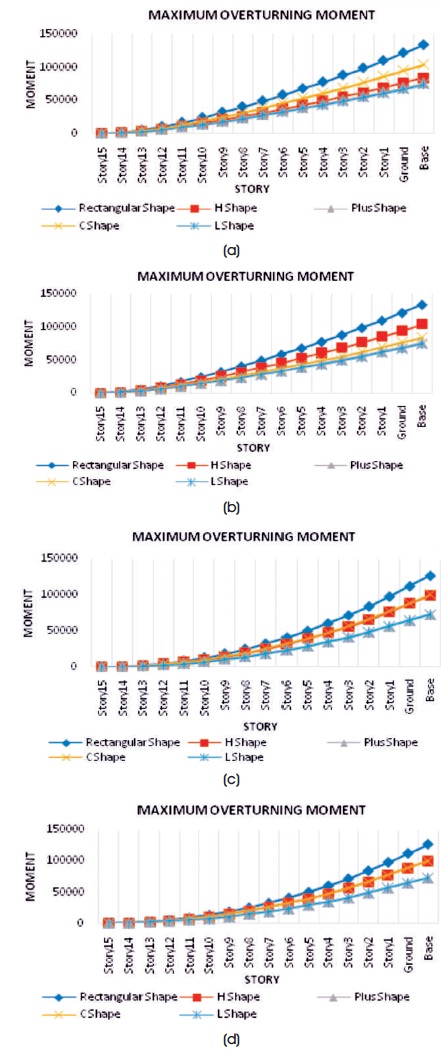
Figure 4. (a) Maximum Overturning Moment by RSA in X-Direction, (b) Maximum Overturning Moment by RSA in Y-Direction, (c) Maximum Overturning Moment by THA in X-Direction, (d) Maximum Overturning Moment by THA in Y-Direction
The analysis proves that irregularities are harmful for the structures and it is necessary to possess easier and regular shapes of frames and also as uniform load distribution a round the building. Therefore, every irregularities in every building should be avoided. But if irregularities were introduced for any reason, they need to be designed properly taking care of their dynamic behaviour.
From the results it is concluded that Time History Analysis ought to be performed because it predicts the structural response more accurately than the Response Spectrum Analysis. For dynamic analysis, Time History Analysis is best suited compared to Response Spectrum Analysis.
On the basis of the analytical results of the study, the following conclusions were drawn:
It is with a feeling of great pleasure that I would like to express my most sincere heartfelt gratitude to my guide, Prof. Amey R. Khedikar for his encouragement, advice, mentoring and research support throughout my studies. His technical and editorial advice was essential for the completion of this dissertation. We extend our heartfelt thanks to our worthy faculty.