(1)
To perform the seismic assessment of reinforced concrete structures, the initial stage is to develop the seismic fragility function and use it to construct the fragility curve to determine the probability of failure of structures during earthquake. The Reinforced concrete structural wall with increase in number of stories is considered under simulated earthquake loading to establish the Peak Ground Acceleration (PGA)-based seismic fragility functions. Time history analysis method is used for developing the seismic fragility function and curves of low to mid-rise Reinforced Concrete (RC) structural walls. Time history method is also used to safeguard the safety of the RC structure from the damages due to earthquake. Time history analysis of the building or structure is done using ETABS software. A MATLAB code is used to plot the fragility curve for four damage states. As the earthquake causes huge damage to the reinforced concrete buildings or structures, it is essential to analyze and study the behavior of the building structure, whether it resists the damages caused to the structure due to shaking of the ground.
Fragility Function is defined as the conditional probability of the structure to exceed certain level of the damage state due to earthquake forces or seismic excitations which acts on the building structure during earthquake. Fragility function is very essential component for evaluating the potential of severity of the consequences due to earthquakes. Researchers and other scholars use fragility function to evaluate the seismic performance of the structure.
The RC structural model is subjected to the increasing ground motion intensity until the structure becomes dynamically unstable. The minimum ground motion intensity at which the structural model exceeds the certain level of the damage state is used to obtain the seismic fragility curves for RC structural walls.
Intensity Measure (IM) is defined as the curve plotted using ground motion parameter versus the probability of the RC structure exceeding certain performance level. The two types of IM are:
For the structural seismic performance assessment of the RC structure, the most commonly used instrumental IMs by researchers are Peak Ground Velocity (PGV), Spectral displacement (Sd) and Spectral acceleration (Sa), Peak Ground Acceleration (PGA). The empirical IMs are defined as discrete numerical seismic intensity scales which is derived from the qualitative assessments of damage.
The performance levels of any structure for seismic vulnerability assessment are derived on the basis of four structural damage states signifying the threshold levels of structural damage experienced by RC structures when it is subjected to ground shaking due to earthquake waves.
According to the methodology used to construct fragility curves, we can classify fragility function as empirical, analytical, expert opinion based, and hybrid. An empirical fragility function is considered as the realistic approach and approximates damage data for fitting the fragility curve. The analytical fragility function is derived from the analysis of structural model at increasing seismic intensity and damage states of the structure is also estimated. Expert opinion based fragility function depends on the judgment of the experienced experts who judge or guess the failure probability of structure. The hybrid fragility function is constructed using various methodologies for damage prediction when there is a shortage of required observed data and approximation in structural analysis.
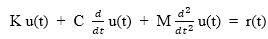
Time history analysis method is used for the structural analysis of reinforced concrete framed building structures. The dynamic response of the structure under earthquake loading is evaluated using linear or non-linear time history analysis method (Chopra, 1995). Dynamic equilibrium equations which is mathematically represented as the function of time given by,
where, K is stiffness, C is damping, M is mass, u(t) is displacement function, and r(t) is load function. Modal or direct integration methods are generally used for solving equation (1). To initiate the analysis, the initial conditions are taken from the end of previous analysis of the structure.
The software used for time history analysis is ETAB and for plotting fragility curve is MATLAB software (Tan, 2014). ETABS is the most reliable software and gives result most accurately as compared to other structural analysis software. ETABS gives similar result when compared to analytical method of time history analysis. A MATLAB software also known as matrix laboratory is the programming language which is used for matrix operations, plotting of functions and data, execution of algorithms, etc.
Earthquake is the most destructive natural hazard and it causes the damage of the built-in structures and also the structures which are under construction. The casualties and damages occur due to various earthquake incidences that too a place in past decades is well recorded and well documented. The extensive literature study is carried out to develop the approach for plotting fragility curves for increasing seismic intensity.
The book written by Porter (2018) provides the basic guidance for earthquake-related fragility curve, vulnerability assessment, and risk analysis. It is useful for new graduate student and researchers who are studying natural-hazard risk. Many of its concepts are used and applied to the other hazard assessment and risk modelling.
In the study done by Korkmaz (2008, October), for selected sample of RC structure, a new methodology is used known as Monte Carlo simulations and a conventional methodology known as analytical approximations is used. Acceleration values of selected earthquakes were used in the analyses for Monte Carlo Simulation based and analytical seismic assessment, which gives very close results. Simulation based analysis is more reliable and for further research, number of earthquake data and sample buildings would be increased.
In the research paper written by Sengupta and Li (2016), for seismic performance assessment of the structure, the fragility function is developed and a database of lightly reinforced concrete wall, which is subjected to simulated seismic loading is considered to obtain the drift-based seismic fragility functions. The Park-Ang damage model is considered in classifying the damage states experienced by RC walls. To predict the hysteresis behavior of RC walls, the modified Bouc-Wen-Baber-Noori hysteresis model is considered and instigated in ABAQUS. The hysteresis model of the structure is used to develop the seismic fragility curves of low to mid-rise RC walls in Singapore by using an incremental dynamic analysis method.
Ramamoorthy (2007) have analyzed the RC building up to 10 storey by performing time history analysis and its response is used for assessing fragility curves. The analysis is done using data of synthetic ground motion developed by Memphis Tennessee. The frequency and fundamental time period influences the seismic response of building. The conditional probability of exceeding certain performance level at a given value of spectral acceleration and fundamental time period of the building is known as bivariate fragility estimates. Estimated assurance limits on the fragility assessments were derived to reproduce the essential epistemic uncertainty in the expected values.
Özer and Erberik (2008) have constructed the seismic fragility curves for different reinforced concrete moment resisting frame structure using maximum inter-storey drift ratio as damage parameter. They have considered the four damage states based on the design of structure in Turkey as poor, medium, and good by carrying out non - linear time history analysis. The parameters considered are number of stories, structural deficiencies, and the level of ground motion intensity that affects the structural fragility. With increasing number of stories and decreasing the quality of structural material, the observed damages in the structures are increased (Agrawal & Shrikhande, 2016). Probabilistic limit state is studied and quantification of damage state is done, which affects the ensuing fragility.
The present research is based on the dynamic analysis of the reinforced concrete structure using time history method. The fragility function is used to derive the fragility curve of the structure subjected to the simulated earthquake loading (Duggal, 2010). The primary objectives and scope behind conducting this research are summarized hereunder:
The scope of this research is limited to the structural analysis of the reinforced concrete frame structure and to draw the fragility curve of the structure using fragility function.
A fragility function can be defined as the normal cumulative distribution function of the capacity of the building or structure to resist an undesirable limit state and the capacity is determined in terms of the degree of seismic excitation at which the structure exceeds the undesirable limit state. Fragility function is used to express the uncertain level of the shaking of ground that an RC structure tolerates before failure or collapse. The chance of the RC structure collapsing at the given level of shaking is equivalent to the probability that its structural strength is less than that required strength to resist that level of ground shaking.
Here, the probability of an uncertain quantity (PGA) will be less than or equal to a given value (x), as a function of that value (x) is known as “normal cumulative distribution function”.
In Figure 1, F(t) represents the fragility function, EQ represents the equation or formula used for analysis of structure, and F'(t) represents the fragility curves constructed after completing the analysis of structure.
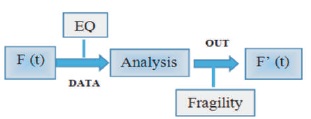
Figure 1. Methodology to Construct Fragility Curve using Fragility Function
Peak ground acceleration is defined as the maximum value of ground acceleration of an individual point on the ground at any time during earthquake.
The lognormal Cumulative Distribution Function (CDF) is the most commonly used form of fragility function. It is represented in mathematical form as,
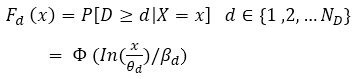
where, Fd(x) = a fragility function, d = damage states, Nd = number of damage states, Φ(s) = standard normal cumulative distribution function, ln(s) = natural logarithm of s, βd = standard deviation of natural logarithm of PGA, θd = median of PGA.
The damage state of the structure is classified according to the maximum inter storey drift ratio as slight damage, moderate damage, heavy damage, total damage, and destruction. The displacement in a structural member due to definite loading history divided by the height of the structure is known as drift ratio. The damage states are defined according to IS coal provisions. Table 1 shows that the classification of damage states occurs in building structure according to drift ratio. Table 2 shows that the classification of damage states occurs in building structure similar to the Indian seismic code IS 1893: (2002).
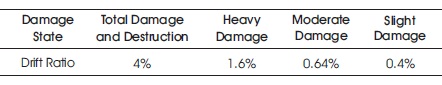
Table 1. Classification of Damage States for the RC Frame Building Structure

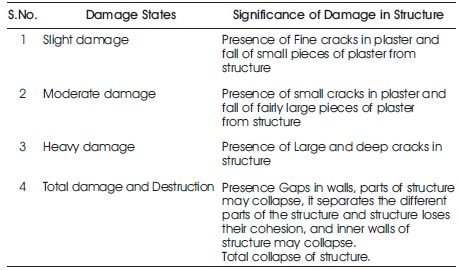
Table 2. Classification of Damage States according to the Seismic Code IS: 1893 - 2002
A 3 storey building is considered with rectangular crosssection RC wall having length of 2650 mm and thickness of 200 mm. The height of the each storey of three storey building is 3600 mm. The compressive strength of the concrete is 30 MPa and the average yield strength is 460 MPa. The cross-section of the column is 300 x 900 mm and the beam is 300 x 600 mm. The building structure considered for the analysis is imaginary or virtual structure and it does not represent any real structure.
To develop the fragility curves, time history analysis of the building structure is done for 30 scaled ground motion in ETAB with increasing intensity level of ground motion with constant increment. It is done until structure becomes dynamically unstable.
The fragility curve is constructed for three storey building structure after performing the time history analysis of the structure using ETAB Software. Table 3 shows the parameters of peak ground acceleration utilized for constructing fragility curve using MATLAB program. Figure 2 shows the elevation view of the structure in ETAB software. The fragility curves obtained for three storey building structure in MATLAB software are shown in Figure 3.
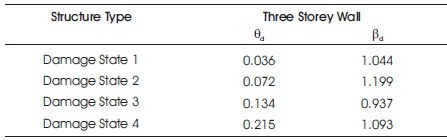
Table 3. Fragility Curve Parameters (PGA)
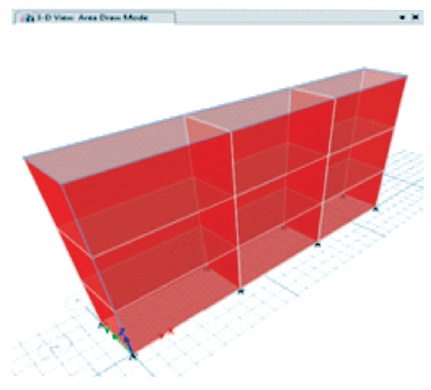
Figure 2. Elevation View of 3 Storey Building
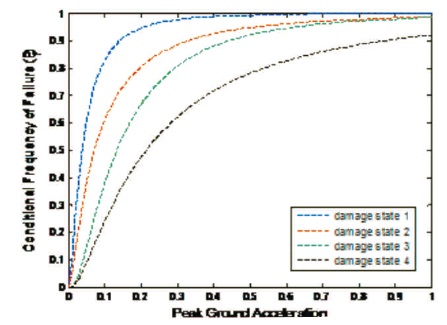
Figure 3. Fragility Curves for Three Storey RC Wall
The building structure having the same plan and width of wall as three storey building and the number of stories of building are increased up to three stories to make it a 6 storey building structure. The fragility curve is constructed for six storey building structure after performing the time history analysis of the structure using ETAB Software. Table 4 shows the parameters of peak ground acceleration utilized for constructing fragility curve using MATLAB program. Figure 4 shows the elevation view of the structure in ETAB software. Figure 5 shows the fragility curve constructed for six storey building structure in MATLAB software.
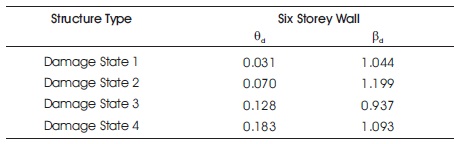
Table 4. Fragility Curve Parameters (PGA)
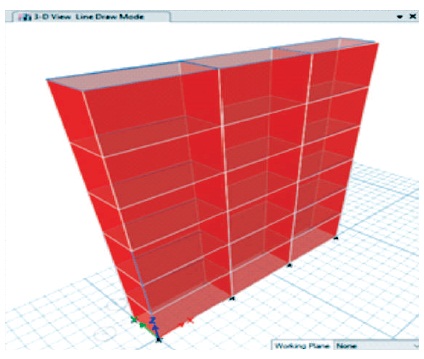
Figure 4. Elevation View of 6 Storey Building
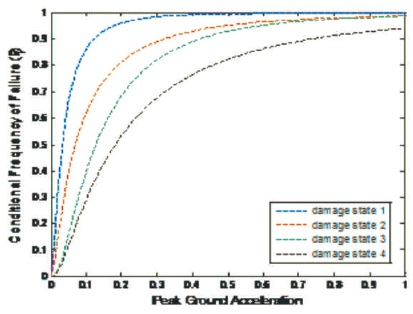
Figure 5. Fragility Curves for Six Storey RC Wall
The building structure having the same plan and width of wall as three storey building and the number of stories of the building are increased up to six storey to make it a nine storey building structure. The fragility curve is constructed for three storey building structure after performing the time history analysis of the structure using ETAB Software. Table 5 shows the parameters of peak ground acceleration utilized for constructing fragility curve using MATLAB program. Figure 6 shows the elevation view of the structure in ETAB software. Figure 7 shows the fragility curve constructed for nine storey building structure in MATLAB software.
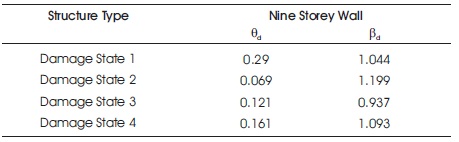
Table 5. Fragility Curve Parameters (PGA)
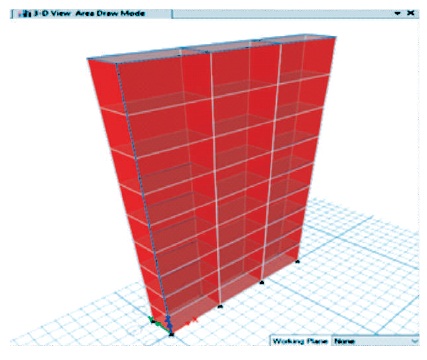
Figure 6. Elevation View of 9 Storey Building
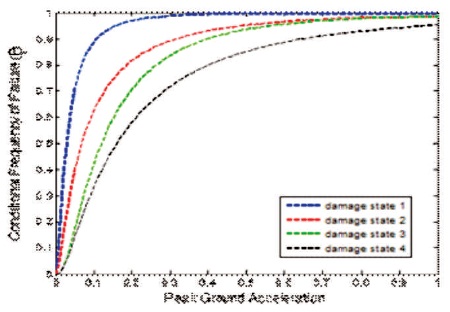
Figure 7. Fragility Curves for Nine Storey RC Wall
Seismic fragility functions are used to derive the seismic fragility curves for Reinforced Concrete structural walls. The structural analysis of building structures is done by using scaled ground acceleration due to earthquake with increasing seismic intensity. Taking PGA as a parameter and using normal cumulative distribution function, fragility curve is drawn. Lognormal cumulative distribution function is commonly used due to its simplicity to use for estimating uncertain quantity, precedent as used for long time in earthquake engineering, information concept based and often fits records perfectly. Fragility curve is constructed using MATLAB code. Fragility curve represents the probability of failure of structure with increase in intensity of earthquakes. As from the given analysis of the reinforced concrete structure, it is concluded that if the intensity of earthquake increases, it also increases the drift ratio of the building structure which results in the severe damage and failure of the structure.
Programming code on MATLAB given below is used for constructing Fragility Curve
% Program for plotting fragility curves for Reinforced concrete wall for the four Damage states
% By Ravikant Singh
pgads1 = input('Enter the median value of PGA for damage state 1 = ');
bds1 = input('Enter the standard deviation value of PGA for damage state 1 = ');
pgads2 = input('Enter the median value of PGA for damage state 2 = ');
bds2 = input('Enter the standard deviation value of PGA for damage state 2 = ');
pgads3 = input('Enter the median value of PGA for damage state 3 = ');
bds3 = input('Enter the standard deviation value of PGA for damage state 3 = ');
pgads4 = input('Enter the median value of PGA for damage state 4 = ');
bds4 = input('Enter the standard deviation value of PGA for damage state 4 = ');
pga = [0:0.01:4];
pc1 = normcdf((log(pga/pgads1))/bds1)
pc2 = normcdf((log(pga/pgads2))/bds2)
pc3 = normcdf((log(pga/pgads3))/bds3)
pc4 = normcdf((log(pga/pgads4))/bds4)
% Plot the Graph
plot(pga,pc1,'--','LineWidth',2);hold on;
plot(pga,pc2,'r--','LineWidth',2)
plot(pga,pc3,'g--','LineWidth',2)
plot(pga,pc4,'k--','LineWidth',2); hold off;
xlabel(' Peak Ground Acceleration ','FontSize',12)
ylabel(' Conditional Frequency of Failure (P_f) ','FontSize',12)
axis([0 1 0 1])
[legh, objh] = legend(' damage state 1', ' damage state 2',
' damage state 3',' damage state 4', 2);
set(legh, 'fontsize', 10)