(1)
Accident black-spot is the place where road traffic accidents have historically been concentrated. In these locations, accidents are not a random event but are common due to varying factors like road environment, traffic factors, and vehicle conditions. In metropolitan cities like Hyderabad in India, road traffic is heterogeneous and vehicular movement is highly influenced by surrounding vehicular traffic which is resulting in frequent accidents.
In order to overcome the increasing number of road accidents, the present study helps to analyze the black-spot locations in the city where the major road accidents take place. Accident data for the past three years (2012-2014) in Hyderabad city was collected from police records in terms of time, date of occurrence, details of accidents such as fatal, injury, and property damage, and type of vehicles involved. This data is analyzed using accident frequency method and accident severity method for identification of black-spot locations. These identified black-spot locations are ranked in terms of severity of occurrence and analyzed to bring out the accident contributing factors for each location. Audit studies were conducted at black-spot locations for achieving improvement measures for reduction in cause of road accidents. A black-spot model was also developed using multiple linear regression analysis. Narrow roads, steep curves, improper illumination, improper traffic signals, and lack of speed sign boards were observed as a few major causes for road accidents at highly ranked black- spot locations. From the study, it was also observed that rash driving, and signal jump play a vital role for increasing accident rates in the city.
Transportation contributes to the economic, industrial and social development of any country. In India, transportation by road is a widely utilized mode that serves maximum service to all its commuters. As per World Health Organization (WHO), the major causes of traffic accidents are driving at higher speeds than at specified limit, driver under the influence of alcohol and not wearing helmets or seat belts. The frequency of road accidents in India is the highest when compared with the world. National Crime Records Bureau (NCRB) report reveals that every year more than 135,000 traffic related deaths occurs in our country.
Hyderabad, is the 6th largest metropolitan city in India, located in the northern part of Deccan plateau and in Southern India on the banks of River Musi extending an area of 625 square kilometers. There are over 3.5 million vehicles operating in the city, of which 58% are two-wheelers, 23% cars and 11% three-wheelers. The remaining 8% include buses, goods vehicles and taxis. Hyderabad road network system is not homogenous in traffic system and road safety. A few locations in the city have an abnormally high number of accidents which are illustrated as crash concentrated hotspots or black spots. These Black spots are responsible in declination of road service and its quality. To provide a safe driving environment in city for its commuter's, the road sections for black-spot shall be identified and provide proper treatment for reducing the cause of road accidents.
Black-spot is a place where traffic accidents have been historically concentrated. At these locations, accidents occur for various reasons of which the major factors contributing for the cause of road accidents are,
Improvement in road safety is expressed by providing alternatives for road geometry and environmental characteristics at highly accident concentrated locations. More specifically, the tasks involved in targeting and treating road sections of high number of accidents.
The present study identifies accident black-spots in the selected locations based on the accident data collected for the past three years and to suggest improvement measures. The objectives of the study include,
A step wise procedure is adopted for identification of blackspot locations and performing audit studies.
Majority of studies by various authors were aimed on Road Safety management. A few have contributed on identification of black spots for the improvement of road safety through improving geometrical parameters, street furniture etc. Mahal et al. [10] defined black- spots as those locations whose accident frequency is significantly higher than expected at prescribed level of significance. Hauer [5] had provided ranking by accident rate and accident frequency method. Frequency, severity and accident rate were used to identify the black-spot locations. Deelesh and Rajiv [2] have determined accident-prone locations which are commonly termed as accident black spots using a Geographic Information System (GIS). Fajaruddin [3] et al. had developed an accident prediction model by using Multiple Linear Regression. Krishnamurthy [7] et al. had focused on accident frequency and severity index methods to identify accident black-spots and ranked them by frequency and severity values. Shenjun and Becky [11] had focused on hot zone identification and dangerous road locations in context with pedestrians. Aliasghar et al. [1] had explained on identification and prioritization of Accident-Prone Sections (APSs) which was based on efficiency concept to emphasize accidents. Huayun [6] has discussed on utilization of geo-coding and VRS-GPS positioning technology for recording traffic accidents. Liyamollsen et al. [9] had discussed on identification of accident locations using Geographic Information System (GIS). Evaluation was carried through Weighted Severity Index (WSI) method and correspondingly ranked accident locations. Gourav [4] et al. has made an attempt for ranking the black-spot using accident severity value. Leelakajonjit et al. [8] has attempted to study the road safety management system and proposed a better method to identify black spots.
Most of the studies conducted were on identification of black-spot using accident frequency method, accident severity method, accident rate method, rate quality method, etc., for homogeneous and heterogeneous traffic conditions. But limited studies were carried out for our city of Hyderabad. In this context, an attempt is made in identifying black-spot locations. Audit studies were also conducted on highly ranked black-spot locations. An accident model is also developed for improving the existing situation.
There are several methods for identification of black spot location for a given roadway facility. The data pertaining to the roadway accident, geometric, traffic and environmental conditions decides which method to be employed for identification of these black-spot. A few methods used for identification of accident black-spot are Accident Frequency Method, Accident Rate method, Accident Severity Method, Accident Density Method, Frequency Rate Method, Safety Indices Method, Severity- Rate Method, Rate-Quality-Control Method, and Empirical Bayes Method. In this study black-spot has been identified using accident frequency method and accident severity method.
In Accident Severity Method [12], injury severity is taken into consideration. Number of fatalities, number of injured people and number of property damage are only the cases in accident to be taken into consideration. Separate weights for fatal, injuries and property damage of severity are provided. These weights are provided based on the importance of injury and severity.
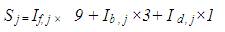
The severity value for road section j is
Severity = number of fatalities (f) × 9 + number of injured persons (b) × 3 + number of damaged vehicles (d) × 1.
The relative severity value is then,
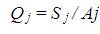
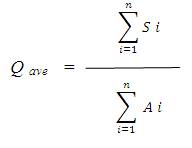
The above equation is severity per accident. The average value is estimated as,
and the variance σ2 is estimated with 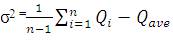
Black-spot from the severity point of view is if Qj > Qc.
where the critical value 
Aj is number of accidents on section j during certain time period.
Qj is the relative severity value on section j.
Sj severity value for road section j.
Kα is a constant chosen for the significance test and is determined from a normal distribution for a given certain significance level α.
α=1% gives kα = 2.576,
α = 5 % gives kα = 1.645, and
α = 10 % gives kα = 1.282.
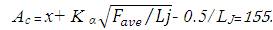
Accident Frequency Method [12] considers a number of accidents at a particular place for ranking the black-spots. Three year accident data was used for determining yearly frequencies and average frequency on selected locations of Hyderabad city. These black-spot are ranked in the descending order of observed frequencies. A road section is considered as black-spot if accident frequency Aj > Ac ,
where
Ac is the critical value for accident frequency.
Lj is the length of the road section. Here, Lj is assumed to be 1 km.
Fave is the average accident frequency for all road sections.
Accident data for the last three years (2012-2014) were collected as shown in Figure 1. Year wise data was obtained from the traffic commissioner office of police department and is shown in Figure 2. In the present study, the black-spot locations were selected locations whose fatalities are high. The main study stretches includes Banjara Hills, Jubliee Hills, Punjagutta, Sanjeev Reddy Nagar, Gopalapuram, Begumpet, Nampally, LungerHouze, Bowenpally, Bollaram, Secundrabad (Osmania University location) and is indicated in Figure 3. Data was also collected for accident time, date of occurrence, type of vehicles involved, location of the accident, details of injury or severity of accidents, road geometry etc., Figure 4 shows accused vehicles in the year 2014 and Figure 5 explains the accident victim's proportion, it is also observed from the Figure 5 that 2-wheelers and pedestrians are mostly involved in fatalities in the city.
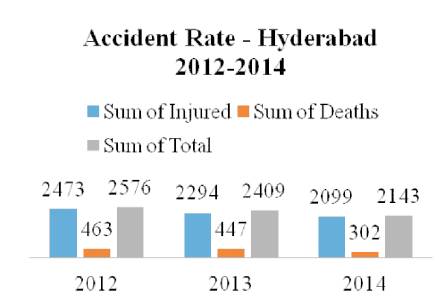
Figure 1. Accident Rate
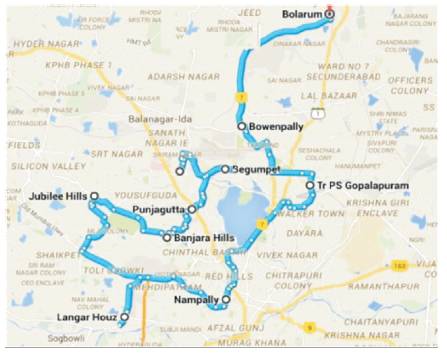
Figure 2. Study Areas of Hyderabad
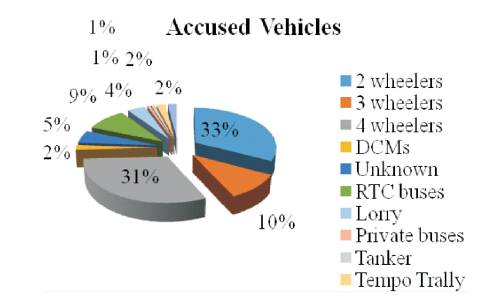
Figure 3. Accused Vehicles Count
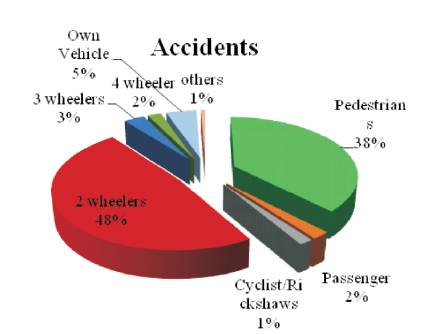
Figure 4. Accident Victim's Proportion
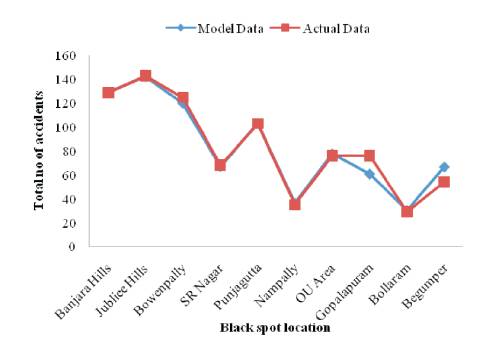
Figure 5. Comparison of Total Number of Accidents from Existing Data with the Model Values
Ranking of accident spots helps to coordinate the improvement programs and to assess the place that shall be provided for immediate attention. Accident frequency method, the accident frequencies of all locations for three year period is calculated and black-spot are listed in descending order. In accident severity method, severity index is used for black-spot identification and is provided as descending order for severity. The accident frequency and severity values of the three consecutive years are shown in Table 1 and Table 2. Accident severity value for Bollaram location calculated as,
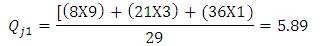
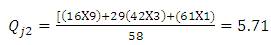
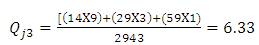
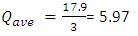
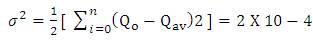
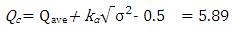
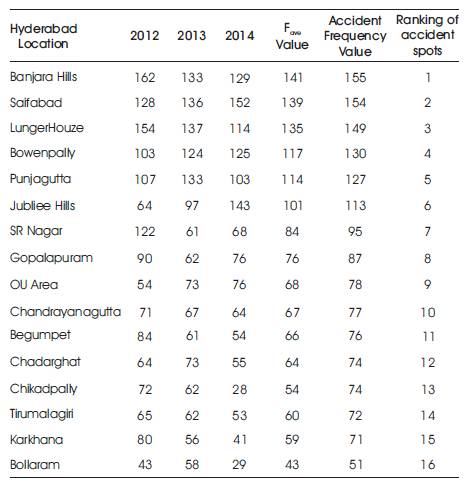
Table 1. Accident Frequency Values of three consecutive years in Hyderabad location
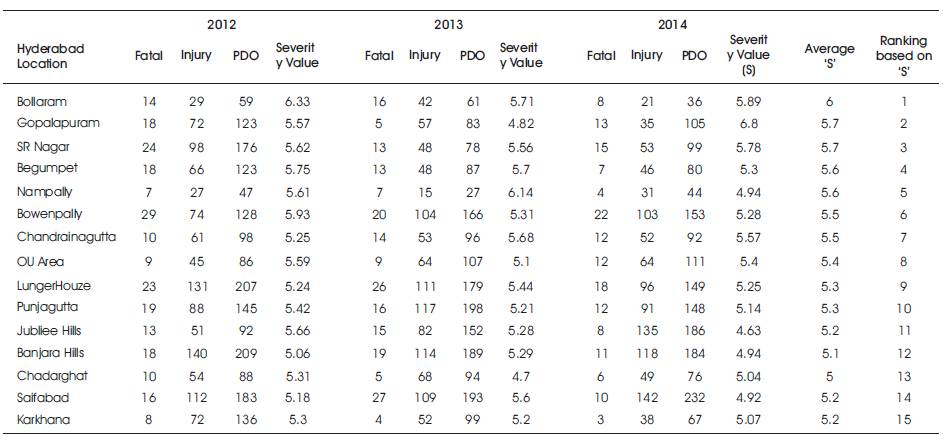
Table 2. Accident Severity Values of three consecutive years in Hyderabad location
Accident frequency value for Banjara hills location:
Common black spot were considered from severity and frequency method in order to perform audit studies. These studies shall explain the reasons on exiting situation for high accident rate and thus shall improve the existing situation and are shown in Table 3.
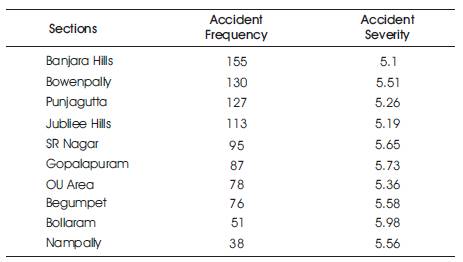
Table 3. Accident frequency and severity values for the study areas
Site reconnaissance studies as spot speed surveys and geometric surveys were conducted at top ten accident black-spot locations identified from severity and frequency method as shown in Table 3. Spot speed surveys are carried out to understand the speed of different vehicles travelling at higher speeds than that of design speed. Bowenpally and Bollaram locations spot speeds are measured on both the direction for all categories vehicles.
There are few accidents observed but with more severity. The road design is dangerous as there are two sharp curves one at Koteswara temple – the 4th training battalion and the second at St. Anns School which are having the high accident rate record. These curves specially cause accidents by heavy vehicles. Majority of accidents occur during night time due to heavy vehicles passing from this area. As part of detailed analysis of spot speed studies carried out at various sections in this locations and was observed that more heavy vehicles are running with speeds more than design speed specified.
Suggested Improvements:
The accidents occur with more frequency but with less severity. More traffic accidents are observed during peak hours. No signals during the early morning and late nights are observed. Vehicular speeds are found to be higher. From the interview survey, it was observed that drawbacks like pot holes, pipe line damages on the road will always distract the flowing traffic. The major accident spots in this area include Chintal road, the Mallareddy function hall road, and junction at Muslim grave yard.
Suggested Improvements:
The section had heavy traffic flow during the peak hours. The curve located at the Yellama Temple – Balkampet Junction is well designed. But, major accidents occur during night time due to rash driving, over speed, drunk and drive, and due to the negligence of road users. Pedestrians and two wheelers are mostly affected. Majority of accidents occurs at Balamrai check-post section and the paigah plaza point.
Suggested Improvements:
More accidents occur due to the vehicular collision approaching from opposite direction. A very large number of shopping malls and commercial buildings are located in this area. Street parking is not designed properly which reduces the roadway width. Accidents' occurring on this road section is at Keertilal Jewellery Complex, and on Rajbhavan Road.
Suggested Improvements:
Heavy traffic is observed towards Nampally Junction. More shops are located on the road side just besides the junction. Foot paths were available at a few of the locations and are provided haphazardly. Parking on the streets is the major cause for the traffic accidents. From the interview survey, it was found that major number of accidents take place because of rash driving, signal jumping, and wrong side drives. More frequently accidents occur at Shivaji Hotel, STN Road signal, besides Niloufur Hospital.
Suggested Improvements :
“An Accident Model” is generally an algorithm pitting a dependent variable against several independent variables. The dependent variable in the accident prediction model is the number of accidents, while the independent variables are quantitative variables as vehicular speed, cause of the accident, time of occurrence of accident, or driver wearing seat belt or helmet. The errors of this model were calculated and tested for t-test. The results show that, the coefficient of determination lies between 0 and 1 and therefore the model holds good fit and having the t- values within the limits. The commonly used model prediction of accident at black spot locations will be in the form of multi linear regression equation as,

where Y is the Number of accidents at the black spot location, X1: Vehicular speed, X2 : Driver wearing seat belt or helmet, X3 : Cause of road accident, X4 :
Time of occurrence of accident. The model is obtained as, Y=-124.638+17.23X1 +24.16X2 +36.25X3 - 5.868X4.
This model is also compared with the existing variables and provides a close fit as shown in Figure 6. Slight improvements on all the model variables will comparatively provide reduction in the rate of accidents at all the black spot locations considerably.
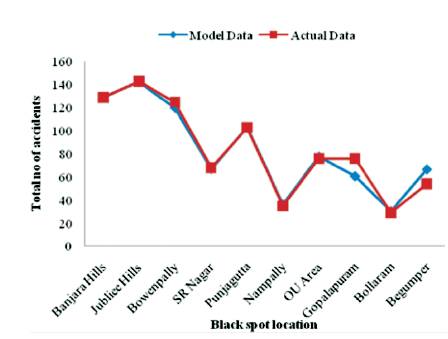
Figure 6. Comparison of Total Number of Accidents from Existing Data with the Model Values
The analysis of accident black-spots helps in identifying the stretches where accidents are more. In the present study, black-spots are identified and audit studies were conducted to find out the deficiencies of road related factors (traffic related). Based on the study, the following suggestions are recommended.
Overall this study appears to be effective in reducing number of causalities if suggested improvements were implemented.
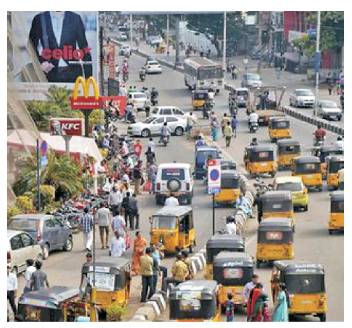
Photo 1. Irregular traffic flow at Banjara Hills space at Nampally
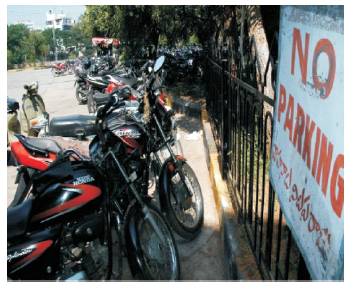
Photo 2. Vehicles parked in NO Parking Area
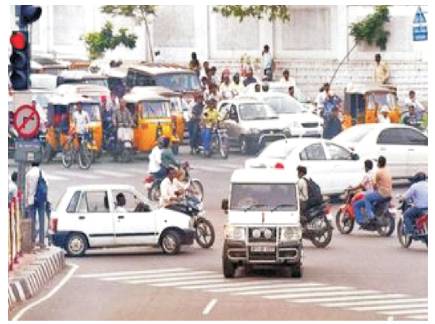
Photo 3. Signal Jump at Jubille Hills
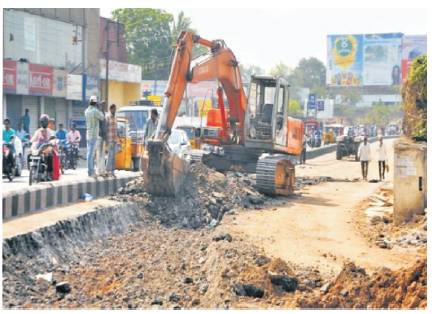
Photo 4. Road Repair Works at Bowenpally