
Figure 1. More Mass on One Side Causing Floor Twist
Irregular buildings are increasingly common in urban areas around the world, presenting unique challenges for seismic assessment and retrofitting. Pushover analysis and capacity curves have emerged as powerful tools for evaluating the seismic performance of buildings and developing retrofitting strategies. In this study, a methodology is proposed for seismic assessment and retrofitting of irregular buildings that incorporates pushover analysis and capacity curves. The methodology involves the use of finite element models to simulate the behavior of irregular buildings under seismic loading and the development of capacity curves to evaluate the structural response. The efficacy of the proposed methodology is demonstrated through a case study of an irregular building in a high-seismic area. Capacity curves developed using pushover analysis can identify potential failure modes in the building, and targeted retrofitting strategies can be developed based on these findings. Our results highlight the importance of using advanced analysis and design techniques to ensure the safety and resilience of irregular buildings in seismic areas. The proposed methodology can be applied to a wide range of irregular buildings and can contribute to the development of building codes and design guidelines for these structures.
Irregular buildings are becoming increasingly common in urban areas, with unique architectural designs and complex geometries. While these buildings offer aesthetic and functional advantages, they also pose significant challenges for seismic assessment and retrofitting. Unlike regular buildings, which are designed to have uniform mass and stiffness distribution, irregular buildings may exhibit complex behavior under seismic loading, leading to unexpected failure modes. Traditional seismic analysis and design methods may not be sufficient to capture the behavior of irregular buildings, and new methodologies are needed to ensure the safety and resilience of these structures (Zucconi et al., 2017). Pushover analysis and capacity curves have emerged as effective methods for evaluating the seismic performance of buildings and developing retrofitting strategies. Pushover analysis is a nonlinear static analysis method that allows engineers to estimate the response of a building to seismic forces, while capacity curves provide a graphical representation of the expected structural response under different levels of seismic loading (De Stefano & Mariani, 2014). These methods can be especially useful for irregular buildings, which may have non-uniform mass and stiffness distributions, irregular geometries, or other unique features that require a more detailed analysis. In this research, a methodology for seismic assessment and retrofitting of irregular buildings that incorporates pushover analysis and capacity curves is proposed (Pujades et al., 2015). The efficacy of the proposed methodology is demonstrated through a case study of an irregular building in a highseismic area. The proposed methodology can help engineers better understand the behavior of irregular buildings under seismic loading, identify potential failure modes, and develop targeted retrofitting strategies to improve their performance. The results of this study can contribute to the development of building codes and design guidelines for irregular buildings and improve the safety and resilience of buildings in seismic areas.
Zucconi et al. (2017) develop a model to forecast unreinforced masonry buildings' usability, i.e., the condition of a building being habitable or occupiable after a seismic event. The model is based on scores given to seven building parameters that are usually easy to survey: building position within the structural aggregate, number of stories above ground, construction timespan, and structural class, presence of strengthening interventions, roof type, and pre-existing damage to structural elements.
Pujades et al. (2015) depict a capacity-based damage index that allows setting up a fragility model. Specific reinforced concrete buildings are used to illustrate the adequacy of the capacity, damage, and fragility models. The usefulness of the models here proposed is highlighted, showing how the parametric model is representative for a family of capacity curves having the same normalized nonlinear part and how important variables can be tabulated as empirical functions of the two main parameters defining the capacity model.
Raagavi and Sidhardhan (2021) focus on mostly irregular in geometry and elevation for aesthetic purposes. These irregularities may also be due to economic feasibility, land availability, and other factors. From the past earthquake, research shows that regularly configuredstructures stay safe in earthquakes, but irregularly configured structures could not withstand an earthquake effectively. Structures experience lateral deflections under earthquake loads. This work focuses on the various types of building irregularities that can occur and their behavior during seismic forces. This study focuses on learning the parameters to be analyzed while analyzing a structure for seismic force.
Stefano and Mariani (2014) attempt to summarize what have been the most important contributions from the field observations to several aspects of earthquake engineering, particularly understanding the performance of buildings, both engineered and non-engineered, including historical structures, understanding geotechnical effects, gaining understanding of the social and economic consequences of earthquakes, and estimating loss from future scenario events.
Branco and Guerreiro (2011) present a comparative study of the performance of different seismic retro fitting techniques implemented in a model of an existing masonry building. The first part of the study considers the testing of different methodologies to strengthen the building floors, to enable them to behave as stiff diaphragms. In the second stage, the seismic protection of the building is studied with these different solutions: the insertion of concrete walls, the use of a base isolation solution, and the implementation of viscous dampers. The use of viscous dampers is examined in detail because they improve seismic behavior while causing little interference.
The first step is to define the building's geometric and structural characteristics, such as height, number of floors, location, materials used, and irregularities that could affect its seismic performance. Irregularities may include vertical and horizontal irregularities, soft stories, irregular distribution of mass, and irregular plan layout, among others. Irregular buildings are structures that deviate from standard or regular forms in terms of their shape, size, layout, or configuration (Raagavi & Sidhardhan, 2021).
Irregular buildings may have an unusual shape, such as an L-shape, T-shape, or U-shape, which can make them challenging to design, construct, and maintain. Figure 1 shows more mass on one side, causing the floor to twist.
Figure 1. More Mass on One Side Causing Floor Twist
The floors in an irregular building may not be at the same level or may have varying dimensions, which can affect the layout and accessibility of the space. The height of an irregular building may vary, with some parts being taller or shorter than others. This can make it difficult to create a uniform aesthetic or to comply with building codes. Irregular buildings may have facades with unique features, such as angled walls, overhangs, or protruding elements, which can make them visually striking but also challenging to construct and maintain. The uneven plan stiffness causing floor twist is shown in Figure 2.
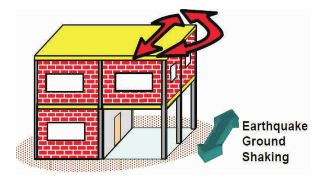
Figure 2. Uneven Plan Stiffness Causing Floor Twist
The interior spaces of an irregular building may be laid out in a non-standard way, with irregularly shaped rooms or unexpected connections between spaces. Irregular buildings may incorporate a mix of materials and finishes, which can create a unique look but also require special care and maintenance. Overall, irregular buildings require careful planning, design, and construction to ensure that they are structurally sound, functional, and aesthetically pleasing.
This is to determine the seismic hazard of the site where the building is located. This can be done by obtaining seismic hazard maps or conducting a site-specific seismic hazard analysis. Seismic hazard analysis is a process that assesses the potential for earthquakes to occur in a specific geographic region and estimates the potential ground motion that could result from those earthquakes. This analysis is crucial for understanding the level of risk that a region faces from earthquakes and for informing building codes and other regulations that aim to minimize the damage and loss of life resulting from seismic activity (Colapietro et al., 2014). Seismic hazard analysis typically involves several steps. First, researchers gather data on the history of seismic activity in the region, including the frequency and magnitude of earthquakes that have occurred in the past. Figure 3 shows the seismic hazard analysis using Peak Ground Acceleration (PGA) or peak ground velocity on the map.

Figure 3. Seismic Hazard Analysis using Peak Ground Acceleration (PGA) or Peak Ground Velocity
They also examine the geological and tectonic features of the area, such as fault lines and soil conditions, that could affect the severity of ground motion during an earthquake (Asadi-Ghoozhdi & Attarnejad, 2020). Using this data, researchers can then create a seismic hazard map that shows the likelihood of earthquakes of different magnitudes occurring in different parts of the region. They can also estimate the potential intensity of ground motion in each area, which is typically expressed as a measure of Peak Ground Acceleration (PGA) or Peak Ground Velocity (PGV). This information can be used to help engineers and architects design buildings and other structures that are capable of withstanding the forces of seismic activity (Branco & Guerreiro, 2011). Seismic hazard analysis is an ongoing process, as new data and research can lead to updates and revisions to the hazard maps and risk assessments. This analysis plays a critical role in ensuring the safety and resilience of communities in earthquake- prone regions.
This is to select a set of ground motion records that represent the seismic hazard at the site. The records should be compatible with the seismic hazard analysis and have appropriate characteristics, such as frequency content, amplitude, and duration. The selection of ground motion records is an important step in seismic hazard analysis and earthquake engineering (Moehle & Deierlein, 2004) . Ground motion records are measurements of the ground motion that occurs during an earthquake, which are typically recorded by seismometers located at various distances and angles from the earthquake's epicenter. The ground motion records are based on acceleration, velocity, and displacement and shown in Figure 4.
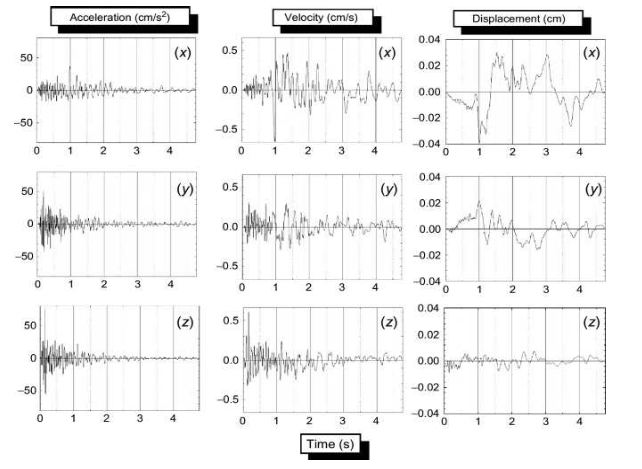
Figure 4. Ground Motion Records Based on Acceleration, Velocity and Displacement
To select appropriate ground motion records for use in seismic hazard analysis and earthquake engineering, several factors must be considered. Ground motion records should be selected based on the magnitude and distance of the earthquake they represent. Generally, records from earthquakes with magnitudes and distances similar to those expected in the region of interest are preferred. The characteristics of the site where the ground motion records were recorded can also affect their suitability. Ground motion records from sites with similar soil and geological conditions to the region of interest may be preferred, as these records are more likely to accurately reflect the ground motion that would occur at the site. The quality of the ground motion records themselves is also important. Records with high signal-to- noise ratios and good frequency content are preferred, as these records can provide more accurate and detailed information about the ground motion. To account for the variability of ground motion that can occur during an earthquake, it is often recommended to use multiple ground motion records. The records should be selected to represent a range of possible ground motions that could occur in the region of interest. Historical data on seismic activity in the region of interest can also be useful in selecting ground motion records. Records from past earthquakes that are similar in magnitude and distance to those expected in the future can be used to provide additional information about the expected ground motion. Overall, the selection of ground motion records is an important aspect of seismic hazard analysis and earthquake engineering. By choosing appropriate records that accurately represent the ground motion that could occur during an earthquake, engineers and seismologists can improve their understanding of the seismic hazard and design safer and more resilient structures.
This is to perform a pushover analysis, which is a nonlinear static analysis method that provides an estimate of the building's seismic performance. The analysis involves applying a sequence of lateral loads to the building, and the response is evaluated at each step until collapse or the maximum deformation capacity is reached. The pushover analysis should consider the irregularities of the building (De Stefano & Mariani, 2014). Figure 5 shows the pushover curve for pushover analysis. The pushover curve can be used to assess the performance of a building under seismic loading and to identify the onset of different levels of damage, which are commonly classified as slight, moderate, and extensive damage. The specific acceleration and specific displacement are two parameters commonly used in pushover analysis to characterize the severity of the seismic loading (Chopra & Goel, 2002). The specific acceleration is defined as the acceleration per unit of gravity, while the specific displacement is defined as the displacement per unit of building height to plot the pushover curve against the specific acceleration and specific displacement for slight, moderate, and extensive damage. The pushover curve is plotted with the specific acceleration on the x-axis and the specific displacement on the y-axis. The points on the pushover curve are marked where the maximum roof displacement corresponds to slight, moderate, and extensive damage. These points are connected to create a curve for each level of damage.
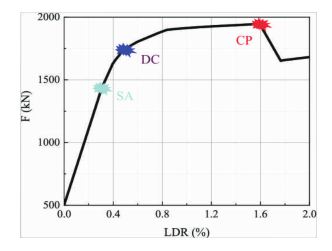
Figure 5. Pushover Curve for Pushover Analysis
The resulting plot will show the pushover curve for the building under seismic loading, with the specific acceleration and specific displacement values corresponding to different levels of damage. The performance level of irregular building structures in pushover analysis can vary depending on the nature and severity of the irregularity, the structural system, and the intensity of the design loads. Pushover analysis is a static nonlinear analysis method that evaluates the lateral strength and stiffness of a building under gradually increasing lateral loads. This method is widely used in performance-based seismic design to assess the response of a building during an earthquake. However, irregular building structures, such as those with a non- uniform mass or stiffness distribution, discontinuous vertical load paths, or soft-story configurations, can exhibit complex and nonlinear behavior that may not be adequately captured by pushover analysis (Asadi- Ghoozhdi & Attarnejad, 2020). The performance level of irregular building structures in pushover analysis is shown in Figure 6. These irregularities can lead to localized failure mechanisms, such as excessive deformation, shear or flexural failure, and the development of significant tensile stresses that can compromise the structural integrity of the building.

Figure 6. Performance Level of Irregular Building Structures in Pushover Analysis
Therefore, it is important to carefully evaluate the performance level of irregular building structures using pushover analysis and to incorporate appropriate measures to mitigate the potential risks associated with these irregularities. This may include additional design and detailing requirements, such as the use of additional seismic-resistant elements or the strengthening of the existing structural components, to improve the overall performance of the building during a seismic event (Themelis, 2008).
Pushover analysis is commonly used in seismic retrofitting of irregular buildings to assess the performance of the building under seismic loads and to identify potential failure mechanisms. The analysis can help identify the weak points and areas of non-uniformity in the building. Seismic retrofitting of irregular buildings can be a complex process that requires a thorough understanding of the structural behavior of the building and the potential sources of damage (Di Sarno & Manfredi, 2010). Soft stories occurs when the first floor of a building is significantly more flexible than the floors above, creating a potential collapse mechanism during an earthquake.
Retrofit measures may include the addition of structural elements or strengthening of existing elements to improve the stiffness of the first floor. Non-uniform mass or stiffness distribution occurs when the building has a complex or irregular shape, resulting in non-uniform load distribution and stiffness. Figure 7 depicts a pushover analyzing and seismic retrofitting in irregular buildings.
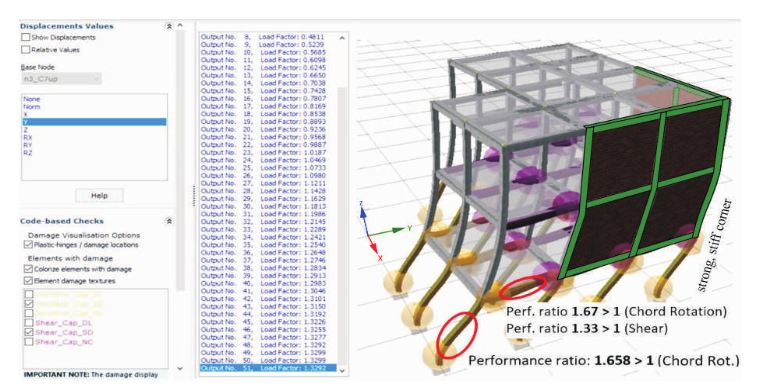
Figure 7. Seismic Retrofitting Pushover Analysis in Irregular Building
Retrofit measures may include the addition of braces or shear walls to redistribute loads and improve overall stiffness. Discontinuous vertical load paths occur when vertical loads from the building's weight are not carried continuously through the building's structural system. Retrofit measures may include the addition of new structural elements to create a continuous load path. In retrofitting an irregular building, pushover analysis can be used to evaluate the effectiveness of different retrofit measures and optimize the design of the retrofit. The analysis can be used to assess the performance of the building before and after retrofitting and to identify the most critical elements for strengthening. Pushover analysis can also help in determining the appropriate level of retrofit measures needed to achieve the desired performance level of the building. The analysis can provide information on the expected performance of the building under different levels of seismic loading and can help ensure that the retrofit measures are effective in improving the overall performance of the building (Das et al., 2021). Overall, pushover analysis can be a valuable tool in the seismic retrofitting of irregular buildings, as it can provide a detailed understanding of the structural behavior of the building and help identify effective retrofit measures (Shehu, 2021).
Capacity curves show the relationship between the element's strength and its deformation capacity. Capacity curves are developed from the results of the pushover analysis.
Capacity curves are graphical representations of the load-carrying capacity of structural elements such as beams, columns, and walls. The curves show the relationship between the applied load and the corresponding deformation or displacement of the element. For a four-story irregular building, the capacity curves for beams, columns, and walls can vary depending on several factors, such as the structural materials, design parameters, and boundary conditions (Mohod, 2015). Here is a general description of capacity curves for beams, columns, and wall elements. Capacity curves for beams typically show the load-carrying capacity of the beam as a function of the mid-span deflection. As the load on the beam increases, the deflection also increases. Eventually, the beam will reach its ultimate load-carrying capacity, and any further increase in load will cause the beam to fail. The capacity curve for beams can be affected by several factors, such as the material properties, cross-sectional geometry, and length-to-depth ratio. The capacity curve of a four-story building is shown in Figure 8.
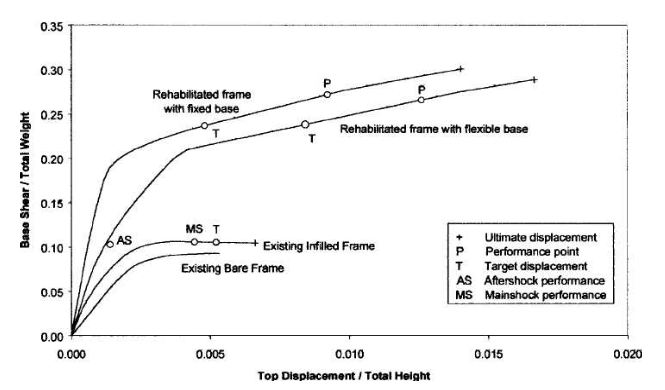
Figure 8.Capacity Curve of Four-Story Irregular Building
Capacity curves for columns show the load-carrying capacity of the column as a function of the applied axial load. As the axial load on the column increases, the deformation or buckling of the column also increases. Eventually, the column will reach its ultimate load-carrying capacity, and any further increase in load will cause the column to fail. The capacity curve for columns can be affected by several factors, such as the column geometry, slenderness ratio, and boundary conditions.
Capacity curves for walls typically show the load-carrying capacity of the wall as a function of the axial load and the lateral deflection. As the axial load on the wall increases, the lateral deflection also increases. Eventually, the wall will reach its ultimate load-carrying capacity, and any further increase in load will cause the wall to fail. The capacity curve for walls can be affected by several factors, such as the wall thickness, reinforcement, and aspect ratio. In summary, the capacity curves for the elements of a four-story irregular building can vary depending on several factors. These curves are important for understanding the behavior and load-carrying capacity of the building's structural elements and can be used to optimize the design and ensure the safety of the building.
Capacity curves are used to evaluate the building's seismic performance. The performance evaluation can be done by comparing the building's demand curves, which represent the expected response of the building during an earthquake, with the capacity curves. If the demand exceeds the capacity, retrofitting measures are necessar y. Per formance evaluation in seismic assessment and retrofitting of irregular buildings involves the assessment of a building's performance during a seismic event and the identification of any necessary retrofits or modifications to improve the building's seismic performance. Irregular buildings are defined as buildings that do not meet the regularity criteria for seismic design, such as buildings with irregular shapes, heights, or structural systems. These buildings are more vulnerable to seismic hazards due to their non-uniform distribution of mass, stiffness, and strength (Ahmed et al., 2016). Performance evaluation typically involves a combination of experimental and analytical methods to assess the building's response to seismic events. Experimental methods include field testing, laboratory testing, and non-destructive testing, while analytical methods include numerical modelling and simulation. Figure 9 shows seismic performance evaluation structural building with irregularities.
Figure 9. Seismic Performance Evaluation of Structural Building with Irregularities
The first step in the evaluation process is to assess the seismic hazards of the building's location. This involves determining the seismic hazard levels and potential ground motion parameters that the building may be subjected to. The next step is to perform a structural analysis of the building. This involves modelling the building and its structural elements using computer- based software and analyzing the building's response to seismic loads. After the structural analysis is complete, the next step is to assess the damage potential of the building. This involves identifying the critical locations in the building where damage is most likely to occur. Based on the results of the previous steps, the final step is to design retrofit measures that can improve the building's seismic performance (Kreslin & Fajfar, 2010). This may involve adding new structural elements, strengthening existing ones, or modifying the building's configuration. Seismic performance evaluation graph of an irregularities structural building is shown in Figure 10.
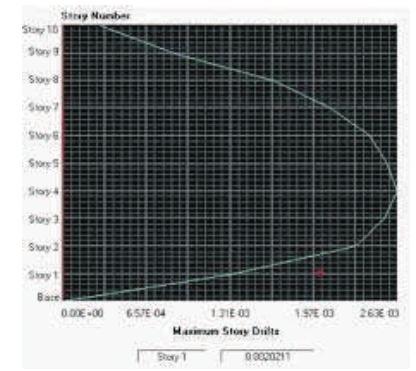
Figure 10. Seismic Performance Evaluation Graph of an Irregularities Structural Building
Performance evaluation in seismic assessment and retrofitting of irregular buildings is a critical process that can help to ensure the safety of occupants and the structural integrity of the building during a seismic event. By identifying potential weaknesses and designing appropriate retrofit measures, the building can be made more resilient and able to withstand seismic hazards.
Performance evaluation is necessar y to develop retrofitting measures. Retrofitting measures may include the addition of structural elements, the strengthening of existing elements, and the modification of the building's geometry to eliminate irregularities.
Retrofitting measures for irregular buildings typically involve the addition of new structural elements, strengthening of existing elements, and modification of the building's geometry to eliminate irregularities. These measures are aimed at improving the building's seismic performance and reducing the potential for damage or collapse during a seismic event. The addition of structural elements involves the addition of new structural elements to reinforce the building's existing structure. For example, additional columns or braces may be added to improve the lateral resistance of the building. These new elements are typically designed to work in conjunction with the existing structure to improve its overall performance. Strengthening of existing elements is another retrofitting measure to improve their load-carrying capacity. This may involve adding additional reinforcement such as steel plates, fiber reinforced polymers (FRP), or concrete jackets to the existing columns, walls, or beams (Montuori et al., 2020). Strengthening existing elements can be an effective way to increase the building's seismic performance without significantly altering its geometry. Figure 11 shows retrofitting measures for irregular buildings.
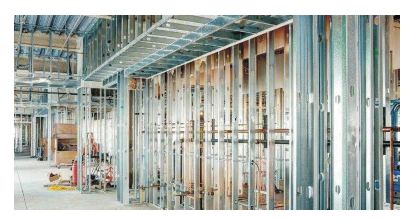
Figure 11. Retrofitting Measures of Irregular Building
Modification of the building's geometry is necessary to eliminate irregularities that can contribute to the building's vulnerability to seismic hazards. This may involve adding or removing floors, changing the layout of the building, or modifying the size and shape of the building's structural elements. These modifications can help to distribute the building's mass and stiffness more evenly, reducing the potential for seismic damage. In summary, retrofitting measures for irregular buildings involve a range of techniques that can be used to improve the building's seismic performance. The most effective retrofitting strategy for a particular building will depend on its specific characteristics and the type and extent of irregularities present in the structure (Puthanpurayil et al., 2020). Retrofitting measures should be carefully designed and implemented to ensure their effectiveness and minimize the potential for unintended consequences.
The retrofitting measure is to perform a cost-benefit analysis. The analysis should consider the costs of the retrofitting measures, the benefits in terms of increased safety, reduced damage, and lower repair costs, as well as the expected service life of the building. The analysis can help in selecting the most cost-effective retrofitting measures. Cost-benefit analysis is a useful tool for selecting the most cost-effective retrofit measures for irregular buildings. It involves comparing the costs of different retrofitting options with the expected benefits in terms of improved seismic performance and reduced damage during a seismic event. Here are the key steps involved in conducting a cost-benefit analysis for retrofitting irregular buildings. The first step is to identify the range of retrofit measures that could be applied to the building. This may involve a combination of adding new structural elements, strengthening existing ones, or modifying the building's geometry. Each of these measures will have different costs and benefits associated with them.
The next step is to estimate the costs associated with each retrofitting measure. This may include materials, labor, design and engineering costs, and other related expenses. The benefits of each retrofitting measure can be estimated by evaluating the expected reduction in damage during a seismic event. This may be based on past experiences, computer simulations, or other analytical methods. The cost-effectiveness of each retrofitting measure can be calculated by dividing the estimated benefits by the estimated costs. This will give a measure of the expected reduction in damage per unit cost. Finally, the most cost-effective retrofitting measure can be selected based on the calculated cost- effectiveness of each option. This measure will provide the greatest reduction in damage at the lowest cost. It is important to note that cost-benefit analysis is not the only factor that should be considered when selecting retrofit measures for irregular buildings. Other factors, such as building use, architectural and historical significance, and other non-monetary considerations, should also be taken into account. However, cost-benefit analysis can provide an important tool for decision-making and help to ensure that retrofitting measures are implemented in the most efficient and effective way possible.
The seismic assessment and retrofitting of irregular buildings is a complex and challenging task, and incorporating pushover analysis and capacity curves can provide valuable information to aid in the decision- making process. Pushover analysis involves applying incremental lateral loads to the structure and calculating the resulting displacement and force demands at each load step. The pushover analysis provides a load- displacement curve for the structure, which can be used to estimate the building's overall capacity to resist seismic forces (Vamvatsikos & Cornell, 2002). Capacity curves are another useful tool for seismic assessment and retrofitting. Capacity curves show the expected response of a structural element, such as a column, beam, or wall, to increasing lateral forces. The curves show the load- carrying capacity of the element as well as the level of deformation that can be expected before the element fails. Capacity curves can be used to identify potential failure mechanisms and to design retrofit measures that target specific weak points in the structure. The use of pushover analysis and capacity curves was applied to an irregular four-story building, and the results showed that the building had significant weaknesses that could be addressed through retrofitting. Pushover analysis revealed that the building was susceptible to lateral drift and that the load-displacement curve had a significant "soft story" effect, indicating that the building was vulnerable to damage or collapse during a seismic event. The capacity curves of the building's elements, such as beams, columns, and walls, revealed that many of these elements were under-designed and were at risk of failure during a seismic event. For example, some of the columns had low load-carrying capacity and were susceptible to buckling, while some of the beams had low stiffness and were vulnerable to excessive deformation. Based on the results of the pushover analysis and capacity curves, several retrofitting measures were proposed to improve the building's seismic performance. These measures included the addition of new structural elements, such as steel braces and concrete walls, and the strengthening of existing elements using Fiber Reinforced Polymers (FRP) and concrete jackets.
The proposed retrofitting measures were then evaluated using cost-benefit analysis to determine the most cost- effective options. The use of pushover analysis and capacity curves can provide valuable information for the seismic assessment and retrofitting of irregular buildings. These tools can be used to identify potential weaknesses in the structure, to design retrofitting measures that target specific weak points, and to evaluate the effectiveness and cost-effectiveness of proposed retrofit options. Ultimately, the goal of seismic assessment and retrofitting is to improve the building's seismic performance and reduce the risk of damage or collapse during a seismic event.
The seismic assessment and retrofitting of irregular buildings is a complex and challenging task that requires careful consideration of the building's structural characteristics and potential seismic hazards. Ultimately, the goal of seismic assessment and retrofitting is to improve the building's seismic performance and reduce the risk of damage or collapse during a seismic event. In conclusion, incorporating pushover analysis and capacity curves in the seismic assessment and retrofitting of irregular buildings can help ensure that the retrofitting measures implemented are efficient, effective, and cost- effective, and ultimately improve the safety and resilience of the building during seismic events.