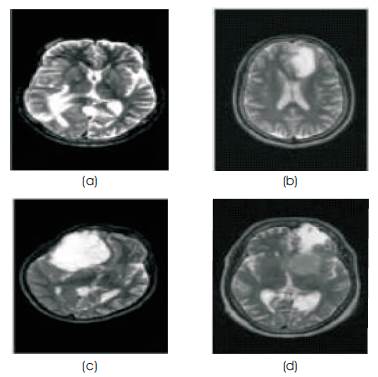
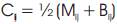
Figure 1. Sample database: (a) Metastase (b) Glioma ( c) Astrocytoma (d) Meningioma
In Medical Image Processing, Brain Tumor extraction is one of the challenging tasks; since brain image are complicated and tumor can be analyzed only by expert physicians. The location of tumors in the brain is one of the factors that determine how a brain tumor effects an individual's functioning and what symptoms the tumor causes. The authors have proposed a methodology in this paper that integrates k-means clustering and watershed algorithm for tumor extraction from 2D MRI (Magnetic Resonance Imaging) images. The use of the conservative watershed algorithm for medical image analysis is pervasive because of its advantages, such as always being able to construct an entire division of the image. On the other hand, its disadvantages include over segmentation and sensitivity to false edges. The k-means clustering algorithm is used to produce a primary segmentation of the image before we apply watershed segmentation algorithm to it, which is an unsupervised learning algorithm, while watershed segmentation algorithm makes use of automated thresholding on the gradient magnitude map. It can be observed that the method can successfully detect the brain tumor size and region.
Brain Tumor is an abnormal mass of tissue in which cells grow and multiply uncontrollably, seemingly unchecked by the mechanisms that control normal cells. Brain tumours can be primary or metastatic, and either malignant or benign. A metastatic brain tumor is a cancer that has spread from elsewhere in the body to the brain [1-3].
Magnetic Resonance Imaging (MRI) is an advanced medical imaging technique used to produce high quality images of the parts contained in the human body MRI imaging is often used when treating brain tumours, ankle, and foot. From these high-resolution images, we can derive detailed anatomical information to examine human brain development and discover abnormalities. Nowadays there are several methodology for classifying MR images, which are fuzzy methods, neural networks, atlas methods, knowledge based techniques, shape methods, variation segmentation.
Image segmentation is the primary step in image analysis, which is used to separate the input image into meaningful regions. The watershed segmentation technique has been widely used in medical image segmentation. Examples include the work presented in [1], [2] which make use of the watershed transform to segment gray and white matter from Magnetic Resonance (MR) images. The algorithm originated from mathematical morphology that deals with the topographic representation of an image. The set of pixels with the lowest regional elevation corresponds to the regional minimum. The minima of an image are the groups of connected pixels with their grey level strictly lower than their local neighbouring pixels. The rainfall simulation describes that when rain falls onto the surface, any rain drop reaching a point in the surface will flow along its steepest descent until it reaches a minimum. The paths of pixels, which converge towards a common minimum, constitute a catchment basin. Watersheds are the elevated areas that divide the different catchment basins. The partitions, which we aim to obtain, are the catchment basins, and the boundaries between the partitions are the watersheds.
Advantages of the watershed transform include the fact that it is a fast, simple and intuitive method. More importantly, it is able to produce a complete division of the image in separated regions even if the contrast is poor, thus there is no need to carry out any post processing work, such as contour joining. Its drawbacks will include over-segmentation and sensitivity to noise.
There has also been an increasing interest in applying soft segmentation algorithms, where a pixel may be classified partially into multiple classes, for MR images segmentation [4-6]. The Fuzzy C-means clustering algorithm (FCM) is a soft segmentation method that has been used extensively for segmentation of MR images [8].However, its main disadvantages include its computational complexity and the fact that the performance degrades significantly with increased noise. K-means clustering algorithm [8,9], on the other hand, is a simple clustering method with low computational complexity as compared to FCM. The clusters produced by k-means clustering do not overlap. In this work, the authors use k-means clustering to produce a primary segmentation of the image before we apply the improved watershed segmentation algorithm to the primary segmentation.
The previous methods for brain tumor segmentation are thresholding, region growing & clustering.
Thresholding is the simplest method of image segmentation. From a greyscale image, thresholding can be used to create binary images. During the thresholding process, individual pixels in an image are marked as "object" pixels if their value is greater than some threshold value (assuming an object to be brighter than the background) and as "background" pixels otherwise. This convention is known as threshold above. Variants include threshold below, which is opposite of threshold above; threshold inside, where a pixel is labelled "object" if its value is between two thresholds; and threshold outside, which is the opposite of threshold inside. Typically, an object pixel is given a value of “1” while a background pixel is given a value of “0.” Finally, a binary image is created by colouring each pixel white or black, depending on a pixel's labels [7-10].
The major drawback to threshold-based approaches is that they often lack the sensitivity and specificity needed for accurate classification.
The first step in region growing is to select a set of seed points. Seed point selection is based on some user criterion (for example, pixels in a certain gray-level range, pixels evenly spaced on a grid, etc.). The initial region begins as the exact location of these seeds.
The regions are then grown from these seed points to adjacent points depending on a region membership criterion. The criterion could be, for example, pixel intensity, gray level texture or colour.
Since the regions are grown on the basis of the criterion, the image information itself is important. For example, if the criterion were a pixel intensity threshold value, knowledge of the histogram of the image would be of use, as one could use it to determine a suitable threshold value for the region membership criterion [11-12].
A set of MR brain tumor images comprising of the four tumor types are collected from radiologists. The images used are 256*256 gray level images with intensity value ranges from (0 to 255). Initially, these MRI images are normalized to gray level values from (0 to 1). Since normalization reduces the dynamic range of the intensity values, feature extraction is made much simpler. Some samples have been shown in Figure 1.
Figure 1. Sample database: (a) Metastase (b) Glioma ( c) Astrocytoma (d) Meningioma
The proposed methodology is a 2-stage process. The first process uses K-means clustering to produce a primary segmentation of the Brain tumor image, while the second process applies the improved watershed segmentation algorithm to the primary segmentation of tumor to obtain the final segmentation of Tumor of MRI. The flowchart of the proposed methodology is shown in Figure 2.
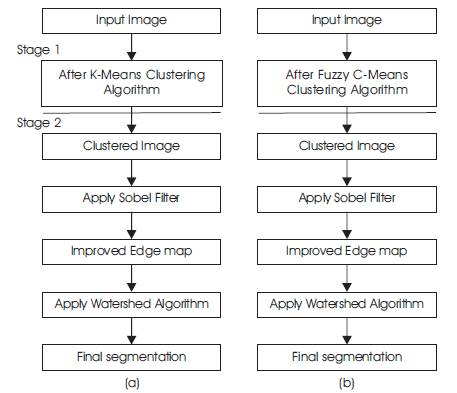
Figure 2. Flow diagram of proposed method using (a) k-means clustering (b) Fuzzy C-means clustering
We make use of K-means clustering algorithm, which is an unsupervised method, to provide us with a primary segmentation of the Brain tumor in MR image. From our previous work, we observed that there are many regions with similar intensities in a MR image of the head, which result in many local minima that increases over segmentation, when we apply the watershed algorithm. The coarse areas are smoothened in the primary segmentation. K-means clustering is used because it is simple and has relatively low computational complexity.
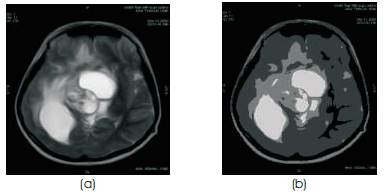
Figure 3(a). MR image (b) MR image after k-means Clustering
In addition, it is suitable for biomedical image segmentation as the number of clusters (K) is usually known for images of particular regions of human anatomy [11]. MR image of the head generally consists of regions representing the bone, soft tissue, fat and background. Hence we select K to be 4. Initial cluster centers are chosen in a first pass of the data. The dataset is partitioned into K clusters and the data points are randomly assigned to the clusters resulting in clusters that have roughly the same number of data points. For each data point, we calculate the Euclidean distance from the data point to the mean of each cluster. If the data point is not closest to its own cluster, it will have to be shifted into the closest cluster. If the data point is already closest to its own cluster, we will not shift it. The process continues until cluster means do not shift more than a given cut-off value or the iteration limit is reached. The result of the Brain tumor MR image in Figure 3(a), after K-means clustering, is shown in Figure 3(b).
Fuzzy C-means clustering (FCM), also called as ISODATA, is a data clustering method in which each data point belongs to a cluster to a degree specified by a membership value. FCM is used in many applications like pattern recognition classification image segmentation FCM divides a collection of n vectors c fuzzy groups and finds a cluster center in each group such that a cost function of dissimilarity measure is minimized. FCM uses fuzzy partitioning such that a given data point can belong to several groups with the degree of belongingness specified by membership values between 0 and 1.This algorithm is simply an iterated procedure. The result of the Brain tumor MR image in Figure 4(a), after Fuzzy C-means clustering, is shown in Figure 4(b).
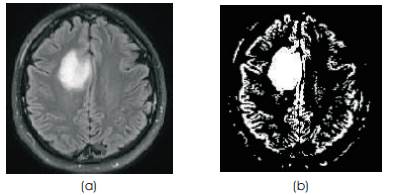
Figure 4(a). MR image (b) MR image after Fuzzy C-means Clustering
The gradient magnitude of the primary segmentation is obtained by applying the Sobel operator. The Canny edge detector was also experimented on, but it was found that the results obtained by both methods are comparable. Hence, we Decided on the Sobel filter as the Canny edge detector has higher complexity. In addition, the Sobel filter has the advantage of providing both a differencing and a smoothing effect [12].
Unlike the conventional watershed algorithm, we perform thresholding on the gradient magnitude image to reduce the number of false edges. We introduce an automated thresholding technique in [10]which is based on the histogram of the normalized gradient magnitude. All edge map pixels with values greater than the threshold retains their original values, while those edge map pixels with values less than the threshold had their values set to zero.
The rainfall simulation is then applied on the improved edge map. The steepest descent of rainfall is implemented by using a 3 x 3 window centred on each pixel of the gradient map. We compute the steepest gradient direction from its 8-connected neighbouring pixels. The neighbouring pixel along the steepest direction is marked and the window shifted along that direction. The process of marking pixels and shifting window is repeated until the path reaches a minimum.
The pixels constituting the path adopt the label of that minimum. Repeat the rainfall simulation by tracing a path of steepest descent for all pixels that are unlabelled. The paths reaching a common minimum adopt the same label as that minimum, and constitute a catchment basin, which refers to a partition in the image. These partitions constitute the initial segmentation map.
The initial segmentation map is heavily over segmented. Hence the authors implement a post-segmentation merging process in our improved watershed algorithm. This is unlike the conventional algorithm. The objective of this post-segmentation merging step, which is based on spatial criteria, is to reduce the number of partitions significantly without affecting the accuracy of the segmentation map. We provide a description of this post-segmentation merging step here:
After determining Cij for all partitions i and j, we decide on Cij the threshold Tc which Cij must satisfy before partitions i and j can be merged. If Cij is less than Tc , it implies that partition i and partition j are similar based on the spatial criterion set and hence they should be merged. We make use of the automated thresholding technique described earlier in this section to determine Tc. The full details of the improved watershed segmentation algorithm can be found [10].
In this paper the authors extracted the tumor from MR images by using k-means clustering and Watershed algorithm. We have applied our proposed methodology on different 2D MR images of brain tumor and segment the tumor region. Test Images are shown in Figure 5. After detetction of tumor region we have calculated the Area of Tumor. For segmentation we have applied two clustering method, k- means clustering and Fuzzy c-means clustering. We have compared both clustering method and after that we apply the watershed algorithm and we calculate the region and area of tumor.
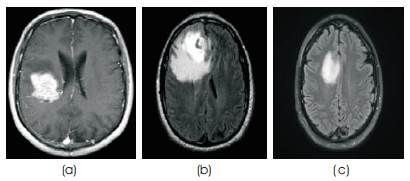
Figure 5. Test Brain Tumor MR Images
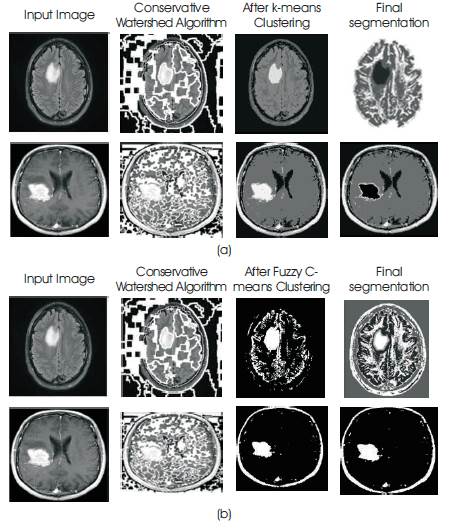
Figure 6. Comparing segmentation maps obtained using (a) k-means (b) Fuzzy C-means clustering against conservative watershed method
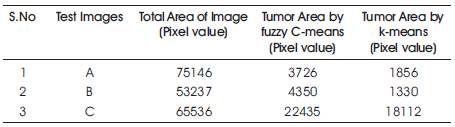
Table 1. Comparison of Results
Table 1 shows the comparison of segmented result of different clustering method and Figure 6. shows the result of clustering by k-means and C-means method with watershed algorithm. They have calculated the area of tumor by Cmeans then we get over segmented area of tumor which is not correct. But when we calculate the area of tumor by using k-means then we get exact area of tumor region. k-means method calculates the area of MRI data excluding tumor region; for calculation of area of tumor first we calculate the total area then We subtract the area which is calculated by kmeans and we get actual area of tumor region.
Methods which integrated the K-Means clustering algorithm with the marker controlled watershed segmentation algorithm and Fuzzy C-Means clustering algorithm with the marker controlled watershed segmentation algorithm have been proposed. It addressed the limitations of the conservative watershed algorithm, which included over segmentation. The experimental results shown that our proposed methods of using k-means clustering and Fuzzy C-means clustering exclusively to obtain a primary segmentation of MR brain images before applying the marker controlled watershed segmentation to them is effective. And integration of Kmeans clustering with marker controlled watershed algorithm gave better segmentation than integration of Fuzzy C-means clustering with marker controlled watershed algorithm. By reducing the amount of over segmentation, we obtained a segmentation map which is more diplomats of the several anatomies in the medical images.