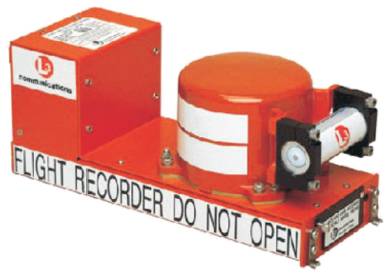
Figure 1. Flight data recorder (L-3 Aviation Recorders, 2011)
There has been much research in recent years dealing with many crucial interests for flight data recorders (FDR). However, there has been little or no research dealing with the localization of FDRs in the event of a crash. One particular scenario of importance is the localization of FDRs in the ocean, which covers 71% of the Earth's surface. In order to quickly locate lost FDRs in the ocean, a secured wireless network is utilized where each node is mounted on a buoy with an identification tag. This network of buoys is released at an estimated crash site at random locations within pre-defined vicinity. Each buoy is equipped with an ultrasonic sensor, which is tethered to the bottom of the buoy at a specific depth. MATLAB simulations have been implemented to study the feasibility of the proposed methodology, considering various numbers of buoys, days allowed to drift, and miles traveled per day. The experimental results showed that percentage of success in finding the vicinity of the FDR was between 8.9% and 100% depending upon parameters of buoys, days, and miles, by using the Monte Carlo method.
A flight data recorder (FDR) is an imperative tool utilized in commercial aircraft to give answers in the event of an accident. This is accomplished by the FDR recording key information before a crash such as aircraft parameters, conversation, and other audible cockpit noises. An issue, however, is locating the FDR after an aircraft goes down, particularly in deep sea environments. Therefore, this paper details a localization scheme for FDRs in an ocean setting by using a secured wireless network of buoys.
Currently, there has been much research dealing with FDRs such as: (1) data storage (Ali, Bhagavathula, & Pendse, 2004); (2) data networks (Thanthry, Ali, & Pendse, 2006); (3) flying quality assessments (Hsu, Chiang, & Yang, 2010); (4) memory technologies (Conquest & DeMyer, 1991); (5) intelligent FDR systems (Levine, 1998); (6) lowoverhead hardware recorders for cache-coherent multiprocessors (Xu, Bodik, & Hill, 2003); (7) virtual flight data recorders using neural networks and fuzzy logic (Napolitano et al., 1999);. and (8) high impact resistant recorders (Hill-Lindsay & Yuen, 1994). Data storage research in (Ali, Bhagavathula, & Pendse, 2004) deals with transferring acquired sound, video, and data either through an internet protocol (IP) link or downloading to ground station servers. This would, in essence, eliminate the need for traditional aircraft FDRs. Data networks research in (Thanthry, Ali, & Pendse, 2006) works with the security of aircraft data networks (ADN) for transporting critical information (e.g., cockpit recordings, aircraft parameters, etc.) through the internet. The viability and need are determined in this work for a security mechanism dealing with ADNs. Flying quality assessments are studied in (Hsu, Chiang, & Yang, 2010) which studies flight accident reports of cases associated with weather hazards. The FDR data from these accidents are processed using the Extended Kalman Filter (EKF) and the radial based function neural network (RBFNN) method to estimate unrecorded parameters to better understand and negate the effects of weather hazards on aircraft. Memory technologies are investigated in (Conquest & DeMyer, 1991) to determine the best memory options for FDRs. Considered memory types includes: battery-backed static random-access memory (RAM); fullfeatured electrically erasable programmable read-only memory (EEPROM); flash EEPROM; and optical disks. Intelligent FDR systems are researched in (Levine, 1998), dealing with a worldwide, real-time remote monitoring and recording system for aircraft, named RAFT. This system takes an aircraft's FDR data and uses it in conjunction with an accident prevention system. A lowoverhead hardware recorder for cache-coherent multiprocessors is researched in (Xu, Bodik, & Hill, 2003). The significance of this recorder is that it is practical by piggybacking on the cache coherence hardware and minimal thread-ordering is logged for information necessary to replay multiprocessor execution. Virtual flight data recorders using neural networks and fuzzy logic are studied in (Napolitano et al., 1999). The use of these methodologies aids in dynamic parameters of aircraft control surface defections which are imperative in the investigation of an accident. High impact resistant recorders are investigated in (Hill-Lindsay & Yuen, 1994) which tests a unique crash-proof solid state FDR which uses nonvolatile flash erasable programmable read only memory (EPROM).
There has been substantial research work dealing with FDRs but nothing with localization in the event of an accident. This research paper aims to change that by offering a localization scheme for FDRs, lost in deep sea environments. This is accomplished by using a secured wireless network of buoys equipped with ultrasonic sensors. Simulations are administered in MATLAB with the Monte Carlo method which takes into account the various numbers of buoys (N), days allowed to drift (days), and miles traveled per day (miles). Success rates (S) are determined for each variable variation to determine the feasibility of the proposed scheme.
The purpose of a FDR (e.g., black box) is to record parameters of the aircraft, conversation, and other audible cockpit noises. Therefore, in the event of an aircraft crashing in the United States, the National Transportation Safety Board (NTSB) immediately begins the retrieval efforts preceding the accident. These FDRs, which cost between $10,000 and $15,000 each, contain imperative information in understanding the reasons for the accident, either human and/or mechanical. There are two types of FDRs that will be discussed: magnetic tape and solid-state technology.
FDRs, which use magnetic tape, were first introduced in the 1960s, which use a Mylar tape pulled across an electromagnetic head. However, FDR manufacturers are transitioning to solid-state technology which is considered much more reliable. Stacked arrays of memory chips without moving parts are used for solid state devices, contradictory to magnetic tape, which has moving parts. FDRs without moving parts create fewer maintenance issues and decrease the chances of malfunctions. Stacked memory boards are stored inside the crashsurvivable memory unit, a cylindrical compartment on the recorder, which is shown in Figure 1 (L-3 Aviation Recorders, 2011). The recorder displayed in the photo, made by L-3 Communications, can store two hours of audio data and 25 hours of flight data. Power for the FDR is obtained through two power generators which draw power from the aircraft's engines. The first generator is a 28V DC power source and the second is a 115V, 400Hz AC power source.
Voice recordings from the cockpit are collected through several microphones that track the conversations of the flight crew and noises of the cockpit. These recordings are sent to the associated control unit which pre-amplifies the audio, which then, is digitized and stored. Locations of microphones used for collecting sound data includes: pilot's headset; co-pilot's headset; headset of third crew member and at the center of the cockpit.
In the United States, the Federal Aviation Administration (FAA) issued a Code of Federal Regulations that requires the FDR to collect a minimum of 88 parameters for aircraft manufactured after August 19, 2002. There is a variety of flight data that is recorded from an aircraft, which includes: time; pressure altitude; airspeed; vertical acceleration; magnetic heading; control-column position; rudder-pedal position; control-wheel position; horizontal stabilizer and fuel flow. Currently, magnetictape recorders can record up to 100 parameters and solid-state recorders, 700 parameters.
FDRs are also built to withstand airline accidents, by enduring extreme heat, violent crashes, and extreme pressure. This is accomplished by using three layers of materials: aluminum housing; high-temperature insulation and a stainless-steel shell. In order to test the quality and survivability of FDRs, there are seven tests, which includes: crash impact; pin drop; static crush; fire test; deep-sea submersion; salt-water submersion and fluid immersion.
In the event of a crash, a FDR is painted bright orange along with strips of reflective tape attached to the FDR's exterior, to aid investigators in the localization. In the case of an accident over the ocean, FDRs are equipped with an underwater locator beacon, shown in Figure 2 (L-3 Aviation Recorders, 2011), which is the white cylindrical object attached to the frame. This beacon, once submerged under water, sends out a 37.5 kHz pulse every second for 30 days and has the ability to transmit sound as deep as 14,000 feet (equal to 4,267 meters and 2.65 miles). The beacon is powered by a battery with a shelf life of six years.
Figure 1. Flight data recorder (L-3 Aviation Recorders, 2011)
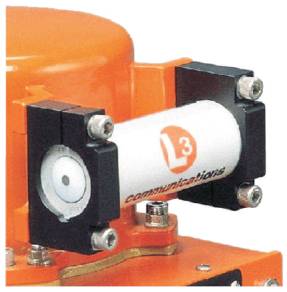
Figure 2.Underwater locator beacon of flight data recorder (L-3 Aviation Recorders, 2011)
The localization of FDRs is accomplished by using a secured wireless network of N buoys, which communicate with master and slave buoys (i.e., nodes) in a star topology network, shown in Figure 3. Buoys are dropped at random points within the estimated crash site (i.e., vicinity of interest), where each buoy is equipped with an ultrasonic sensor, which has the ability to acquire ultrasonic pulses from the FDR's underwater locator beacon. An ultrasonic sensor is tethered to the bottom of each buoy, which is assumed to have the ability to dynamically change the tether length depending on the ocean's depth at the buoy's current location. The power source for each buoy is assumed to be a combination of solar and battery power.
Once N buoys are randomly dropped in the vicinity of interest, buoys are left alone and allowed to drift for a specific number of days (days). Throughout this period, ultrasonic sensors are used to procure ultrasonic data. If an ultrasonic signal is acquired, the secured wireless network is utilized to send this information to the master buoy (i.e., master node). The master node then transmits this data to a base station (e.g., office, ship, etc.) for further analysis.
The feasibility of the proposed localization scheme for FDRs in deep sea environments was investigated by simulating different scenarios. Each scenario constitutes a variation of different variables such as the size of the vicinity of interest (50x50, 100x100, and 200x200 square miles), the number of buoys (N = 25, 50, and 100), the number of days buoys are allowed to drift (days = 10, 20, and 30), and the average number of miles assumed to be traveled by each buoy in the secured wireless network (miles = 10, 15, and 20). The success rate (S) for each variation of described variables is determined using MATLAB simulations and the Monte Carlo method. The sub-section below describes the algorithm utilized for this research.
The simulation algorithm used for this research is shown in Figure 4. The user defined inputs are: dimensions for the vicinity of interest; the number of grid divisions for the vicinity of interest; the number of buoys (N) in the secured wireless network; the number of days allowed for N buoys to drift in the vicinity of interest and the average amount of miles traveled by each of the N buoys. The output of the algorithm is the success rate (S) of finding the FDR based on the number of Monte Carlo repetitions (M) which is set to 1,000. Based on the Law of Large Numbers, when M = 1,000, error is equal to 3.16% where convergence occurs at 1/(square root of 1,000).
The algorithm begins by generating a 2-D grid map (G) based on user-defined dimensions for the vicinity of interest. The success rate in finding the FDR is determined using the Monte Carlo method, represented inside the first for loop with M repetitions. Inside this loop, a random location for the missing FDR is generated within the vicinity of interest. Ultrasonic values are then generated for each grid point based on the randomly generated location of the missing FDR. The ultrasonic pulse signal generated by the FDR's underwater locator beacon has a radius of 14,000 feet (equal to 4,267 meters and 2.65 miles). N points in the vicinity of interest are randomly generated for the N buoy's starting locations. A nested for loop with N iterations is then utilized to generated paths for each of the N buoys. Another nested for loop with the total number of movements between grid points being the number of iterations, totMov = days * miles, is used to randomly generate the N buoy paths. The random buoy movements are then compared with the ultrasonic signal area of the missing FDR. If any buoy has traveled over this region, the posCount variable is iterated by 1 and the Monte Carlo repetition is considered to successfully find the missing FDR. After all M repetitions have been successfully run, the success rate (S) is calculated by: S = (posCount / M) * 100 for the scenario being simulated.
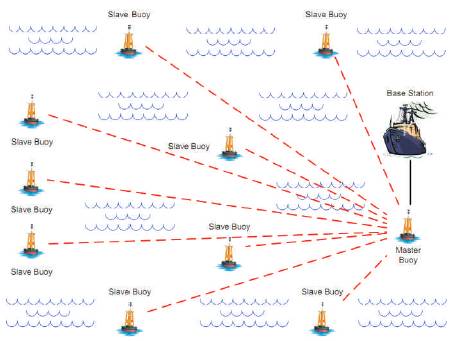
Figure 3.Conceptual diagram of secured wireless network for flight data recorder localization
Every scenario: number of buoys (N = 25, 50, and 100); number of days buoys are allowed to drift (days = 10, 20, and 30) and average number of miles each buoy travels per day (miles = 10, 15, and 20) is simulated using the algorithm shown in Figure 4, to determine the success rate based on the Monte Carlo method. Table 1 displays the success rate for each variation with areas of 50x50, 100x100, and 200x200 square miles. A histogram of success rates for all variations is conveyed in Figure 5, which is an exponential distribution.
There are four lessons learned about the proposed scheme, learned from results shown in Table 1: as the number of buoys increases, the success rate increases; as the vicinity of interest increases, the success rate decreases; as the number of days increases for allowing buoys to drift, the success rate increases and as the number of average miles traveled per day for buoys increases, the success rate increases. These lessons learned are shown in Figures 6 and 7. The success rate vs. the number of buoys (Figure 6) expresses that the success rate increases as the number of buoys increase. It also conveys that as the number of days increases, the success rate increases as well. Area vs. success rate (Figure 7) communicates a decrease in success rate when the vicinity of interest increases. It is also shown that as the average amount of miles traveled per day by buoys increases, the success rate as well increases.
One particular variation for a 200x200 square mile area with N = 100, days = 30, and miles = 15 is reviewed to give a visualization of the proposed scheme. Figure 7 exhibits the generated 2-D grid on a spatial plane, which represents the 200x200 square mile area. On this grid plane, a random location is generated, which represents the missing FDR. The area around this location has a radius of 2.65 miles, which represents the area of the ultrasonic pulse signal generated by the underwater locator beacon. Figure 8 represents the 100 randomly placed buoys and movement over 30 days, where each buoy travels 15 miles per days.
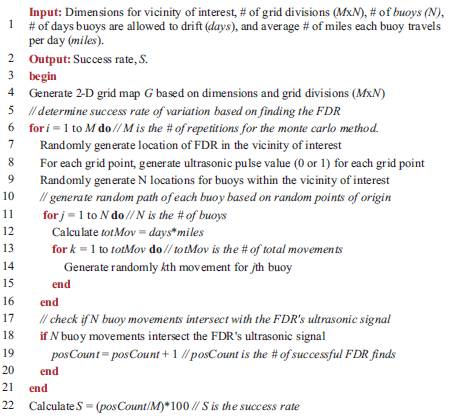
Figure 4. Simulation algorithm for flight data recorder localization
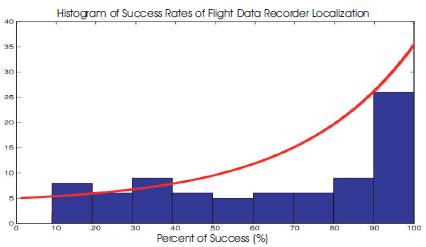
Figure 5. Histogram of success rate of all variations
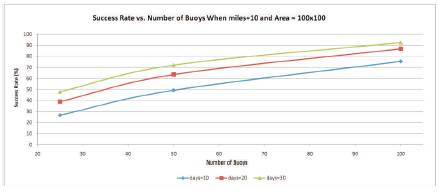
Figure 6. Success rate vs. number of buoys
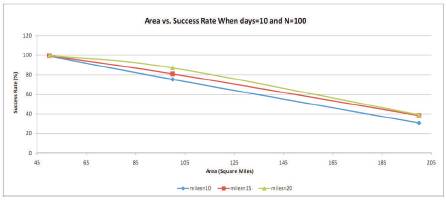
Figure 7. Area vs. success rate
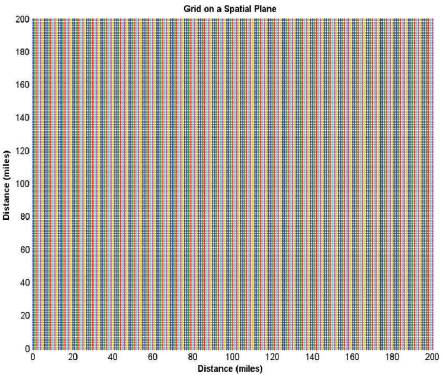
Figure 8. Generated grid points on a user-defined spatial plane
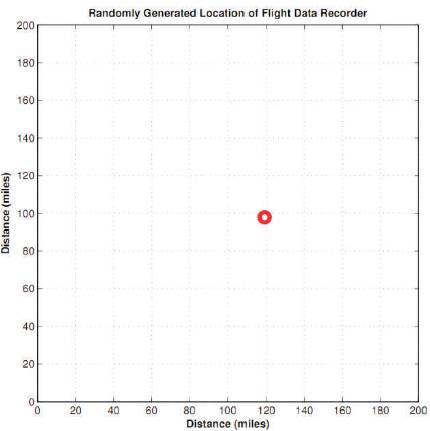
Figure 9. Randomly generated location and area of ultrasonic signal of flight data recorder
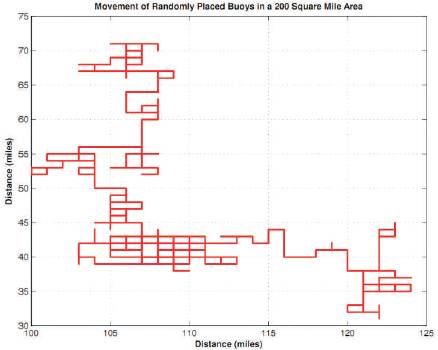
Figure 10 Random movement of N buoys in the secured wireless network
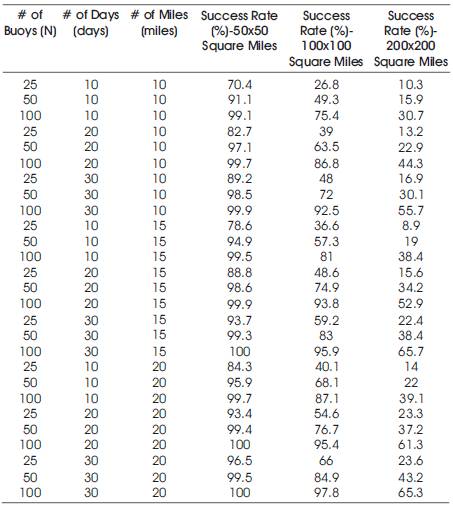
Table 1. Simulation results (area=50x50 square miles)
The proposed localization scheme for FDRs missing in deep sea environments is reviewed and statistically analyzed using the Monte Carlo method to determine the feasibility. The percentage of success in finding the vicinity of the FDR using the proposed methodology is found to be between 8.9% - 100% with N = 25 - 100, days = 10 - 30, and miles = 10 - 20 using the Monte Carlo method. Based on the results, it is shown that: as the number of buoys increases, the success rate increases; as the vicinity of interest increases, the success rate decreases; as the number of days increases for allowing buoys to drift, the success rate increases and (4) as the number of average miles traveled per day for buoys increases, the success rate increases.
Future work pertaining to the proposed localization scheme for missing FDRs in deep sea environments is to create more realistic environments for simulations. This is possible by simulating ocean currents to determine buoy paths instead of assuming random directions and distances. Another modification would be to vary the depth of the ocean within the vicinity of interest using 3-D grid maps while simulating dynamic tethering lengths of the ultrasonic pulse sensor from the buoy.