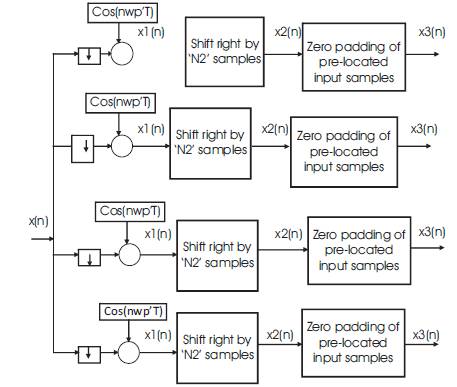
Figure 1. Block diagram representation – Proposed method for generation of input signal to the individual stage of bandpass filter bank
Digital filtering is considered to be crucial operator in reconstruction and visualization of information, besides amounting to increase in computational efficiency. The FIR based digital filter bank is more effective in respect of above advantages. In this paper, we propose a novel approach in Multirate technique through Digital filter bank method, based on Modified Kaiser window. A remarkable spectral output is achieved by way of increase in magnitude, quality of output, better frequency response and computational efficiency. The simulation results are added on account of satisfactory performance and comparison is drawn to enlighten the advantages in the proposed method. This type of filter bank is particularly suitable in a typical hearing aid application to achieve significant merits for improving output quality.
Many applications need effective detection of signals mainly in terms of amplitude and frequency components, which become easier in processing of signals and implementation of hardware at the succeeding stages, thus enabling to achieve a most significant output. In this connection, the role of bandpass filter is utmost form of concern for selection of desired frequency and quality of response, in addition, it be computationally efficient. The FIR based band pass filter bank is adopted for achieving more effectiveness in respect of the advantages, as specified. The filter bank is designed based on Modified Kaiser window as this method is effectively implemented with a novel approach in Multirate processing technique. This method has been drawn with enhanced characteristics in respect of passband ripple, stopband attenuation, peak response and quality output when compared with methods [7,9]. The actual part of work is a new technique in Multirate digital signal processing, in which, the Input signal generation and filter bank design are implemented at much reduced sampling frequency. This possibility is arrived because of performing heterodyning operation upon input, generated at band of interest. This process converts the frequency band of input signal to lowest possible frequency band, that is, from '0' Hz.. This method of technique has been arrived with a great reduction in computational complexity because of great reduction in number of input samples and filter order in coherence to the specified advantages. This method is well described in this paper with the help of analytic equations. The simulation results and performance characteristics are drawn to verify with the facts. This method is particularly verified at lower frequencies because of quality assurance, implemented even at higher frequencies and so chosen with the input signal as 'Cosine function' as this function represents the real time signals in most Applications.
There is scope of possible enhancement in passband ripple, stopband attenuation, corresponding to possible enhancement in peak response and quality output with respect to the results, clarified by authors [7,9]. In addition to these, there is a possibility of improvement in computational efficiency. For these reasons, their proposed method of spectral analysis is suggested to overcome the specified disadvantages among these methods, depicted for various applications.
Figure 1. Block diagram representation – Proposed method for generation of input signal to the individual stage of bandpass filter bank
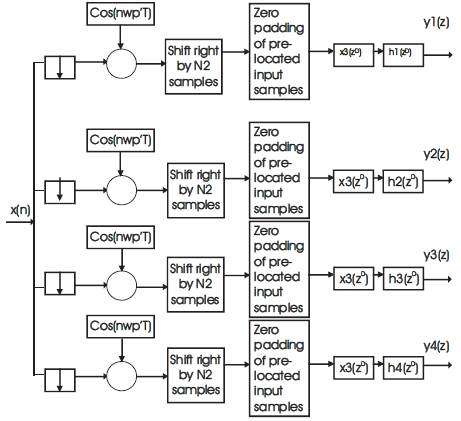
Figure 2. Block Diagram representation – Proposed method for frequency domain response of individual stage of Bandpass Filter Bank.
This method of approach is arrived through partial modification of designated parameters in the existing Kaiser window method [6].
The frequency response of bandpass filter is given as
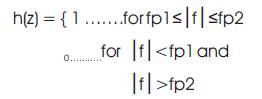
Where fp1 is lower pass band frequency and fp2 is higher pass band frequency.
The desired impulse response is given by hd(n).
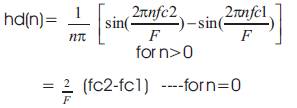
Where fc1=fp1-(df/2), fc2=fp2+(df/2)
df2=fp1-fs1,df3=fs2-fp2
where df=min{df2,df3},
F=Sampling frequency
fs1=Lower stop band frequency
fs2=Upper stop band frequency
n=integer
N=Order of the filter
The frequency response of the hd(n) is given by h(z).
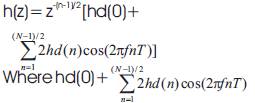
represents the magnitude response equation, where T=1/F.
The basic Kaiser window function
Where‘A' is an independent variable empirically determined by Kaiser.
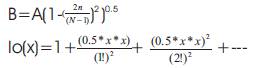
This series converges rapidly and can be computed upto 25 terms to attain the desired accuracy. While considering the bandpass specifications, where the passband ripple(Ap) and minimum stopband attenuation (As) in decibels are given by
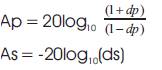
The 'ds' and 'dp' can be determined as
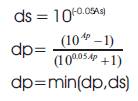
The actual stopband attenuation is arrived to be,
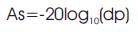
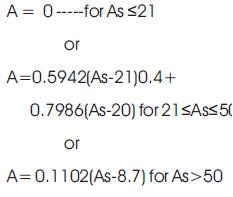
The value of 'A' is determined from the emperial design equation
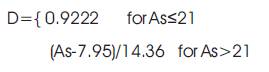
A parameter 'D' is determined from the emperical design equation
The filter order for the lowest odd value of 'N', calculated to be
The order of the filter increases with increase in the sampling frequency or decrease in the transition width.
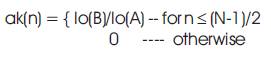
Finally the impulse response of the filter is determined as
where ak(n) and hd(n) are window coefficients and desired impulse response respectively.
The frequency response and the output response of the filter bank are plotted according to Modified Kaiser window approach, as shown in Figures 3 & 4 respectively. It is observed that a better spectral response with improvement in pass band ripple and quality of output are attained as compared to the methods of reference (1,6). This novel approach of filter bank design has brought attractive advantages in the proposed method of filter bank response, which follows.
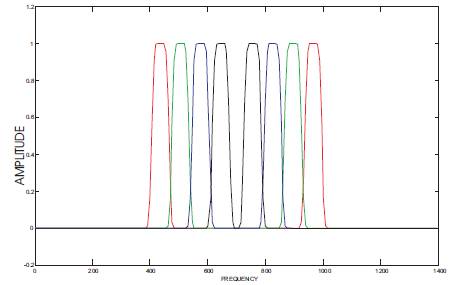
Figure 3. Frequency Response of the existing method of Bandpass filter bank over 400 Hz. to 680 Hz. (Using Modified Kaiser window)
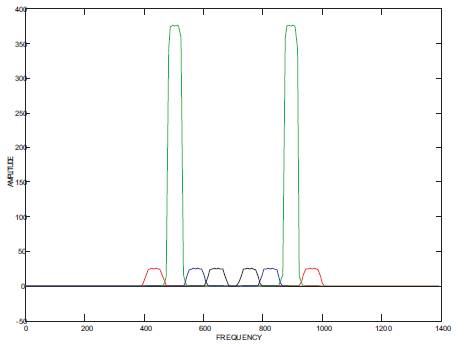
Figure 4. Output response of existing method of bandpass filter bank for the input signal band of frequencies from 480 Hz to 530 Hz (Using Modified Kaiser method)
The proposed method is a new technique in Multirate processing, that is appended to filter bank to cause a great reduction in Computational complexity and hardware complexity, in addition to much improvement in spectral response than earlier methods [7,9]. In this technique, each sample is multiplied by a constant, derived by cosine function which is related to starting frequency of band of interest and starting frequency of the modified input signal. Now the modified input samples are right shifted by 'N2' samples as determined by number of frequency points of output response, as shown in the Figure 1. The number of th frequency points are taken as  of sampling frequency. The pre-located input samples are zero padded. This technique of time domain shifting and zero padding at selected points of input as mentioned in the novel approach has created a new dimension to arrive significantly a quality output.
From Figure 1, the signal conversions at various points upon input signal can be considered in the form as mentioned below.
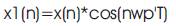
where wp' is the starting frequency of input signal band in rad/sec. and x(n) is the input signal, where n=0,1,2,------ (N1-1).
where n=0,1,2,------------(N1-1)
Where 'N1' are number of input samples as corresponding to the sampling frequency,
'F' and 'N2' are number of shifted samples as earmarked by number frequency points in the output response.
Finally the frequency response of x3(n) is carried out at decimated sampling frequency as given by the relation
F'=decimated sampling frequency so that the Decimation factor 'D' = F/F',
'f' = A frequency point at which the amplitude response is deduced. Depicting the subsequent procedure, Figure 2 shows the structure of bandpass filter bank with reference to Figure 1.
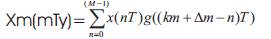
Let x(nT) be the input signal with number of input samples be 'N1'.
The decimated output of original input signal is taken by using the Interpolation formula as given below.
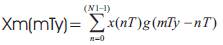
Where 'T' is the original sampling period and Ty is the sampling period of decimated output.
'n' and 'm' are the sample numbers of original and modified input signals respectively.
Where g(t) is given as
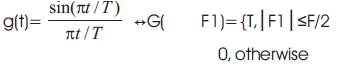
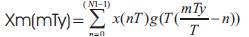
The equation(2) can be written as below for suitable representation in different form as given in eqn. (3).
The term  can be decomposed into an integer part 'km' and a fractional part Δm, 0≤Δm≤1, as
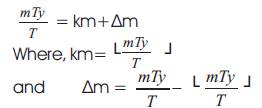
The symbol └a┘denotes the largest integer contained in 'a'. The quantity 'Δm' specifies the position of the current sample within the sample period 'T'. Substituting Eq.(4) into Eq.(3), it is obtained as
Where 'M' are number of input samples of the modified Input as the samples are taken at the decimated sampling frequency.
Eq.(5) provides the fundamental equation for the discrete implementation of sampling rate conversion [3].
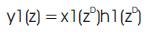
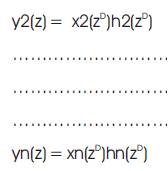
As in Figure 2, the frequency response of each bandpass filter is taken as h1(z D), h2(zD )….hn(zD ) and the output response of each band pass filter in the filter bank is arrived such that
The methodology and advantages have been discussed by the following example. Assuming the input signal to be in the frequency range between 410 Hz. and 670 Hz, the sampling frequency becomes 2*700=1400 Hz. The sampling frequency is reduced to 800 Hz by a decimation factor 'D' such that the value 'D' can be arrived as (1400/800). The decimated sampling frequency is so selected that the frequency modified input signal result in without Aliasing. The filter bank is designed between 0 Hz. and 280 Hz corresponding to the input signal band between 410 Hz. to 670 Hz as the original frequency band is shifted correspondingly between 10 Hz and 270 Hz. The filter bank consists of 4 stages and each stage has got a bandwidth of 50 Hz. The shifted pass band and stopband frequencies of these stages are as shown in Table 1.
Where,
fs1 is lower stop band frequency
fp1 is lower pass band frequency
fp2 is upper pass band frequency
fs2 is upper stop band frequency.
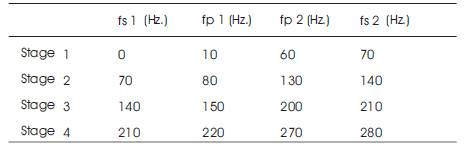
Table1. Passband and stopband frequencies of proposed method
Initially the specifications of pass band ripple and stopband attenuation are assumed as 0.5 & 35 db respectively. As per design constraints, these specifications are drawn with better values and better spectral output as compared to the simulation results of the methods [7,9] and rather designed with Modified Kaiser window as shown from Tables 2 to 5, where, as an example, the input frequency band is selected from 480 Hz to 530 Hz..The similar advantages are arrived for other frequencies of input band, as shown from these results. The proposed filter bank frequency response and its output response are plotted as shown in Figures 5 and 6 respectively for the input signal generated at frequencies between 410 Hz and 460 Hz. As a result, the first band pass filter only exhibited response with an improvement in specifications like peak response, passband ripple, stopband attenuation and quality of spectral output as compared to the methods [7,9]. The similar response is arrived for 2nd , 3rd and 4th stage bandpass filters, as shown in Figures 7,8,9 respectively, for the input signal generated at frequencies between 480 Hz - 530 Hz., 550 Hz. – 600 Hz. and 620 Hz – 670 Hz respectively. Calculation of Computational efficiency is carried out by performing number of computations required. For calculating total computations, it is required to first calculate the computations for single stage band pass filter. The number of Multiplications (MPS) and additions (ADS) required for each stage band pass filter and subsequent computations for number of stages are given by equations as follows.
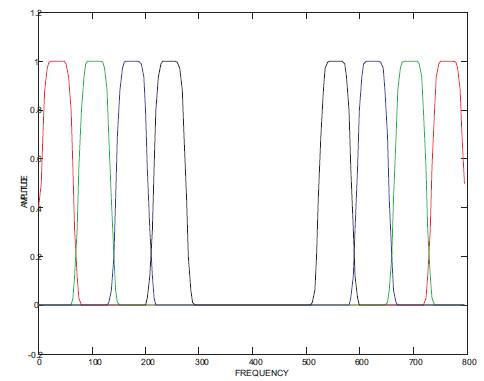
Figure 5. Frequency response of proposed method of bandpass filter bank(using Modified Kaiser window)
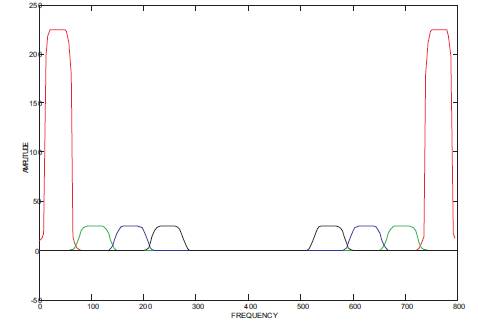
Figure 6. Output response of first stage of bandpass filter bank for the input signal of frequencies from 410 Hz. to 460 Hz. of Proposed method
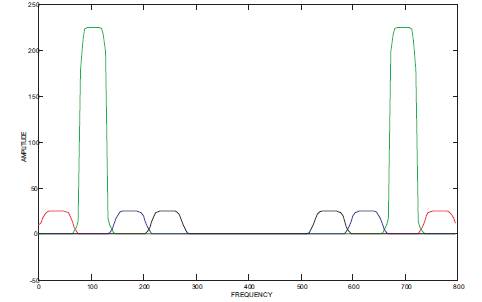
Figure 7. Output response of second stage of bandpass filter bank for the input signal band of frequencies from 480 Hz. to 530 Hz. of proposed method
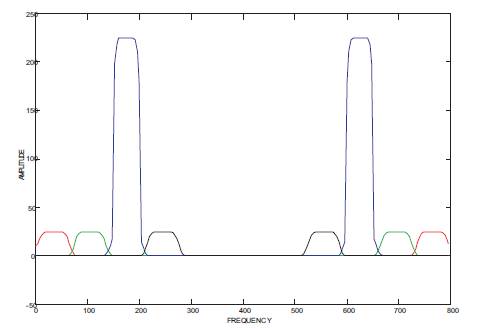
Figure 8: Output response of third stage of bandpass filter bank for the input band of frequencies from 550 Hz. to 600 Hz.
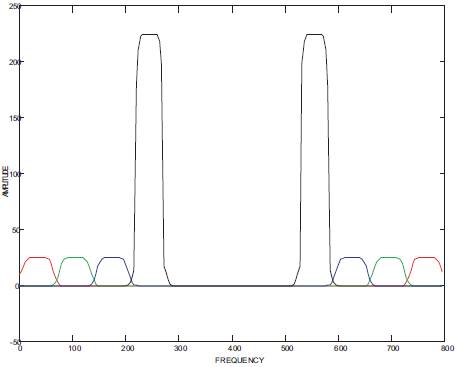
Figure 9. Output response of first stage of bandpass filter bank for the input signal of frequencies from 410 Hz. to 460 Hz. of Proposed method

Table 2. Amplitude response of the exis-method for the input signal band of frequencies from 480 Hz. to 530 Hz. (Using Modified Kaiser Window)
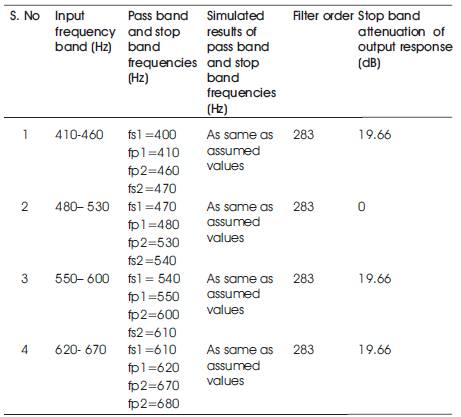
Table 3. Values of filter parameters as per simulation results of existing method for the input signal band of frequencies from 480 Hz to 530 Hz.(As per Figures 3 & 4 (Using Modified Kaiser Window))
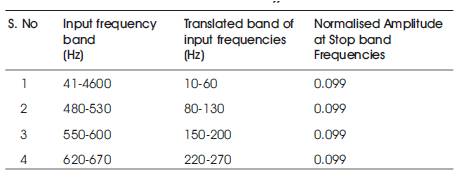
Table 4. Amplitude response of the proposed method
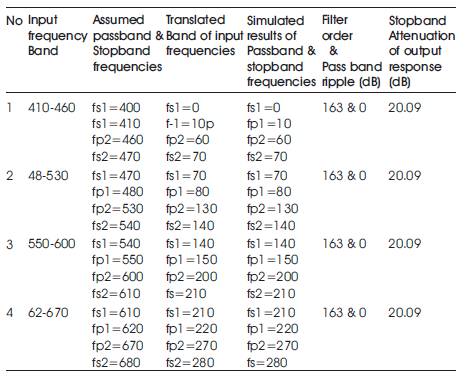
Table 5. Values of filter parameters as per the simulation results of proposed method
Initially the number of computations required for single stage bandpass filter are calculated, through which total computations required for number of stages are computed. Assuming the number of input samples to be 'S', the number of multiplications required for conversion of input signal band to lower frequency band = 'S'.
The number of multiplications required for obtaining input signal frequency response = KS.
Where, 'K' are number of frequency points in the frequency response.
The number of additions required for obtaining input signal frequency response = KS.
Let 'Q' be the order of the filter, then the number of multiplications required for obtaining the frequency response of single band pass filter = 'KQ'.
The number of additions required for obtaining the frequency response of single band pass filter = 'KQ'.
The number of multiplications required for obtaining the output response = 'K'.
As per above equations, the computations required are calculated subsequently for existing and proposed methods. The number of computations required are dependent on number of input samples and filter order. In addition, the quality of response is dependent upon the selection of number of input samples. For this reason, the number of input samples are taken at half of the sampling frequency so that the maximum quality in the response is achieved. More over, the number of computations required are reduced, when obtaining the response at reduced sampling frequency. Thus the number of input samples are arrived as N1=700 and M=400 for existing and proposed methods respectively. For existing method, the number of multiplications and additions required for single stage response are 197500 and 196600 respectively. Similarly, for the Proposed method, the number of multiplications and additions required are 113200 and 112600 respectively. In this example, for four stages, the number of multiplications and additions required for existing method are 790000 and 786400 respectively. But for the proposed method the multiplications and additions are arrived to be 452800 and 450400 only.
As the computational complexity is directly related to the design parameters such as number of input samples, sampling frequency and filter order, the computations required became lesser and optimally suitable to any application because, the proposed method of filter bank design is done at minimum possible values of these parameters by virtue of techniques presented in this paper. These techniques are implemented in MATLAB – 7.01 and results are simulated.
With the inception of elegant design techniques such as Modified Kaiser window and a Novel approach in the proposed method, the frequency response and the output response of digital bandpass filter bank are simulated and comparison is drawn with respect to Filter specifications, Spectral response and Computational complexity. The over all performance of the Digital filter bank is improved, as compared to the methods discussed earlier, in respect of Specifications, Spectral response and Computational complexity are as per the results published in Figures and Tables. These merits of filter bank analysis are able to draw advantages like, in compression techniques as of [8,10] and hearing loss compensation to improve the output quality especially in digital hearing aid applications.