
System Development Life Cycle (SDLC) is the total process involved from the inception of a system to the deployment of the system. The perfect choice of the System Development Life Cycle model to use for different system development stands as a challenge for organizations. The model used by the developers play a significant role in determining the outcome of the system. Therefore, there is need to critically look at the various characteristics of the models and the features of the system so as to determine which model is best suitable for the system. This research work reviewed three SDLC models which are Scrum, Rapid Application Development (RAD) and Prototyping model. Their pros and cons were highlighted, and when they are best suitable has also been mentioned. The models were compared with each other and the different features peculiar to each of the models were discussed.
A life cycle denotes a route from the origin or beginning to completion or user usefulness of a project, scheme, idea or product (Benediktsson et al., 2006; Gray et al., 2017). System Development Life Cycle (SDLC) is all the processes involved from the initiation of a software to the deployment of the software. It is also the approach for designing, building and maintaining information and industrial systems (Alshamrani & Bahattab, 2015; Radack, 2009; Ruparelia, 2010). SDLC binds phases that are important for the development of the systems, and these include planning, analysis, design, development, testing and deployment (Balaji & Murugaiyan, 2012).
The inception of development of software did not start with the SDLC models, but instead the “ad hoc” chaotic process of “code and fix” has been used where the development of the software did not follow any defined process and as a result may lead to more process (Sabale & Dani, 2012). Over the years, a lot of SDLC models have been developed to cater for the processes involved in the development and deployment of systems. These models are generally categorized into the traditional method and the agile method. The traditional method follows a path of development in which there is no provision of reviewing the phases that have been done; an example is the waterfall model. The agile method provides a review to the phases that have been done in form of iteration in case there is need for correcting something in the previous phase. An example is the Scrum model (Leau et al., 2012). Some are waterfall model, spiral model, Scrum, V-model, rapid application development, incremental, prototyping and so on (Bhuvaneswari & Prabaharan, 2013; Ghuman, 2013; Mishra & Dubey, 2013; Schwaber, 1997). These SDLC models share some basic properties like the phases involved to arrive at the final product, but also have their particular attributes which makes them best suited for the development cycle of some software.
This work compared three models of the SDLC namely; the Rapid Application Development (RAD), Prototyping and Scrum. These models were chosen because they are closely related in the process of executing them. The models were defined, the pros and cons of each of the three models were stated and where any model is best suited has been stated according to the survey that has been carried out among developers.
SDLC models have evolved over the years from the traditional code and fix, waterfall model and the big bang model to advanced models such as experimental, agile software process, rapid application development, and prototype approach (Alshamrani & Bahattab, 2015; Dora & Dubey, 2013; Mishra & Dubey, 2013; Radack, 2009; Sabale & Dani, 2012).
According to Nugroho et al. (2017) the SDLC phases are outlined as follows:
In this research, Rapid application development (RAD), Prototyping model and Scrum model are discussed. Although scrum falls under the agile methodology of software development, the three models are closely related in the process of executing them. Therefore there is need to assess these models by defining them, making known their advantages and disadvantages and the conditions the software has to meet before the usage of the models, i.e., when best to use the models.
In this model, a working model that is functionally equivalent to a subset of the product is built. The prototype must have been authenticated through communications with the clients so that the resulting specification will be correct. In the planning and design, authentication in specification is needed (Bhuvaneswari & Prabaharan, 2013; Ghuman, 2013; Mishra & Dubey, 2013). Beynon- Davies et al. (1999) identified 2 types of RAD project: the intensive and the phased. In the intensive RAD, the team work in a closed room till the end of the project while phased RAD distribute the project over a long period of time.
1.2.1.1 Advantages of RAD
1.2.1.2 Disadvantages of RAD
1.2.1.3 When to Use RAD
According to Dora and Dubey (2015), a prototype is a working model that is functionally equivalent to a component of the product. This prototype is reviewed by the end user and feedback is given to the developer who refines the prototype until the user is satisfied. In this model, a small prototype is started, then the waterfall process follows it. The first prototype is revised in successive loops, further requirements, designs, implementations are done (Berra, 2012; Ghuman, 2013).
1.2.2.1 Advantages of Prototyping
1.2.2.2 Disadvantages of Prototyping
After the functional requirement or the high priority user requirement has been satisfied, the user lose enthusiasm in the remaining part of the system. Therefore, the users are unwilling to spend resources and time to complete the system (Alavi, 1984).
1.2.2.3 When to Use Prototyping
1.2.3 Scrum
A Scrum is a game where every member of the team acts together to move the ball down to the field. Scrum has been developed by Schwaber (1994) and it involves every member of the team's participation. The team in Scrum is usually of small size. This model assumes that the development process or phases is not as predictable as in the other models and also a complicated process that can only be crudely defined. The Scrum sees the system's development process as a loose set of activities that combines known, workable tools and techniques with the best that a development team can devise to use. As the development process proceeds, the requirements is stabilized and the functional requirements are completed gradually (Bhuvaneswari & Prabaharan, 2013; Rising & Janoff, 2000; Schwaber, 1997).
1.2.3.1 Advantages of Scrum
According to Paasivaara et al. (2008), it is well suitable for global software development.
1.2.3.2 Disadvantages of Scrum
1.2.3.3 When to Use Scrum
This research is a survey focused on collecting primary data with questionnaires. This method has been used because it has been considered appropriate for collecting data from a given population with an intention to determine the opinion, attitudes and perception of personnel considering the variables under study. The sample population consists of both military and civilian students that are developers of Air Force Institute of Technology (AFIT), Kaduna, Nigeria. The random sampling technique has been used in selecting students from various departments of AFIT.
A structured questionnaire titled “A Survey Questionnaire for Software Development Life Cycle (SDLC) Models" has been used to gather information from the subjects. The choice of this instrument has been prompted by its reliability and validity of the answers. The instruments consist of five sections: A, B, C, D and E. Section A sought data on how familiar the respondents are with SDLC models and the Scrum, RAD and Prototype models of the SDLC. Section B requested data on the respondent's knowledge of the three SDLC models. They were allowed to vote for more than one of the models in each variable. These variables are determination of the final product and cost from the beginning, cost control, resource control, duration for the project to be completed, addition of the developer's creativity, responsiveness to changes from the environment, success probability rate and the model that allows overlapping. They were required to pick between the three models as compared with the other models. Section C contained software solution and the respondents were asked to pick which is the most suitable. They were allowed to vote for more than one of the models in each variable. Some of the software solutions asked are Tacker system, Student portal, Transportation System portal, Hospital management portal, Educational applications, Online calendar, Journal Processing and validation, Oil and gas applications, Chemical product costing, Online recruitment, Man power utilization tracking, E-commerce applications, Blogs, Android Applications, Mobile Recharge applications, Fingerprint based applications, Encryption applications, Online Electoral portal, Online booking applications, Online ordering applications, Customer reviews applications, Instant messaging applications. Section C also contained questions that were used to determine the frequency of ICT usage. The respondents were required to tick each item in the appropriate column that mostly represents their opinion based on their degree of agreement or disagreement with the statement. Section D looked into how often the models are being used by developers. Section E which has been measured on a Likert scale of agreement having the value from 1 to 5 sought to understand and know which models performs best with the following variables; understanding the requirement, simplicity, risk involved, cost, long term project, user participation, complexity of project, flexibility to change, ease of implementing, team expertise, ease of maintaining the project.
The questionnaire has been administered to the respondents by using Google form for data collection. The link to the closed form is https://forms.gle/KuJsuJdt2dzjhWjs8. Before the administration of the questionnaire, the objectives of the research work were clearly explained to the respondents. Fifty-four (54) copies of the questionnaires were administered randomly.
The Statistical Package for the Social Sciences (SPSS) has been used in analyzing the data collected from the questionnaires. The research questions were assumed using percentages after construction of contingency table for the items with regard to the research questions. The Likert scale with Strongly agree (5), Agree (4), Neutral (3), Disagree (2) and Strongly disagree (1). The Likert scale for frequency has been also used to determine the frequency of usage of the models. It has the value of Never (1), Seldom (2), Sometimes (3), Frequently (4), Always (5). The Likert scale for familiarity has been also used which are Not at all familiar (1), Slightly familiar (2), Moderately familiar (3), Very familiar (4), Extremely familiar (5). The percentages of each variable were calculated on each of the Likert scale. These percentages were used to determine which of the models performs better than the others. For section E, the decision mean score of the variables were obtained. The mean score has been used to determine if the variables are to be accepted for each model (if the mean score is greater than the decision mean score of 3) or rejected (if the mean score is lesser than the decision mean score of 3). This has been done for each of the model under each of the variable. The mean was used to answer the research questions.
The model with the highest mean score has been later chosen to be the best as regards the variable.
The formula used is,
where,
X=mean score
f=frequency of response
x=the numeric value
This section discusses the analysis of the data obtained from the respondents.
Table 1 shows the analysis of the result obtained as regards as the familiarity of the respondents with the SDLC models. It is seen that 32% of the respondents are not familiar with SDLC models at all, 22% are slightly familiar, 20% are moderately familiar, 9% are very familiar and only 4% are extremely familiar with the SDLC models. For the scrum model, only 2% of the population are extremely familiar, 12% are very familiar, 18% are moderately familiar, 28% are slightly familiar while 40% are not familiar at all. For RAD, 38% are not familiar at all, 22% are slightly familiar, 18% are moderately familiar, 16% are very familiar while 3% are extremely familiar. For the prototype, 34% are not familiar at all, 16% are slightly familiar, 20% are moderately familiar, 26% are very familiar while 4% are extremely familiar with the model. Figure 1 indicates the familiarity with SDLC models. Frequency of the usage of SDLC model is given in Figure 2.
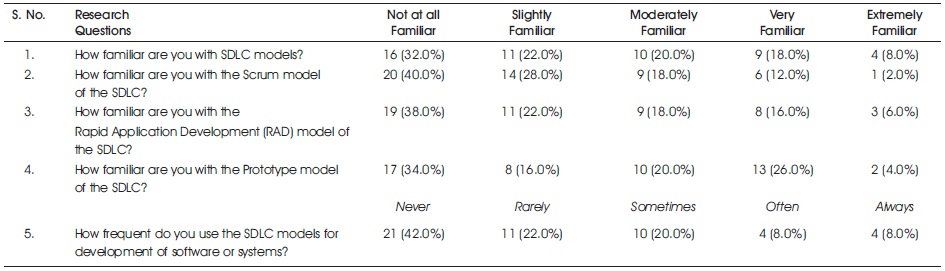
Table 1. Analysis of the Familiarity with SDLC Models
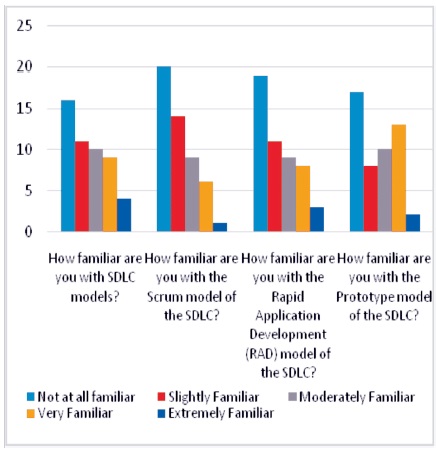
Figure 1. Familiarity with the SDLC Model
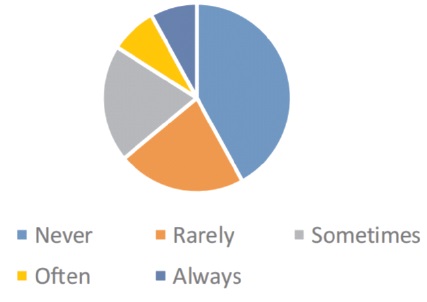
Figure 2. Frequency of the Usage of SDLC Models for Development of Software or Systems
It can be seen that majority of the population are not familiar with SDLC models at all despite the advantages of following the SDLC phases for development. It can also be seen that majority of the respondent (42%) never use the SDLC models for the development of software and systems, 22% rarely use SDLC models, 20% use it sometimes, 8% often use it while only 8% always use the SDLC models for development of software or system.
Table 2 shows the analysis of some of the variables to determine which of the models is suitable for a particular condition (the data visualization is shown in Figure 3). For the question asked which of the models allows you to determine the final product from the beginning, prototype has 55% vote, RAD has 44.4% and scrum has 19.4%. It can be seen that majority voted for prototype. For cost determination before the start of the project, prototype has the highest vote of 57.1%, followed by scrum with 34.4% while RAD has 20% vote.
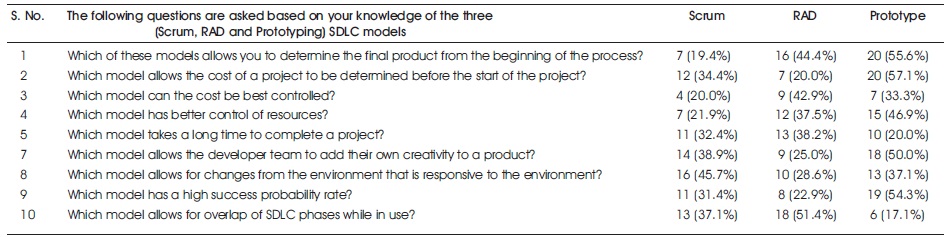
Table 2. Suitability of the SDLC Models Based on Some Conditions
For the cost control, RAD has been majorly voted for with a percentage of 42.9% followed by prototype with a percentage of 33% and scrum with a percentage of 20%.
Resources are best controlled using the prototype model with a percentage of 46.9% followed by RAD (37.5%) and scrum (21.9%). For the model when used takes long to complete a project, RAD have the highest vote of 38.2%, followed by scrum (32.4%) and then prototype has the lowest percentage of 20%. Prototype model allows the developer team to add their own creativity to a product with a vote of 50%, followed by scrum (38.9%) and RAD (25%). Out of the three models, scrum has the highest vote (45.7%) of responsiveness to the environment, followed by prototype (37.1%) and RAD (28.6%). Prototype has been voted the highest (54.3%) to have a high success probability rate, followed by scrum (31.4%) and then RAD (22.9%). For the model that allows the phases to overlap while in use, RAD has voted the highest with a percentage of 51.4% followed by scrum (37.1%) and then prototype (17.1%).
Table 3 shows the efficiency of each models in some project. Figure 4 shows the data visualization of the efficiency of SDLC models in projects. From the table, it can be seen that prototype is preferred by the developer in the following project; tracker system (51.1%), student portal (40%), hospital management portal (42.9%), educational applications (54.3%), android applications (58.8%), fingerprint-based application (47.1%). Scrum is preferred in the following projects; transportation system portal (41.7%), oil and gas applications (56.3%), chemical product costing (55.9), e-commerce applications (50%), blogs (54.7%), online electoral portal (38.2%).
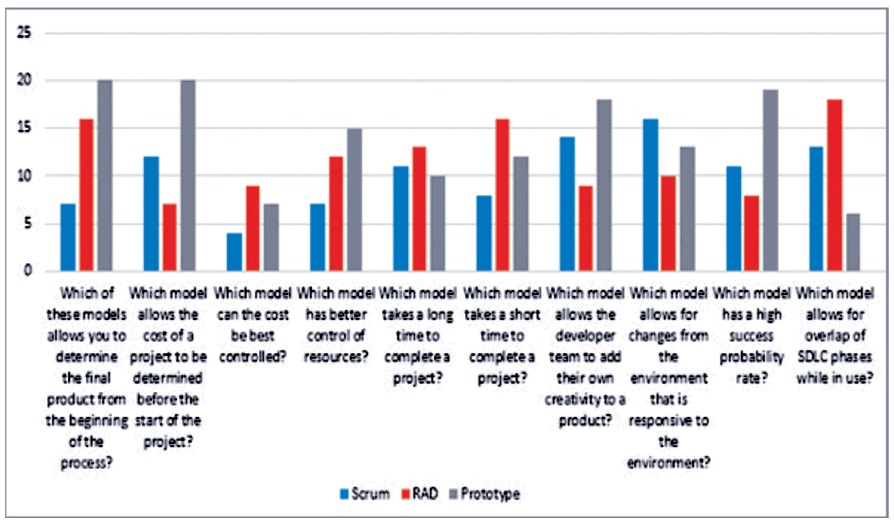
Figure 3. Suitability of the SDLC Models Based on Some Conditions
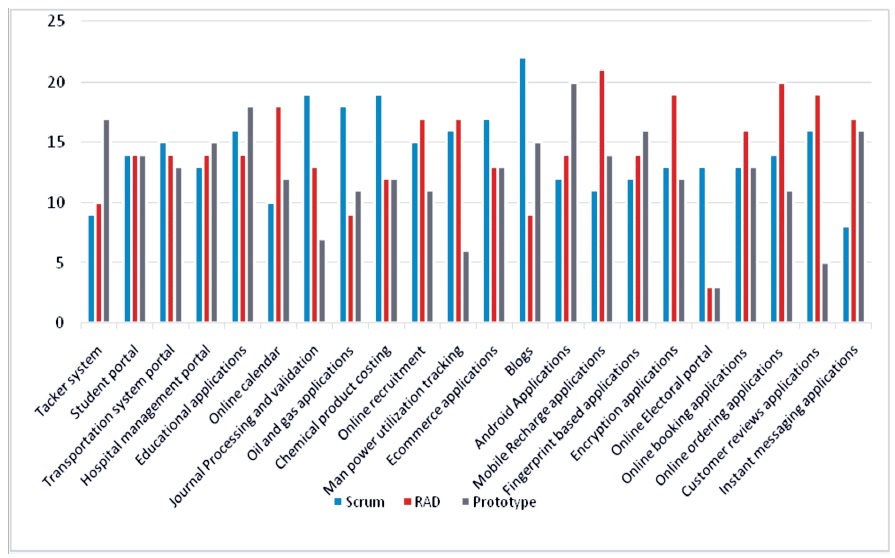
Figure 4. Efficiency of SDLC Models in Projects
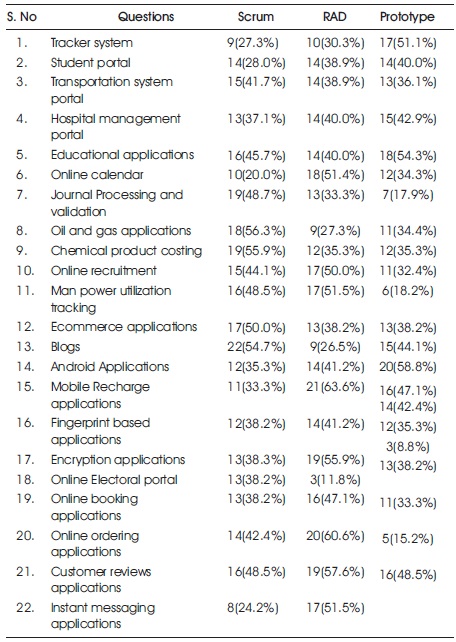
Table 3. Efficient of the SDLC Models in Some Projects
RAD is preferred in the following projects; online calendar (51.4%), online recruitment applications (50%), man power utilization tracking (51.5%), mobile recharge applications (63.6%), encryption applications (55.9%), online booking applications (47.1%), online ordering application (60.6%), customer review applications (57.6%), instant messaging applications (51.1%).
For the journal processing and validation project, all three have the same percentage.
Table 4 shows how frequent each model has been used. The graph showing the frequency of usage of model 1 and 2 is shown in Figures 5 and 6 respectively. The graph showing the frequency of usage of model 1 and 2 is shown in Figures 5 and 6 respectively. Prototype has been used more than the other models. Prototype has a 59.9% vote followed by RAD (39.1%) and scrum (22%). It is seen that only 1 respondent for each of the model has used the models more than 10 times. 10.5% and 10.3% of the respondents have used the prototype and the RAD models respectively between 7 to 10 times, while only 2.4% have used the scrum model within this range. Within the range of 4 to 6, 18.4% of the respondents have used the prototype, 15.4% have used the RAD while only 9.5% have used the scrum. Scrum have the highest vote for the range 0-3 times with a percentage of 85.7% followed by RAD (71.8%) and finally prototype (68.4%).
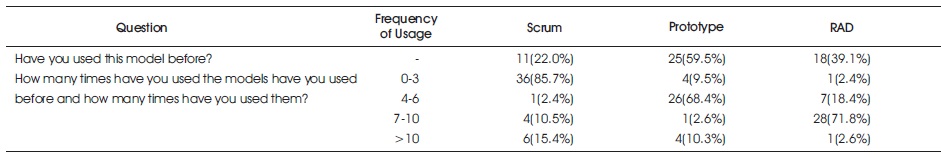
Table 4. Frequency of Usage
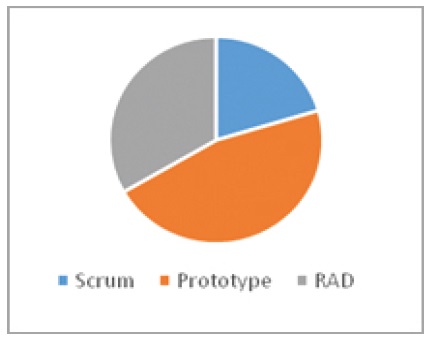
Figure 5. Frequency of the Usage of the Models 1
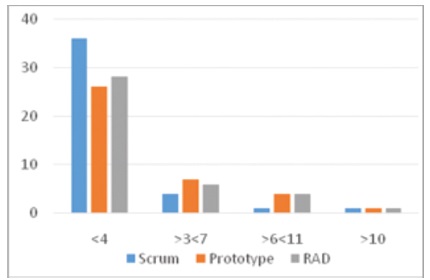
Figure 6. Frequency of the Usage of the Models 2
From this, it can be drawn out that the usage of scrum SDLC model in the development of software is not much while prototype has the highest usage.
Table 5 shows the analysis of the models based on the Likert scale of agreement. For ease of understanding the requirement, Table 6 shows the decision table for the variables.
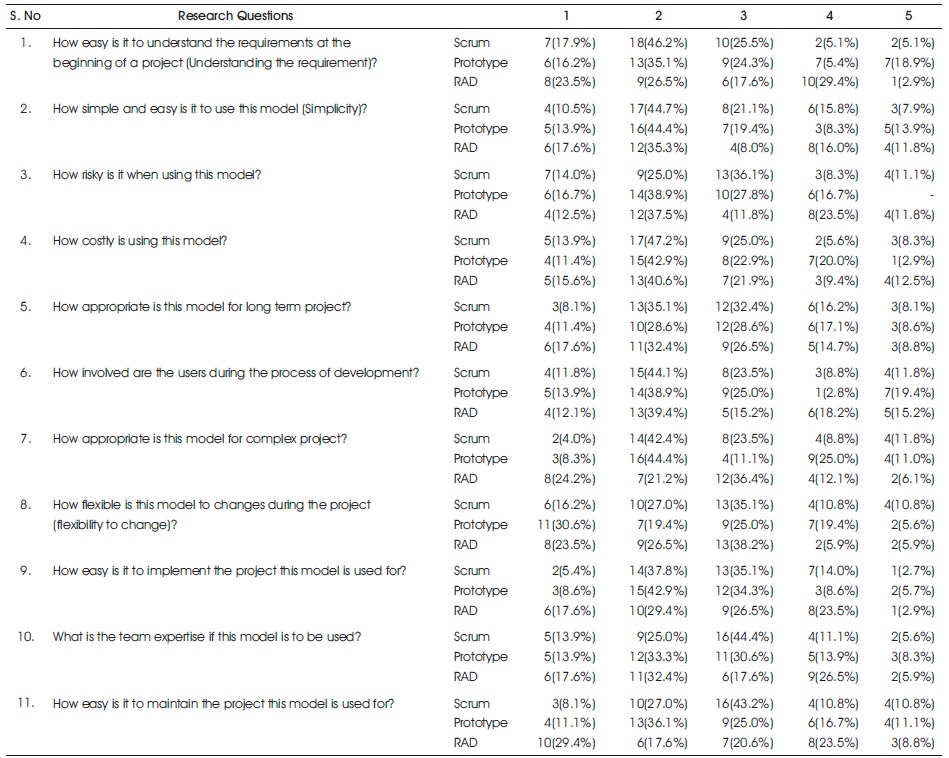
Table 5. Analysis of the Models
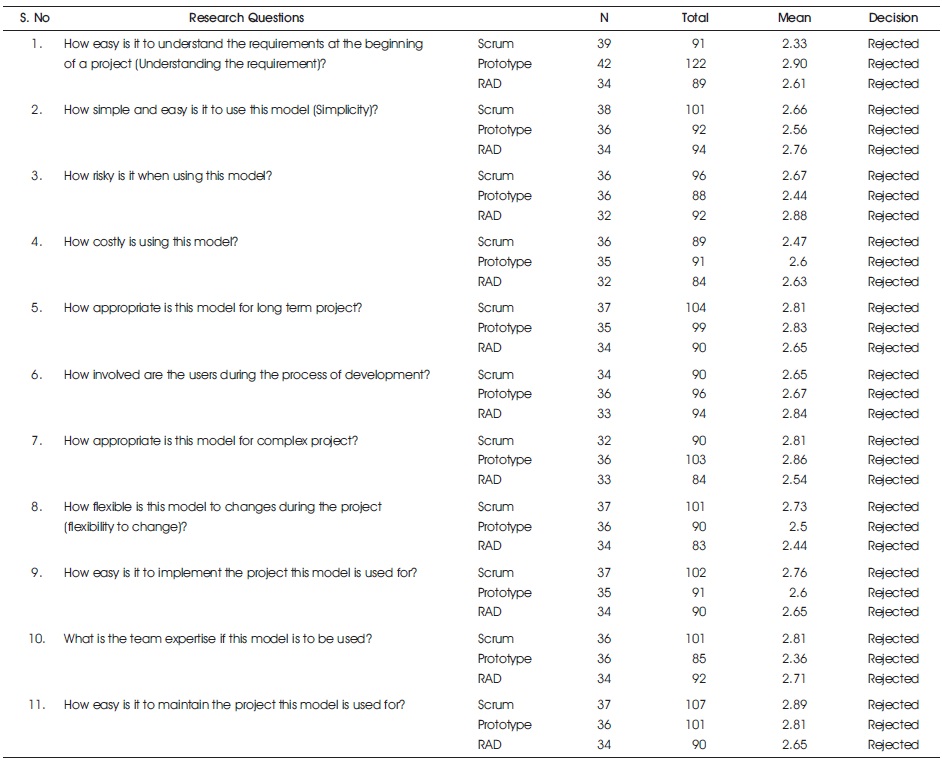
Table 6. Decision for Each Variable
For each of the variables, the models were compared and the one with the highest mean score has been chosen to be the best as regards the variable. Using the mean score to determine if the variables are to be rejected or retained, it has been discovered that all of the variables were rejected.
This work then compared the variables with each other and discovered that scrum is considered to be more flexible to change, easy to implement, require high team expertise and easy to maintain than the others. For prototype, it is appropriate for complex and long-term project and it is easy to understand the requirement at the beginning of the project than the others. For RAD, it is simple and easy to use the model, but it is risky and costly when using this model and it allows for users involvement during the development process more than the others.
Three SDLC models (RAD, Prototyping and Scrum) were considered and compared with each other. Area of applicability has been mentioned. A brief review of other models which are the waterfall model, the spiral model, the V-model and the incremental model has also been done. The choice of the model to use largely depends on the type of problem being solved.
It is recommended due to the low number of usages of SDLC models for software development that developers use SDLC often in the development of their projects. It is also recommended that these models be taught in schools in courses that have to do with computer and software development. For further studies, more models can be considered for this work and include more respondents.
The datasets generated and analyzed during the current study are available in the Google Forms repository at https://forms.gle/KuJsuJdt2dzjhWjs8.