Figure 1. Proposed System of Automatic Student Performance Analysis and Monitoring (Kekane et al., 2016)
This paper aims to reduce the manual work involved in the performance evaluation and analysis of students, by automating the process right from retrieval of results to pre-processing, segregating, and storing them into a database. The authors also aim to perform analysis on huge amounts of data effectively and facilitate easy retrieval of various types of information related to students' performance. They aim to achieve this through Python, Crawlers, and other Database tools. Further, a scope is given to establish to data warehouse wherein, data mining techniques can be applied to perform various kinds of analyses, creating a knowledge base and use it further for prediction purposes.
Any educational institution thrives to provide quality education to its students, thereby producing graduates of great quality who excel in academics, practical knowledge, etc. Many factors influence an institutions' success, one of which is students' success. The students' success is one of the most important metrics to measure the overall efficiency in education they provide. To achieve this, it is essential for every educational institution to analyse the performance of students. The students' academic performance is usually assessed by conducting various examinations, assessments, and other form of measurements. The information related to students' performance is analysed to extract useful information. And the institutions, in the process of improving themselves, make some decisions to achieve better results. They base their decisions on the analysis done using the traditional methods.
In this traditional approach towards students' performance analysis, the information related to students' performance is usually stored in spreadsheets, files, etc., and is analysed to extract useful information. The statistical methods used during the performance analysis will only process the students' data and might lead to fewer results like the number of passing students, number. of failures, the highest percentage of marks, etc. The problem arises when we want to analyze the students' performance in more possible ways and also extend the analysis to find associations, correlation between the various factors affecting a student's performance (Qingshan, Xianli, & Mingying, 2010).
The emerging technology trend data analytics has revolutionized the traditional decision making. Adding to it, today's technology has made the data store and processing power cheaper; it can be made to formulate the right rules to derive intelligent decisions. Instead of the traditional way of storing data in spreadsheets or records, we can store the data related to students' performance in a transactional database. Further, we can clean and integrate the student's data from various sources to create a data warehouse. Then select the data relevant to analysis task and apply intelligent methods to extract interesting data patterns, i.e. knowledge from students' data.
This will revolutionize how we derived value out of the data already being collected. And also, help the educational institutions to base their decisions on valid facts and figures in the education sector and help them make better and intelligent decisions.
Hence the lists of objectives remain as follows:
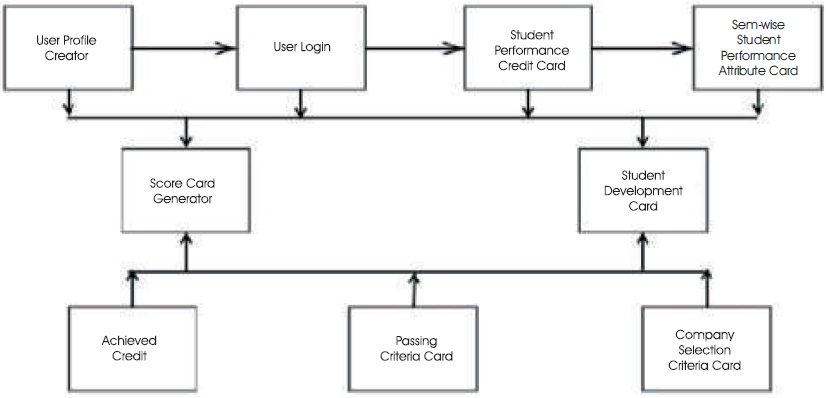
Kekane, Khairnar, Patil, Vispute, & Gawande (2016) have proposed a system that will analyse student performance and guide them by displaying the areas, where they need improvement, in order to contribute to a student's overall development by generating a score card for the same. They also aimed to display student performance in the form of graphs and generate a student scorecard on single click action by the user, such that by typing the name of the student and his unique ID, the result will be displayed. Their proposed system was as displayed in Figure 1.
Figure 1. Proposed System of Automatic Student Performance Analysis and Monitoring (Kekane et al., 2016)
Venkatesan and Selvaragini (2017) have intended to traverse the data mining techniques, which are used for the improvement of the student's performance and also identify the best suited structure of curriculum for the current environment. Particularly, the survey analyses about the use of classification algorithms ID3 and C4.5 for the student performance evaluation system and have analysed the data set containing information about students, such as gender, marks scored in the board examinations of classes X and XII, marks and rank in entrance examinations, and results in first year of the previous batch of students; Applied ID3 (Iterative Dichotomiser 3) and C4.5 classification algorithms on this data and predicted the general and individual performance of freshly admitted students in the future examinations. They have also concluded that among the choice of classification algorithms, the performance of C4.5 performs well in processing the student's data.
Baba, Govindu, Raavi, and Somisetty (2016) have proposed to predict the student performance by considering their academic details. They collected sample data and predicted the student's progression and have applied group of classifiers to the dataset taken and among those classifiers they have made attempts to find out the best classifier. They used WEKA tools to identify the missing values very efficiently. Their approach begins from the collection of data for graduate students, and later the preprocessing procedures are tested with the dataset. The data pre-processing approach is utilized to make the data more deserved for data mining to get the resultant student performance. In their result analysis, they included academic details like students 10th percentage, inter percentage, B.Tech 1st year. For further increase in accuracy they ought to consider more attributes like student's social networking interest, parent's economic status, parent's educational details, and many others since they could not predict the result of the student with much accuracy just by his previous year's marks.
Sa, Hossain, and Hossin (2015) have proposed a system named Student Performance Analysis System (SPAS) to keep track of students' result in the Faculty of Computer Science and Information Technology (FCSIT). Their proposed system offered a predictive system that is able to predict the students' performance in the course “TMC1013 System Analysis and Design”, which in turn assists the lecturers from information system department to identify students that are predicted to have bad performance in that course. Sa et al. (2015) used classification data mining technique, which classifies the students based on students' grade. They used FSS system, which is able to analyse the students' data dynamically as it is able to update of students' data dynamically with the flow of time to create or add a new rule. The update of the new rule is possible with the help of domain expert and the rule is determined by data mining technique such as classification technique. They concluded that their project concentrates on the development of a system for student performance analysis. A data mining technique, classification algorithm was applied in this project to ensure the prediction of the student performance in the course “TMC1013 System Analysis and Design” are possible. The main contribution of the SPAS was that it assists the lecturers in conducting student performance analysis. The system assists lecturers in identifying the students that are predicted to fail in the course “TMC1013 System Analysis and Design”.
Singh, Gopal, and Mishra (2011) have proposed to perform extraction and analysis of faculty performance using the techniques of Data Mining. The rationale behind using Data Mining is to cluster faculty performances on various criteria subject to the certain constraints and also extracting the dependencies amongst the parameters, which will help finding meaningful associations between them. These associations in turn help to identify new patterns for decision making.
Umamaheswari and Niraimathi (2013) have proposed to categorize the students into grade order in all their education studies exploring the various sociodemographic variables (age, gender, name, lower class grade, higher class grade, degree proficiency and extra knowledge or skill, etc.) and examine to what extent these factors help to categorize students in rank order to arrange for the recruitment process. They have used clustering, association rules, classification, and outlier detection to evaluate the students’ performance.
From the earlier studies on analysing students' performance, Kekane et al. (2016) have tried to provide the areas of improvement and generate a score card for the student. Venkatesan and Selvaragini (2017) have concluded that C4.5 classification algorithm performed well while analysing students' performance. Baba et al. (2016) have used classification techniques for analysis and also included other attributes like students 10th, 12th and B.Tech. 1st year results for more accuracy. Sa et al. (2015) have proposed a system that identifies the students, who are likely to have bad performance in a particular course. Many have spoken about predicting students' performance, before that happens, we feel a need to automate the process right from extraction of results to storing them into a database. And then go in developing a system that predicts students' performance in the further advancements and tells us the areas of improvement and perform other analyses.
Overcoming these limitations of the earlier methodologies, the authors have proposed a system that will help us make intelligent decisions by analyzing huge dataset with the help of Data Mining techniques. Figure 2 depicts the architecture of the proposed system.
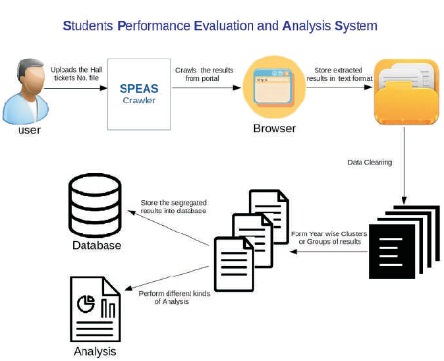
Figure 2. Architecture of Students Performance Evaluation and Analysis System (SPEAS)
The proposed system is divided into two major tasks:
In achieving Task 1, we start with the gathering of large amounts of data related to students. As their focus is on students' performance analysis, the data set will be their performance in the examinations. They have subdivided Task 1, into four subtasks starting with crawling wherein the students results, which are usually available in their respective portals are fetched using a customized web crawler developed using iMacros and save it in the form of text document. Then comes Data Cleaning and Data Grouping. As the fetched result documents might have unnecessary and inconsistent data like fathers name, gender etc., we need to clean the data and remove inconsistencies. And also they segregate the extracted results into Semester-Wise Clusters/Groups, which can act as data sets. They have automated this preprocessing step with the python scripts. Moving further to subtask 3 Analysis, the dataset prepared in subtask 2 are analysed to obtain the collection of information like best, worst marks obtained in a subject; find the aggregate of as student; pass and fail percentage in a subject, etc. Further, the analysis can be extended to find associations, correlations between various factors affecting a students' performance that can be used for prediction purpose in Task 2. And the final subtask 4 is data storage. Here a student database is established and semester-wise tables are created. They further insert the Semester-wise segregated results into the database with the help of a python script. A Graphical User Interface (GUI) interface can be utilized for the above 4 tasks.
In achieving Task 2 system, which is an extension to Task 1 system, we start with the creation of a knowledge base from the data sets obtained in Task 1. Then, the knowledge is extracted from the knowledge base created and the appropriate data mining techniques are applied on the resultant datasets, which gives us a scope to find associations, correlations among the various factors affecting the students' performance, and also predict their future performance.
It is started with crawling of results from results portal, then pre process, and segregate them as year wise or subject wise results, then store them into the database. Then, we can proceed with a performance analysis or creation of data warehouse. It can be further proceeded by applying data mining techniques for prediction purposes, find associations, and correlations between various factors affecting student performance. The above mentioned tasks are achieved as follows:
Task 1 – Data Extraction and Processing
Subtask 1 – Crawling
Step 1 – Start
Step 2 – Upload the roll-list document
Step 3 – Read roll no. from roll list
Step 4 – Repeat
Extract the students result from portal using iMacros and save it in .txt format until roll no is not null
Step 5 – Stop
Subtask 2 – Data Cleaning and Data Grouping
Data Cleaning:
Step 1 – Start
Step 2 – Read each result of students
Step 3 – Extract the necessary information suitable for the project and store into an output file.
Step 4 – Repeat step 2, 3 until every students data is read
Step 5 – Stop
Data Grouping:
Step 1 – Start
Step 2 – Read the input file
Step 3 – With Subject Code as Class Label, Segregate them into Clusters
Step 4 – Repeat step 2, 3 until whole input file is read
Step 5 – Stop
Subtask 3 – Analysis
Step 1 – Start
Step 2 – Perform various analyses as per choice like finding aggregate of students, Maximum and Minimum Marks obtained in a subject, Pass and Fail percentage in a subject, etc.
Step 3 – Stop
Subtask 4 – Data Storage
Step 1 – Start
Step 2 – Upload the segregated files into the respective database tables
Step 3 – Stop
Here we can extend the above system for prediction purposes. We can start with the creation of a Knowledge Base from the data sets obtained in Task 1. Then we extract the knowledge from the Knowledge Base created and apply appropriate Data Mining Techniques on the resultant data sets, which gives us a scope to find associations, correlations among the various factors affecting the students' performance, and also predict their future performance.
Pseudo Code for Data Extraction
open indir directory
// folder containing individual results
var pattern1 = new RegExp("([^\d])\d{12}([^\d])")
// hall ticket no. pattern
var pattern2 = new RegExp("([^\d])\d{4}([^\d])")
// pattern for line containing marks
FOR index1 = 1 to len(indirArray)
infile=indirArray[index1]
OPEN infile in “read” mode
// Open each individual result file in read mode
for index2= 1 to len(infilearray)
ln=infilearray(index2)
// for each line in result file
if pattern1 in ln
// if hall ticket no. is in line ln
Append the ht no. to the n1
// append hall ticket no. to parameter n1
if pattern2 in ln
// append result to parameter n2
Append the subject result to the n2
name = n1 + n2
// concatenate n1 and n2 to name
WRITELINE(outfile, name))
// write name to outfile
ENDFOR
close infile
//close individual result file
ENDFOR
CLOSE outfile
The data extraction and processing involves challenges as in for the university, the results are displayed as a web page. We can facilitate to download the results displayed in web page format to .txt format as in Figure 3 using a crawler. Then process the thousands of individual results like Figure 3 and extract information and combine them into one structured form containing only the necessary data useful for further analysis as in Figure 4.We can group them further as semester wise results. Once the process of extracting the results from portals, cleansing and grouping is automated thereby reducing a huge labor involved, we can proceed with further analysis and data storage.

Figure 3. Individual Result of a Student in .txt
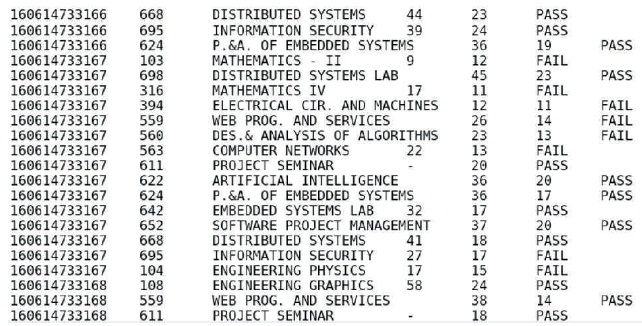
Figure 4. Combined Result (Structured Form) (Unstructured Form)
To know the pass and failure percentages in a semester, we feed the semester wise segregated results obtained in data grouping part of sub task 2 to the proposed system. It gives out the results as in Table 1. These obtained results can further be summarized as depicted in Figure 5.
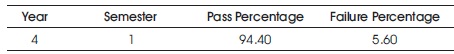
Table 1. Year-Semester wise Pass and Fail Percentages
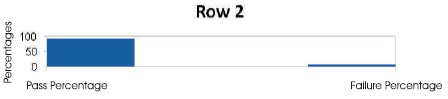
Figure 5. Year-Semester wise Pass and Failure Percentage
To find the pass and failure percentages in a subject, we feed the segregated results obtained in data grouping part of sub task 2 and the corresponding subject code of the subject to which we want to find the pass and failure percentages, to the system developed. It gives out the results as in Table 2. Further we can depict the obtained results as in Figure 6, which makes the summarization of results much easier and also provides us with the chance of easier comparison of the results with that of other subjects.

Table 2. Subject wise Pass and Failure Percentages
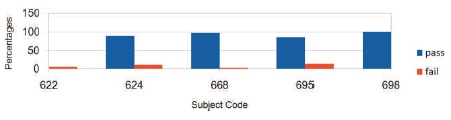
Figure 6. Subject - wise Pass and Failure Percentage
To find the highest, lowest, and average marks of a subject in a semester, we feed the segregated results obtained in sub task 2 and select the corresponding subjects' name. The system gives out the results as in Table 3. They can further be depicted as in Figure 7, which summarizes the result in Table 3 well and provides us with the chance of easier comparison of the obtained results with that of other subjects.

Table 3. Subject-wise Highest, Lowest and Average Marks
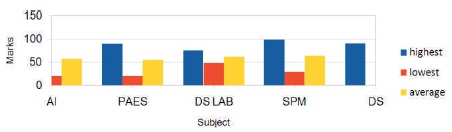
Figure 7. Subject - wise Highest, Lowest and Average Marks
The above are glimpses of the kind of analyses that can be performed once we have the result datasets (obtained by the end of sub task 2) in hand. We can also find the total marks obtained, aggregate of a student, etc., and perform further data aggregations to achieve specific objectives. And can also perform a human analysis on the obtained aggregations.
The authors mainly aim to automate the process right from extracting of results from their respective portals till storing them into a result database. And also to simplify the complex operations like finding the aggregate of a student, the overall pass and fail percentage in a subject etc., and analyze the student performance in various possible ways. Also derive out information like a students stronger and weak areas, identify the set of students who need special attention, etc., with further data aggregations, establishing a data warehouse. Such a kind of automated system will ease the work of the educational institutions and help them have a better scenario of the factors affecting a students' performance. And also helps the institutions make decisions based on valid facts and figures to achieve better results.
The complete data extraction module is data dependant, so one module may not be universally applicable. Also we made some assumptions like hall ticket number to be 12 digits etc., on the underlying data, if the data changes those assumptions might fail.
The authors may further extend their idea to develop a prediction system making use of Machine Learning algorithms and techniques that can predict a student's performance based on his/her previous track record, find associations and correlations between various factors affecting students performance, etc., includes parameters other than marks like attendance, responsiveness of a student in class, and other classroom parameters and help institutions make intelligent decisions.