 satisfy exactly one of the relations listed above. Strict inequality is an example of a trichotomous relation in this sense. Trichotomous relations in this sense are irreflexive and anti symmetric (Sensagent, 2012).
This monograph provides a neuroscience–based systemological, epistemological, and methodological rational for the design of an advanced and novel parametric statistical analytics designed for the biological sciences referred to as “Biotrichotomy”. The aim of this new arena of statistics is to provide dual metrics designed to analyze the Pre and the Post Hoc outcomes of biological phenomena. The data analysis methodology of “Biotrichotomy” as “Biotrichotometrics” uses the unique instrumentation of the qualitative to quantitative “Tri–Squared Test”and its associated Post Hoc statistic “Tri–Center Analysis” as in–depth data analytic psychometrics. Using these two tools together the researcher has a seamless longitudinal research methodology. Access through these procedures also allows the use of the traditional parametric statistical measures of central tendency within the trichotomous research design framework. In terms of post hoc metrics, Tri–Center Analysis involves the computation of normal distribution parametric measures to examine the values of an independent statistically significant Tri–Squared Test. Both systems of statistical analysis were initially introduced in the i-manager’s Journal on Mathematics and i- manager’s Journal of Educational Technology respectively, and the result of this paper illustrates their utility, usability, and viability.
Biostatistics researcher Jerrold H. Zar (2010) states that scientific study involves the systematic collection, organization, analysis, and presentation of knowledge. He further states that many investigations in the biological sciences are quantitative, where knowledge is in the form of numerical observations called data (one numerical observation being a “datum”). In order for the presentation and analysis of data to be valid and useful, we must use methods appropriate to the type of data obtained. Statistics applied to biological problems is simply called biostatistics or, sometimes biometry (the latter term literally meaning “biological measurement”) (Zar, 2010). The author proposes in this narrative a novel set of statistical metrics grounded in the tripartite nature of natural phenomena. In terms of Biostatistics, Zar states that, “the design of the data collection, the questions asked of the data, the limitations of the data, the data collection, and of the data analysis should be appreciated when formulating conclusions”. Thus, the overarching goal of this paper is to provide two dynamic and recently published statistics that are useful in the biological analysis of natural phenomena that are readily accessible and easily implemented by scientific researchers. These dual statistical metrics can be grouped under the universal name of “Biotrichotomy” or “Biotrichotometrics”.
Neuroscience is a branch of Science that deals with the Anatomy, Physiology, Biochemistry, or Molecular Biology of nerves and nervous tissue and especially their relation to behavior and learning (Neuroscience, 1963). Neuroscientists focus on the brain and its impact on behavior and cognitive functions. Many researchers say that Neuroscience means the same as Neurobiology. However, Neurobiology looks at the Biology of the nervous system, while neuroscience refers to anything that has to do with the nervous system (Nordqvist, 2012). Cognition is a term referring to the mental processes involved in gaining knowledge and comprehension. These processes include thinking, knowing, remembering, judging, and problem-solving. These are higher-level functions of the brain and encompass language, imagination, perception, and planning (Cherry, 2014). The brain encompasses 100 billion neurons with each neuron connected to perhaps 10,000 others for a total of 1 million billion connections (Restak, 2011). , pg. 14 New neuronal connections are being created continuously. Neurogenesis, which is the process by which neurons or nerve cells are generated in the brain, can be increased by enriched environments or inhibited by stress, depression, sleep deprivation, and anxiety (Restak, 2011, ). pg. 17 The environment plays a great role in the enhancement of cognitive powers and this can be further developed by what we learn and what we do (Restak, 2011, pg. 24). The more ways in which new material can be introduced, the more synaptic cell-to-cell bridges emerge. This makes the neural cells stronger and more resistant to dying off or pruning (Willis, 2007, as cited in McGuckin & Ladhani, 2010).
Advances in brain research technologies have allowed researchers to observe more clearly the patterns of brain activity during the learning process (Kumar & Yap, 2010). From a cognitive neuroscience perspective, learning is viewed as the modulation of neurons: the formation and strengthening of synaptic connections through new and repeated thoughts and actions (Hirumi, 2013). Learning is the process of making neuronal connections in response to external environmental stimuli, whereas Education is the process of controlling or adding stimuli, and of inspiring the will to learn(Koizumi, 2000 a &b; 2004 as cited in Koizumi, 2011. As Educators and Instructional designers, they should be able to inspire students to learn. This requires creative and innovative ideas and concepts that explore the possibilities of thinking outside the perceived norm and embarking into areas outside of our comfort zone. What's needed in online teaching are sound web design principles that employ graphics, animations and other multimedia programs (Siragusa, Dixon & Dixon, 2007) that can inspire and motivate students in an online learning environment. However, as a pre-cursor to understanding the approach to designing an engaging online learning environment, the researcher must first look at how the sensory brain reacts to various stimuli and initial perceptual information. A careful review of the literature reveals the following relevant factors that can be considered in using cognitive and neuroscience to inform the design of online learning environments.
We learn, because of an electromagnetic to biochemical transformation of energy. Whenever an external stimulus is perceived by a sensory modality, it travels inside the human neuro-network by triggering specific neurotransmitters (Feidakis & Daradoumis,2013). Learning is not a singular process but rather a complex series of processes (Mahan & Stein, 2014). Neuroplasticity, also known as brain plasticity refers to changes in neural pathways and synapses due to changes in behavior, environment, neural processes, thinking, emotions, as well as changes resulting from bodily injury (Pascual-Leone, Freitas, Oberman, Horvath, Halko, Eldaief et al., 2011). The brain can learn or take in information in two distinct ways : implicit or explicit (Mahan & Stein, 2014). Implicit learning takes place at the unconscious level and explicit learning takes place at the conscious level. Learning always involves both conscious and unconscious processes (Kumar & Yap, 2010).
In terms of the learning cycle, the sensory brain is where our concrete experience is first recorded in the cortex. The sensory brain gathers the raw materials for reflection, abstraction, and action. Vision is central to any concrete experience that we have. In many ways, our brain is a “seeing” brain (Zull, 2002). The brain also attends to sound in a way that is similar to vision. We listen intensely to new sounds for a short time, and then others become more interesting (Zull, 2002). Understanding this trichotomous aspect of the brain, how sound is processed, is very significant for biological researchers as it begins to illustrate the trichotomy that is present in nature (similar comprehending that the basic building blocks of nature i.e., “subatomic structure” are composed of the trichotomous elements proton, neutron, and electron). A process known as habituation takes place when the brain hears the same sound over and over. The brain begins to ignore the sound and the synapses begin to fire less frequently and the neural networks begin to disconnect. This process sets the stage for boredom and nothing demonstrates habituation more than a lecture (Zull, 2002). However, if information can be introduced both visually in the occipital lobes and orally through the temporal lobes, there is a greater chance that the information will stick, as the more regions that store this information, the more connections are made (McGuckin & Ladhani, 2010). This neurobiological definition accurately describes biotrichotomy which is a neurobiological way of visually disseminating statistical data in terms of natural trichotomy. This also links directly to biotrichotomy and its innovative “systemology” that is used in the biological science.
“ Systemology ” as a methodology of modern interdisciplinary analysis is particular direction general scientific methodology of scientific knowledge and social practice, accentuated on the elaboration and adoption of optimal engineering solutions (in the broad sense) in relation to the structure and behavior of objects as complete units (Kurabatov, Glagolev & Fursova, 2013). In terms of innovative optimization of research in biological fields “Biotrichotomy” seeks to empower biologists with a set of tools designed to provide both qualitative and quantitative data from an innovative entrepreneurial perspective (regarding the design and implementation of inquiry–based researcher–designed psychometric instruments). Kurabatov et al. (2013) further defines systemology in the contextual framework of innovation as follows, “Innovative activity is system activity for creation and implementation in the public practice of innovation, a priori assuming the transformation of scientific values, ideas, discoveries and inventions in products, services, production and management technologies of varying degrees of novelty. Systematic means the inclusion of all the functional areas that occur during the creation of innovations, regardless of their intended purpose and application areas. Innovative activity embodies the unity of technological, organizational, managerial and social innovations, forming the base of the innovative model of the evolution of the economy.” This directly aligns with theoretical and conceptual frame works of biotrichotomous measurement instruments in terms of the application of researcher–designed trichotomous metrics. On this basis, the theoretical basis of innovation activity is innovation–research activities in which problems of development and development of the theoretical theses, methodological principles, methods of forecasting and innovation, planning and organization of innovative activities are the most significant. In this setting, the basis of innovation is systemology (Kurabatov, Glagolev & Fursova, 2013) .
In the metric–based confines of Biotrichotomy “Tri–Square” or “Tri–Squared” comprehensively stands for “The Total Transformative Trichotomous–Squared Test” (or “Trichotomy–Squared”). It provides a methodology for the transformation of the outcomes from qualitative research into measurable quantitative values that are used to test the validity of hypotheses (Osler, 2014). It is based on the Mathematical “Law of Trichotomy ”. In terms of Mathematics, Apostol in his book on calculus defined “The Law of Tricohotomy” as: Every real number is negative, 0, or positive. The law is sometimes stated as “For arbitrary real numbers a and b, exactly one of the relations a< satisfy exactly one of the relations listed above. Strict inequality is an example of a trichotomous relation in this sense. Trichotomous relations in this sense are irreflexive and anti symmetric (Sensagent, 2012).
The foundational idea of a “Trichotomy” has a detailed long history that is based in discussions surrounding higher cognition, general thought, and descriptions of intellect. Philosopher Immanuel Kant adapted the Thomistic acts of intellect in his trichotomy of higher cognition as (a) understanding, (b) judgment, (c) reason; which he correlated with his adaptation in the soul's capacities as (a) cognitive faculties, (b) feeling of pleasure or displeasure, and (c) faculty of desire (Kant, 2007). The Total Transformative Trichotomous–Squared Test provides a methodology for the transformation of the outcomes from qualitative research into measurable quantitative values that are used to test the validity of hypotheses. The advantage of this research procedure is that it is a comprehensive holistic testing methodology that is designed to be static way of holistically measuring categorical variables directly applicable to Educational and Social behavioral environments where the established methods of pure experimental designs are easily violated (Osler, 2012a). The unchanging base of the Tri–Squared Test is the 3 × 3 Table based on Trichotomous Categorical Variables and Trichotomous Outcome Variables. The emphasis the three distinctive variables provide is a thorough rigorous robustness to the test that yields enough outcomes to determine if differences truly exist in the environment in which the research takes place(Osler, 2013a).
Tri–Squared is grounded in the combination of the application of the research of two mathematical pioneers and the author's research in the basic two dimensional foundational approaches that ground further explorations into a three dimensional Instructional Design (Osler & Waden 2012b). The aforementioned research includes the original dissertation of optical pioneer Ernst Abbe who derived the distribution that would later become known as the “chi square distribution” and the original research of mathematician Auguste Bravais who pioneered the initial mathematical formula for correlation in his research on observational errors. The Tri–Squared research procedure uses an innovative series of mathematical formulae that do the following as a comprehensive whole: (1) Convert qualitative data into quantitative data; (2) Analyze inputted trichotomous qualitative out comes ; (3) Transform in putted trichotomous qualitative outcomes into outputted quantitative outcomes; and (4) Create a standalone distribution for the analysis possible outcomes and to establish an effective––research effect size and sample size with an associated alpha level to test the validity of an established research hypothesis (Osler, 2012a).
Biotrichotometrics exist to quantify the qualitative outcomes drawn from “biological psychometrics” that can be used in “applied biostatistics”. The process of designing instruments for the purposes of assessment and evaluation is called “Psychometrics”. Psychometrics is broadly defined as the science of psychological assessment (Rust & Golombok, 1989). The Tri–Squared Test pioneered by the author, factors into the research design a unique event–based “Inventive Investigative Instrument” (Osler, 2013b). This is the core of the Trichotomous–Squared Test. The entire procedure is grounded in the qualitative outcomes that are inputted as Trichotomous Categorical Variables based on the Inventive Investigative Instrument (Osler, 2013c). Osler (2012a) initially defined the Tri–Squared mathematical formula in the i-manager’s Journal on Mathematics article entitled, “Trichotomy–Squared – A novel mixed methods test and research procedure designed to analyze, transform, and compare qualitative and quantitative data for education scientists who are administrators, practitioners, teachers, and technologists” as follows: Tri2 = TSum [(Trix – Triy)2 : Triy] (Osler, 2012a).
The fundamental methodology of Biotrichotomy is provided in a ‘Tri2 3×3 Standard Table’ displaying the mathematical analytics and specific calculations that are a part of this research procedure. The mathematical operations presented in a sequential format and provide detailed and informative examples of how to conduct both pre and post hoc “Biotrichotomous Analytics” as a series of trichotomous psychometric tables (Tables 1 and 2 respectively followed by Figure 1 that summarizes these sections). Immediately after the initial ‘pre’ data collection and analysis section, some sample data is provided to illustrate exactly how an actual Biotrichotomous analysis of data takes place using all of the aforementioned calculations (Table 3 followed by the Summary: Post Hoc Measures and Metrics Section that is illustrated in Figures 2, 3, 4, and 5 respectively, that continue immediately after the initial research section in an explicative sequential format). Table 1 immediately follows and illustrates the foundational Tri2 Mathematical Model Illustrated in Tabular Format.
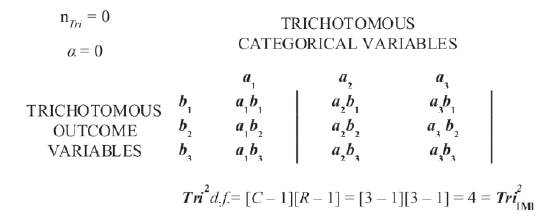
Table 1. Biotrichotomy Tri–Squared Test 3 × 3 Table Calculation Procedures
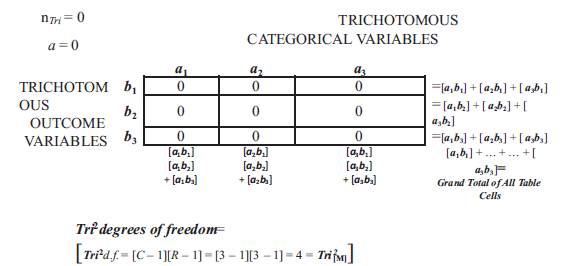
Table 2. The Biotrichotomy Tri2 3 × 3 Standard Table of Statistically Significant Tri2 Test
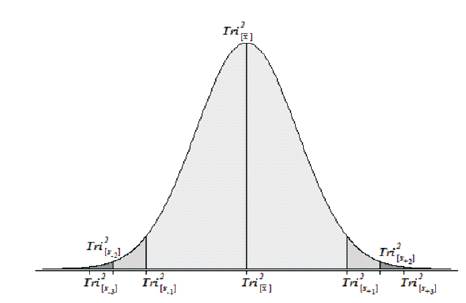
Figure 1. The Tri–Squared [or “Gaussian”] Normal Curve Model (Osler, 2014)
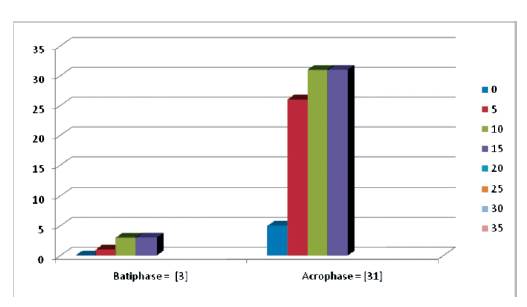
Figure 2. Visual Analysis of the Tri–Squared Biotrichomous Bimodal Distribution of Statistically Significant Results (Osler, 2014)
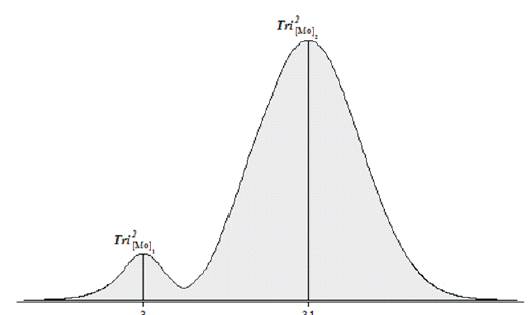
Figure 3. The Tri–Squared Test Tri–Center Analysis Post Hoc Bimodal Distribution A Curve of the Sample Data Statistically Significant Results (Osler, 2014)
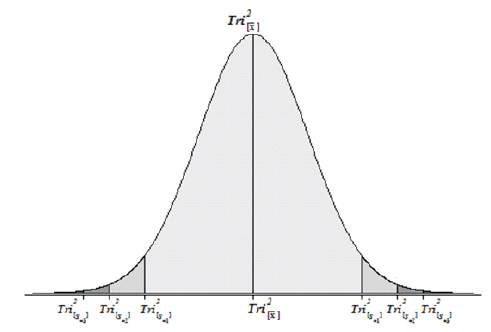
Figure 4. Tri–Squared [Gaussian] Normal Curve Indicating Where to Plot DataPoints (Osler, 2014)
Table 2 follows and illustrates the Tri Test Total Calculations by Cell, Row, and Column Illustrated in Tabular Format (Osler, 2014).
The Table 2 is a Trichotomous–Squared Standard Three by Three Table designed to analyze the research questions from an Inventive Investigative Instrument with the following Trichotomous Categorical Variables: a1; a2; and a3. The 3×3 Table has the following Trichotomous Outcome Variables: b1; b2; and b3. The Sample Total Calculations are conducted.
The Biotrichotomy Tri2 3 × 3 Standard Table of Statistically Significant Tri2Test
The following calculations are the basis of Tri–Center Analysis. They consist of the traditional statistical “measures of center” or “measures of central tendency”. They are represented in terms of Trichotomous relations in the following manner: (1) Calculating the Tri–Squared TestMean = Tri2[M] :which represents the arithmetic average of Tri–Squared Test data; (2) Calculating the Tri–Squared Test Mode = Tri2[MO] : which represents the most frequently [Mo] occurring numerical value in the set of data; and (3) Calculating the Tri2[Me]:Squared Test Median Tri : which [Me] represents the middle score in the data set. To calculate the spread and variation of Tri–Squared Test results, the researcher will need a set of mathematical conventions and specific Trichotomous statistical formulae which use those conventions to determine the Trichotomous Variance and Standard Deviation respectively (Osler, 2014).
The following mathematical conventions create a holistic series of sequential within group Trichotomous Tri–Squared Test results from the Standard 3 × 3 Tri–Squared Table. The Mathematical Conventions of the Total Number Tri–Squared Table Cells [nTri2 ] are as follows: (1) nTri2 is not nTri, where, nTri = The Total number of Tri–Squared Participants and nTri2 = The Total Number of Tri–Squared Table Cells; (2) nTri2≠ TTri2, where, nTri2 = The Total Number of Tri–Squared Table Cells and TTri2 = The Total of All Nine Tri–Squared 3 × 3 Table Cell Values Added Together; and (3) nTri2 =9.
The mathematical conventions now allow specific mathematical formulae related to the Tri–Squared Test to be created and conducted that will yield the Trichotomous Variance Tri2[s2] and Standard Deviation Tri2[s]. These are the spread and variation of Tri–Squared Test results equations that are related to the parametric “Gaussian Distribution” or “Normal Curve”. The equations are sequential and follow in the next series of statements(Osler, 2014).
The Tri–CenterEquations Related to the Tri–Squared [Gaussian] Normal Curve are as follows,
1) Tri –Squared Mean =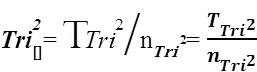
2) Tri–Squared Variance =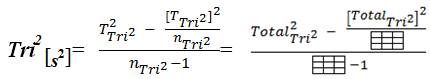
3) Tri–Squared Standard Deviation =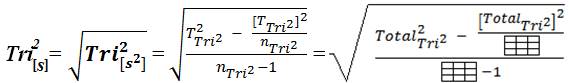
The elements and components that compose the Tri–Squared Standard Deviation are defined as follows: (a) T2 Tri2 = The Squared Total of All Nine Tri–Squared 3×3 Table Cell Values; (b) [TTri2]2 = The Total of All Nine Tri–Squared 3×3 Table Cell Values Squared; and (c) nTri2 – 1 = Total Number Tri–Squared Table Cells minus One. The elements and components that construct the Tri–Squared [Gaussian] Normal Curve are defined as follows: (1) Tri2 [x]= TTri2 /nTri2 = : = The Tri–Squared Mean; (2) Tri2 [s–3]= Three Standard Deviations below the Tri–Squared Mean; (3) Tri2[s-2] = Two Standard Deviations below the Tri–Squared Mean; (4) Tri2 [s-1] = One Standard Deviation below the Tri–Squared Mean; (5) Tri2[s+3] = Three Standard Deviations above the Tri–Squared Mean; (6) Tri2[s+2] = Two Standard Deviations above the Tri–Squared Mean; and (7) Tri2[s+1] = One Standard Deviation above the Tri–Squared Mean (Osler, 2014). Once the aforementioned equations have been applied and data has been calculated from them a Normal Distribution or “Curve” as a visual graphical model is constructed as illustrated in Figures 1 and 4 respectively.
Table 3 follows and illustrates how to conduct a Tri–Center Analysis using statistically significant sample data (Osler, 2014) (Figures 4 and 5 respectively). This aligns with biometrical research which illustrates the utility of a given statistical or mathematical procedure as presented by Ni et al in the Biometrics research article entitled, “Bayesian Nonlinear Model Selection for Gene Regulator y Networks”. In which the authors state, “We evaluate the performance of our methods against those of alternative methods using simulations studies (Ni, Stingo & Baladandayuthapani, 2015) ” (for the specific purpose of scientifically validating their research findings). Here the sample data is provided to clarify how a sample biotrichotometric research study could be conducted.
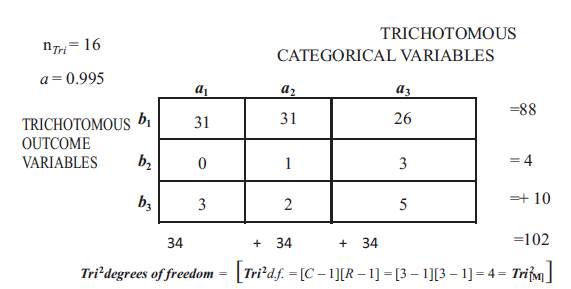
Table 3. A Tri2 3 × 3 Standard Table of Statistically Significant Sample Data
Sample data reported below was analyzed using the Trichotomous–Squared Standard Three by Three Table. The data was statistically significant and was collected based upon a Tri–Squared research investigation designed to analyze the research questions presented on an Inventive Investigative Instrument for sample data that had the following Trichotomous Categorical Variables: a1= [Sample data instrumentation measuring efficacy?]; a2=[Sample data instrumentation measuring environment?]; and a3=[Sample data instrumentation measuring ergonomics?]. The 3×3 Table has the following Trichotomous Outcome Variables: b1 = Positive; b2 = Negative; and b3= Neutral. The Sample Total Calculations are conducted as follows(Osler, 2014):
The Trichotomous measures of central tendency are determined via the following calculations: (1) Calculating the Sample Data Tri–Squared Test Mean = 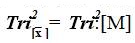 Tri–Squared Mean
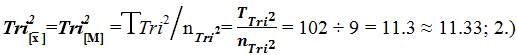 Calculating the Sample Data Tri–Squared Test Mode = Tri2[Mo] : (0, 1, 2, [3], [3], 5, 26, [31], Tri2 [Mo]1 = 3 and Tri2 [Mo]2 = 31 respectively; and (3) Calculating the Sample Data Tri–Squared Test Median Tri2 [Me]: (0, 1, 2, 3,[3], 5, 26, 31, 31) = 3. The Tri–Squared Test Result data yielded two modes that are unequal (31 > 3) thereby creating a “Tri–Squared Test Results Bimodal Distribution”. Thus, the Sample Statistically Significant Tri–Squared Test Results as a distribution is Bimodal (with dual bimodal maxima of 31 and 3 respectively).
There is a great deal of information that can be gleaned from observing the intricacies of this bimodal distribution. The larger mode (Tri2 [Mo]2 = 31) is known as the major mode is also called the “Acrophase”. The smaller mode (Tri2[Mo]1 = 3) is referred to as the minor mode is termed the “Batiphase”. The least frequent value between the modes is known as the “Antimode” (or Tri2 [AMo]) (Osler, 2014). The Tri–Squared statistically significant data has dual antimodes (Tri2[AMO]1 = 5) and (Tri2 [AMO] 2= 26). The difference between the major and minor modes is known as the amplitude. In the case of this data the amplitude between the acrophase and batiphase is very steep as 3 is much less than 31 (or 3 < 31). The Tri–Squared Test Results Bimodal Distribution of data has the following Visual Analytic Graph and Distribution illustrated Figure 2 and 3 respectively.
All Tri–Center Analysis Post Hoc Parametric Calculations are listed sequentially in the following list of Trichotomous Calculations: Note: nTri2 = 9, thus, the following can be applied to the series of sequential Tri–Center Analysis equations: (1) Tri–Squared Mean=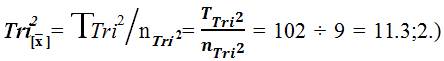 Tri–Squared Variance =
 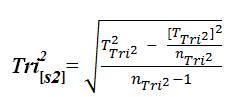 ([2646- [10404]/9÷ 8 = 186.25 Tri–Squared Standard Deviation
 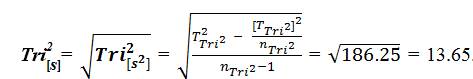 . The Elements of Tri–Squared Standard Deviation are as follows:a.) T2Tri2= 2646; b.) [TTri2] 2= 10404; and c.) nTri2– 1 = 8 (Osler, 2014).
The Elements of the Tri–Squared [Gaussian] Normal Curve are as follows: (1)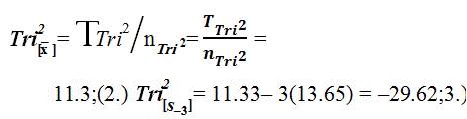 Tri2 [s-2]= 11.33 – 2(13.65) = –15.97;4.) Tri2[s-1] = 11.33 – 1(13.65) = –2.32;5.) Tri2[s +3] = 3(13.65) + 11.33 = 52.38;6.) Tri2[s+2] = 2 (13.65) + 11.33 = 38.63; and7.) Tri2[s+1] = 1(13.65) + 11.33 = 24.98. Plotting and Interpreting Data on the Tri–Squared [Gaussian] Normal Curve follows using the statistically significant sample data and outcomes that were provided earlier. Note the following Normal Curves that illustrate how and where normal distribution data is plotted as it is calculated from the 3 by 3 Tri–Squared Test Table (Figure 4) (Osler, 2014).
Figure 5 follows and illustrates the plotted Tri–Center Analysis Data Points on the Tri–Squared [Gaussian] Normal Curve for the statistically significant sample data. The vast majority of the Tri – Squared Test sample data falls between –1sd and +1sd = –2.32 and 24.98. This includes records Trichotomous Categorical and Outcome data reported as (0, 1, 2, 3, 3, and 5). This accounts for 2/3rds of the Tri–Squared Table results. This is in tandem with the traditional Gaussian Normal Curve that has approximately 68% (from 34.1% + 34.1% = 68.2% rounded to 68%) of all scores falling between –1 and +1 standard deviations. The remaining statistically significant sample data can be found between +1sdand +2sd= 24.98 and 38.63 respectively. This accounts for the remaining 1/3rd of the of the Tri–Squared Table results (26, 31, and 31). This is also in tandem with the traditional Gaussian Normal Curve that has approximately 14% (actually 13.6% rounded to 14%) of all scores falling between +1 and +2 standard deviations (Osler, 2014).
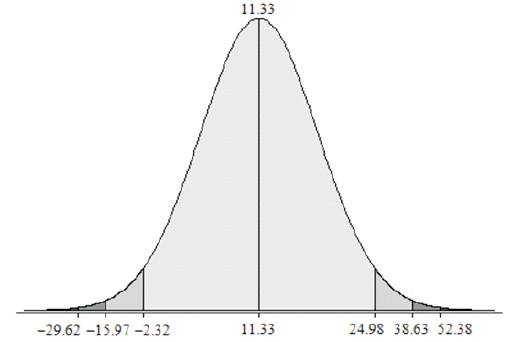
Figure 5. Tri–Squared [Gaussian] Normal Curve with Sample Data
The ergonomic viability of the Biotrichotometrics in the form of the Tri–Squared Test and the post hoc use of Tri–Center Analysis on statistically significant Tri–Squared Test data provides a plausible statistical measure that allows investigators to interpret the in–depth and rich complexities of Tri–Squared research data (Osler, 2014). Initially the Tri–Squared Test is designed to transforms qualitative data into quantitative data for specific purpose of examining Trichotomous Categorical and Outcome Variables(Osler, 2012a). Tri–Center Analysis further transforms the quantitative data into measures of Tri–Central data that can be analyzed to determine the within differences of 3 × 3 Tri–Squared Test data as a holistic group (Osler, 2014). Biotrichotomy observations are based on measures of center. These measurements can be further interpreted and generalized (Osler, 2014). Through Tri–Center Analysis, the statistically significant data has a Post Hoc additional quantifiable form that can be advanced as a parametric norm–referenced data distribution. In this new form the data can then be analyzed using a z–score or a t–score (depending upon how the research investigator wishes to examine the data). Thus, Tri–Center Analysis allows for a more strict set of data analysis procedures (that are designed to obey the general conventions of traditional parametric statistics). It also removes any possible biases that may occur by applying purely subjective observations that do not rely on purely quantifiable data to determine differences in research outcomes (Osler, 2014).
Based upon the findings the author makes the following recommendations:
(1) Further research should be done by analyzing a variety of data to further illustrate the utility and viability of the Biotrichotometric statistical methodology;
(2) The mixed methods Trichotomous–Squared instrument is cutting edge and blazing new paths in research. Using such a quantitative tool to convert qualitative data makes the research data more statistically sound and allows for less doubt within the educational research community (Nash, 2014). This research methodology should be shared with the biological sciences community and can thereby add to the science of “Biostatistics”. As stated by educational researcher Nash, “Putting science to education is a paradigm shift” (Nash, 2014); and
(3) In terms of the Biotrichotomous metric, shared collaboration should take place between the education sector and the sciences sector so that ground breaking research using newer statistical metrics can better enhance “the body of knowledge” in both arenas.
Biotrichotomous Tri–Center Analysis is grounded in the Gaussian Normal Distribution (or “Parametric Normal Curve”). The Normal Distribution has the assumption that the data is symmetrical and can provide great functional utility to the process of analyzing Post Hoc Tri–Squared Test outcomes (Osler, 2014). In support of the use of the Normal Distribution as a Post Hoc Tri–Squared Test Metric, mathematical and statistical historians John Aldrich and Jeff Miller (2007) state, that in statistical probability theory, that the Normal (or Gaussian) Distribution is a very common occurring continuous probability distribution (Osler, 2014). They further state that it is a function that tells the probability that an observation in some context will fall between any two real numbers (Aldrich and Miller, 2007). This is ideal for Tri–Center Analysis as it is designed to determine where Post Hoc Tri–Squared Test values fall in relation to one another. It also accurately describes the Tri–Center Analysis research methodology and data analysis process which is as follows: “In terms of statistically significant Tri–Squared Test outcomes, the distribution of values in the Tri–Squared 3 × 3 Table are based on a given set of Trichotomous Categorical and Outcome Variables administered to a selected sample size (determined at the research outset according to the established interval extracted from the “Tri–Squared Distribution Sample Size Table”) can be plotted via Tri–Center Analysis on the Gaussian Normal Curve (i.e. “The Normal Distribution”). Aldrich and Miller (2014) also state that normal distributions are extremely important in statistics and are often used in the natural and the social sciences for real–valued random variables whose distributions are not known. As stated in, “Tri–Center Analysis: Determining Measures of Trichotomous Central Tendency for the Parametric Analysis of Tri–Squared Test Results” (2014), “This illustrates the value of the Tri–Center Analysis methodology. It clearly allows observations and generalizations regarding the placement and percentile values of the Post Hoc statistically significant Tri–Squared outcomes within its own set of Trichotomous values”. Through the practice of biotrichotomy,biological research investigators can gather novel trichotomous insight regarding nature through the use of the Tri–Squared Test and Tri–Center Analysis.