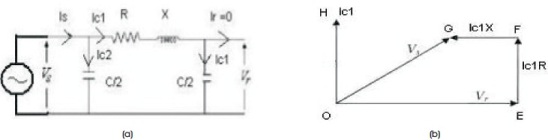
Figure 1. Pi Model of Transmission Line (a) No Load, (b) Phasor Diagram (Deb, 2012)
This work presents Ferranti effect simulation of an unloaded long transmission line using transmission line hardware simulator. From the conducted experiment with transmission line simulator, the values of three phase voltages at sending end and receiving end were found, which proves the Ferranti effect. Further in this work, the influence of the Ferranti effect on the voltage at the receiving end when changing the line length is shown and how to overcome this effect by compensating an inductive reactor and a switching transformer taking into account a 400 km transmission line. It is concluded that shunt inductive reactance compensation will be helpful to reduce the Ferranti effect in long transmission line and maintain the acceptable voltage at the receiving end. Tap changing transformer will be useful in medium transmission line to maintain the voltage at the receiving end. This will reduce the voltage stress on the insulators in transmission system.
Transmission lines draw a substantial quantity of charging current. If such a line is open circuited or very lightly loaded at the receiving end, the voltage at the receiving end may become greater than the voltage at transmitting end. This is known as Ferranti effect and is due to the voltage drop across the line inductance being in phase with the sending end voltage. Therefore, both capacitance and inductance are responsible to produce this phenomenon. The capacitance and charging current is negligible in short line but significant in medium line and applicable in long line by equivalent π model. It is proportional to the square of lengths of lines, that is, ΔV∝kx2, where x is the length of line and k is a constant for all voltage levels (Park et al., 2006). μ Due to high capacitance, the Ferranti effect is much more pronounced in underground cables, even at short lengths. Figure 1 shows the equivalent π modeling of transmission line used to demonstrate Ferranti effect and the phasor diagram showing relationship between sending end and receiving end voltage. Figure 1 shows Pi model of transmission line at no load and its phasor diagram (Deb, 2012). In phasor diagram of Figure 1, OE represents the receiving end voltage Vr, OH represents the current Ic1 through the capacitor C/2 at the receiving end. The voltage drop Ic1R across the resistance R is shown by EF and it is in phase with Ic1. The voltage drop across X is Ic1X. It is represented by the phasor FG which leads the phasor Ic1R by 90°. The phasor OG represents the sending end voltage Vs under no-load condition.
Figure 1. Pi Model of Transmission Line (a) No Load, (b) Phasor Diagram (Deb, 2012)
The Ferranti effect is a phenomenon where the steady voltage at the open end of an uncompensated transmission line is always higher than the voltage at the sending end. It occurs because of the capacitive charging current flowing through the inductance of the line and the resulting over voltage increases according to the increase in line length (Park et al., 2006). Traditionally the most accurate transmission line models have been based on a constant transformation matrix with frequency dependent modes. This type of model may give satisfactory results for situations involving high frequency transients, but the accuracy often deteriorates in the low frequency area due to frequency dependency of the transformation matrix (Gustavsen et al., 1999). In long transmission lines, the most important factors which affect the power frequency voltages on the line during normal operation and the increase in voltages during a fault are the length of the line and the degree of shunt compensation. Both parameters have a major indirect influence on the transient phenomena connected with the initiation or clearing of a fault, as well as with normal switching operations (Ibrahim & Dommel, 2005). In the paper by Deb (2012), a study of Ferranti effect in electrical transmission line has been done. The study is based on both software and hardware. The MATLAB program gives the locus of sending end voltage with line length which shows that receiving end voltage is greater than sending end voltage. From the experiment with transmission line simulator, the values of three phase voltages at sending end and receiving end were found which proves the Ferranti effect. These two methods were used to understand the idea about the Ferranti effect.
Kumar and Singh (2014) utilized the circle diagrams, derived from ABCD parameter, as a graphical technique for analyzing the power flow variation, i.e., active, reactive, and apparent power at different voltage levels, at sending and receiving ends, or the transmission lines. Further, indices are proposed to evaluate the power flow variation with voltage. The voltage deviation index, power transfer stability index, power demand deviation index, transformer loading index and transmission line loading index have been considered. The performance of each transmission line is compared with other lines in the interconnected system, and the Distributed Generation (DG) power must be installed at the optimal grids station to improve performance, as estimated by the DG implementation algorithm based on the comparison (Khan et al., 2016). In Mali et al. (2016), performance analysis of transmission line has been carried out and Ferranti effect and short circuit fault have been studied. The study has been done using MATLAB/Simulink and has been experimentally verified on hardware. In open circuit or light loaded condition, it has been observed that receiving end voltage is slightly greater than sending end voltage in both, simulation as well as in hardware. During short circuit condition a relay has been used to trip the fault condition and line is isolated from the grid. Experimental and simulation results have been presented.
In Hlaing and Aung (2012), the transmission line is compensated with shunt reactors, series and shunt capacitors to improve transient and steady-state stability, more economical loading, and minimum voltage dip on load buses and to supply the requisite reactive power to maintain the receiving end voltage at a satisfactory level. The system performance is tested under steady-state condition. In Gaikwad et al. (2017), in-house demo model is developed which will be helpful for finding out voltage regulation as well as to observe voltage profile on transmission line. This model will not only be used to observe Ferranti effect but also to do online monitoring of parameters.
The single line diagram of a Transmission Line Simulator is shown in Figure 2.
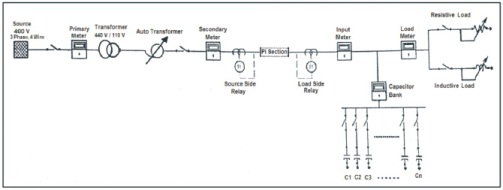
Figure 2. Single Line Diagram of Transmission Line Simulator
The procedure to conduct performance analysis of transmission line is as follows;
The experimental setup of transmission line simulator (TLS) is shown in Figure 3.
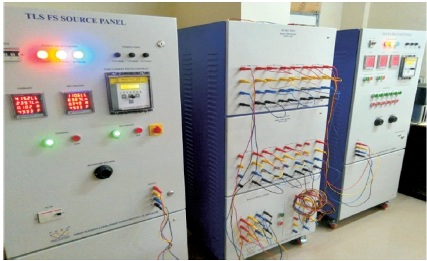
Figure 3. Experimental Setup of Transmission Line Simulator (TLS)
Step 1: The two Pi sections are are connected in series or parallel in such a way the parameters R, L,and C can change accordingly. The calculated parameters of each Pi section (for 200 km) is as follows,
Resistance: 1.869 Ω
Inductance: 28.5 mH and
Capacitance (C/2): 6.93 μF
Step 2: To compute the receiving end voltage of the entire line, Equation (1) is used.
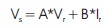
where,
Vs and Vr = sending and receiving end voltage Respectively.
Is and Ir = sending and receiving end current respectively.
In a transmission, ABCD are the generalized parameters and they are calculated as follows:
A = D = (ZY/2) + 1
B = Z
C = Y (1 + (ZY/4))
where, Y and Z are shunt impedance.
Considering unloaded line implies Ir = 0, hence we have
Vr = Vs/A
Using the calculated parameter of Z and Y/2 for Pi section, we have
Ztotal = 10.55575 Ω
Y/2total = 0.00226194 Ʊ
A = 1.023945
Vr =113.8 V
The performance analysis of transmission line using real time transmission line simulator is tabulated in Table 1 for unloaded condition, Table 2 for unloaded condition with shunt reactive compensation, and Table 3 for unloaded condition with tap changing transformer with different tapings.
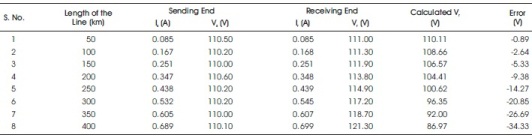
Table 1. Transmission line Unloaded Condition
Figure 4 shows the variation of receiving end voltage with variation of line length and shunt reactive compensation.
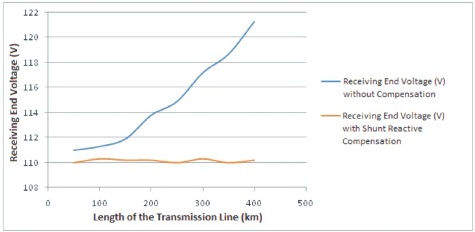
Figure 4. Variation of Receiving End Voltage with Variation of Line Length and Shunt Reactive Compensation
From Table 2 and Table 3, it is shown that with increase of line length, the receiving end voltage of a transmission line is increased under no load due to Ferranti effect. Because of this there is a voltage stress on the insulators at the receiving end of a transmission line. To reduce this stress, on insulators, shunt reactive compensation is provided at the receiving end of a transmission line for long transmission line. Tap changing transformer at the sending end will be able to control the receiving end voltage only up to 200 km line length. With the compensation, the voltage at the receiving end of a transmission line is maintained a nominal value.
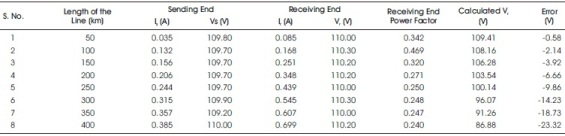
Table 2. Transmission Line Unloaded Condition with Shunt Inductive Reactor Compensation
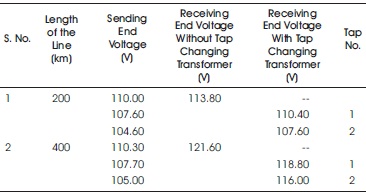
Table 3. Transmission Line Unloaded Condition with Tap Changing Transformer
In this paper, the hardware simulation of long transmission line has been demonstrated. There is an increase in receiving end voltage due to Ferranti effect along the transmission line length. It occurs when the line is energized with a no load or very light load. This effect is due to the voltage drop across the line inductance being in phase with the sending end voltages. Therefore, inductance is responsible for producing this phenomenon. The Ferranti effect will be more when the transmission line length is more with voltage applied. This Ferranti effect can be reduced with shunt inductive reactor compensation at the receiving end for long transmission line. The tap changing transformer at the sending end can be used for medium transmission lines to reduce Ferranti effect. The outcome of this work can be used to provide proper compensation while energizing long transmission line under no load condition. This will reduce the voltage stress on the insulators in the transmission system, enhancing the life of the insulators and line which can be protected against short term over voltage.