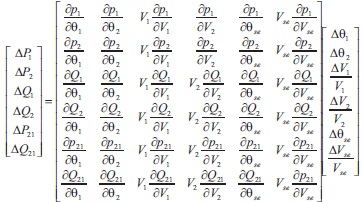
where Vs is the voltage source, VK is the bus voltage, ΔP and ΔQ are NR power flow equations Δθ and Δδ are the power angles.
1.2 SSSC Power Flow Modeling
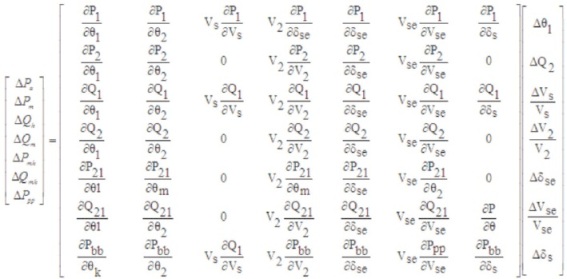
A static synchronous generator operated without an external electrical energy source is called SSSC and the aim of SSSC is to increase or decrease the overall reactive voltage drop throughout the transmission line and thus controlling the transmitted electric power by injecting regulated series voltage. The injected voltage source is represented as Vse and Zse is the combined admittance of SSSC and the connected line and the linearised model of SSSC is given by N-R power flow modeling equation (Zhang, 2003; Zhang et al., 2004, 2012).
where V1 and V2 are the bus voltages, ΔP and ΔQ are the NR power flow equations Δθse and Δδse are the power angles of injected voltage source.
1.3 UPFC Power Flow Modeling
A combination of separate shunt and series voltage source converters operates on either unified power flow manner or coordination manner in UPFC. In general, the variable reactive current has been injected by the shunt at the point of connection and the variable reactive voltage in series with the transmission line has been injected by the series controllers.
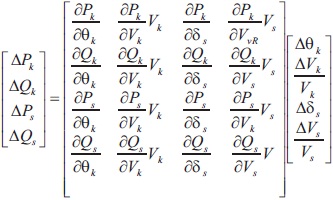
The shunt and series compensators like UPFC controls real power flow, reactive power flow and enhance the voltage profile at its terminals. The injected voltage source is represented as Vse ∠δse and Zse is the combined admittance of UPFC series controller and the line and the injected current source is represented as Vs ∠δs and Zs and the linearized N-R power flow modeling equation of UPFC is given in Equation (3) (Fuerte-Esquivel & Acha, 1997; Fuerted Esquivel et al., 2000; Nabavi-Niaki & Iravani, 1996; Povh, 2000).
where, Vs is the voltage source, V2 and Vse the bus voltages (Shunt and Series), ΔP and ΔQ are NR power flow equations (Shunt and Series), Δθ and Δδ are the power angles of injected voltage sources (Shunt and Series).
2. Placement of FACTS Using Heuristic Techniques
Different heuristic (GA, PSO and HGAPSO) techniques are used for placement of different FACTS (STATCOM, SSSC and UPFC) devices after determining the NR power flow modeling equations.
In this section genetic algorithm (GA), particle swarm optimization (PSO) and GAPSO optimization methods are discussed to optimally identify the location of above FACTS devices implemented in a MATLAB environment to reduce the power (Active and Reactive) transmission losses and enhance the voltage profile of the system more significantly.
2.1 Genetic Algorithm (GA)
A very powerful nontraditional optimization method is GA and it mimic the process of evolution based on the mechanism of natural selection and natural genetics. It has been developed based on the survival of the fittest concept, i.e., successful generations become better and better compared to previous generations and it is inspired by Charles Dravin's theory of natural evolution.
Selection, crossover and mutation operators in GA to get optimal solution, fittest individuals are selected among the population for crossover to produce better offsprings of the next generation and to avoid premature convergences and maintain diversity in the population mutation operator used.
In this research paper GA is used to obtain optimal location of STATCOM, SSSC and UPFC by initializing total branch numbers along with sizes of above FACTS devices. By using GA and randomly placing above FACTS devices at each and every bus/line of the standard IEEE 30 bus test system, the minimum losses of the power transmission system are identified and printed for each generation. The losses are then compared, and the smallest losses are found, and the losses are compared to previous generation losses; if the current generation estimated losses are less than the previous losses, the current generation losses are printed; otherwise, the previous generation losses are printed. The above procedure is repeated until all generations have been completed, and at this point the best UPFC locations and sizes are determined (Bansal, 2005; Engelbrecht, 2007).
2.2 Particle Swarm Optimization (PSO)
PSO is developed by Eberhart and Kennedy in 1995 based on inspiration of social behavior of bird flocking or fish schooling.
PSO having many similarities with GA. In case of GA we are considering single or two fittest individuals selected at each and every generation among the population with help of selection, crossover and mutation operators to get the optimal solution, whereas, in the case of PSO we are considering group of particles at every iteration to get optimal solution and hence the computation time of PSO is faster than GA to get convergence.
In PSO all the particles flies dynamically according to their own experience and neighboring particle experiences. In the search space for optimal location with velocities (sizes or weights) at each and every iteration this process is continued until completion of all the iterations to minimize the power losses and enhance the voltage profile with optimal location of STATCOM, SSSC and UPFC devices along with the sizes (Bansal, 2005; Engelbrecht, 2007).
2.3 Hybrid GAPSO
The STATCOM, SSSC and UPFC placements using GA and PSO basically experiences some problems to achieve optimality. In GA at every generation for optimality it performs selection, crossover and mutation operations. Hence GA method of location of above FACTS devices on IEEE-30 bus test system experiences lower convergence speed. The optimal placement of above FACTS devices using PSO also suffers with premature convergence due to low dissimilarities because at every iteration all the particles are through the search space for optimality.
The above said issues in GA and PSO heuristic methods are modified to achieve higher convergence speed. Efficient search technique is developed by utilizing combined features of GA and PSO algorithms called as GAPSO algorithm. By using this algorithm high diversity and lower computational cost is achieved (Sharma et al., 2014).
2.3.1 Procedure for Optimal Placement of FACTS by using Heuristic Methods
The flowchart for the FACTS procedure is given in Figure 1. The steps are,
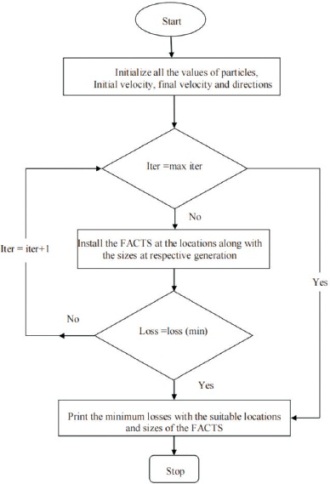
Figure 1. FACTS Flow Chart
Step 1: Define the power losses minimization as the objective function.
Step 2: Initialize the number of particles and the maximum number of iterations to achieve the objective.
Step 3: Run the NR power flow analysis for IEEE 30 bus systems in a MATLAB lab environment for the above random values.
Step 4: Randomly initialize the direction and velocity (The size and location of FACTS) of each particle and calculate the fitness of each particle i.e. Pbest and Gbest are stored.
Step 5: The crossover and mutation are performed and then the direction and velocity of each and every particles are found with the Equations (4) and (5).


where, Vik =Velocity of agent i at Kth iteration, ViK+1 = Velocity of agent i at (K+1)th iteration, W=the iteration weight, C1 =C2 = acceleration constants (0 to 4), Sik = Current position of agent at Kth iteration, SiK+1 = Current position of agent at (K+1)th iteration, Pbest = Pbest agent i, Gbest = Gbest of the group, rand1= rand2= random numbers (0 to 1).
Step 6: If iteration is equal to maximum iterations, then display losses and identify the suitable location and sizing of FACTS devices with respect to the objective function (Gbest is selected among the Pbest) and then stop the program else go to next step.
Step 7: If the iteration is less than the maximum iteration, then update the direction and velocity along with incrimination of the iterations and run the load flow for optimal locations and sizing of the FACTS devices otherwise go to next step.
Step 8: Next, if the losses are equal to the previous losses then go to step 3 otherwise the minimum losses location and sizing of FACTS devices are identified among all the particles (Gbest is selected among the Pbest) then go to next step.
Step 9: Continue the above procedure until the maximum iterations are reached otherwise go to step 5.
3. IEEE 30 Bus Systems
The GA, PSO and HGAPSO heuristic methods are applied on IEEE 30 bus test system as shown in Figure 2. The optimal placement of STATCOM, SSSC and UPFC reactive power compensating devices minimizes the active and reactive power losses and enhances the voltage profile.
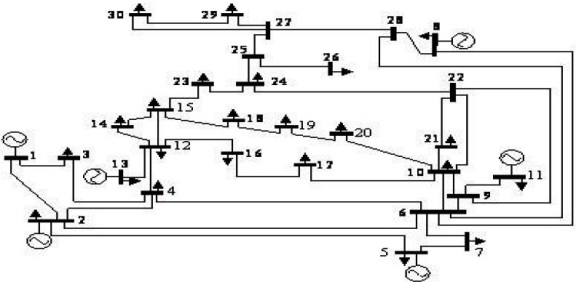
Figure 2. IEEE 30 Bus System Single Line Diagram
4. Results and Discussions
FACTS devices have impact on the reactive power flow through the lines which will change the voltage profile and further reduce the losses, the effect of optimal location and sizing of STATCOM, SSSC and UPFC devices using GA, PSO and HGAPSO heuristic methods as explained in this section.
Table 1 represents the location and size of different FACTS devices and also gives the information about the minimum voltage profile, maximum voltage profile, active power losses and reactive power losses with FACTS devices and without FACTS devices on IEEE 30 bus test system by using GA, PSO and HGAPSO techniques.
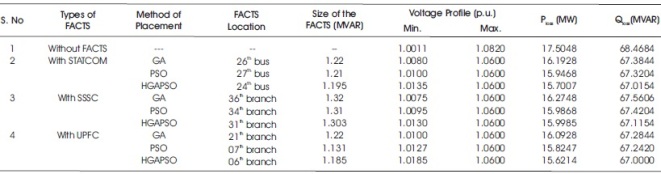
Table 1. Comparative Analysis of Real and Reactive Power Losses without FACTS and with FACTS on IEEE 30 Bus System by using HGASO Method
The STATCOM device by using GA technique and the optimal location has been identified at 26th bus and this location has been very far away from the generating stations. Hence, at this location large amount of reactive power compensation is required to minimize the losses of the system as the reactive power drawn from the PV buses are majorly influenced by the voltage profile of the buses. By using PSO technique the location has been identified at 27th bus and is located near to the generation station. Hence, as compared to GA method of placement, PSO method of placement is optimal and hence the reactive power compensation is lesser than GA method of placement.
Similarly, using HGAPSO technique, the optimal location is identified at 24th bus which is almost equidistant from all the generating stations. Hence the reactive power compensation is very less as compared to GA and PSO for same level of power transmission and also power loss reduction and voltage profile enhancement are more significant in case of HGAPSO method of optimal location of STATCOM device.
SSSC is a series compensation device and is connected in series with the transmission line. Using GA technique SSSC is connected on 36th branch which is very far away from most of the generating stations but by using PSO technique the optimal location has been identified on 34th branch. By using HGAPSO technique the location has been identified at 31st branch for SSSC placement and both the locations are also away from the generating stations but these are equidistant from all the generating stations.
But the cumulative line losses with STATCOM placement methods are lesser when compared to cumulative losses in SSSC placement methods. So the impacts on the reduction of the real and reactive power losses are lesser when compared to the STATCOM placement method.
In the UPFC placement using GA method, the optimal location has been identified at 21st branch which is almost equal to all the generating stations and by using PSO technique, the optimality has been identified at 07th branch which is also equidistant and near to all the generating stations.
Using HGASO technique, the UPFC best location has been identified at 06th branch which is nearer and equidistant from all the generating stations. From the Table 1 with the effect of UPFC placement using HGAPSO technique, the active power losses and reactive power losses are reduced from 10.78 percent and 2.15 percent. Whereas in the case of STATCOM placement using HGAPSO, the active and reactive power losses are reduced from 10.31 percent and 2.02 percent and with SSSC using HGAPSO method, the active power and reactive power losses are reduced from 8.60 percent and 1.97 percent respectively
The graphical representation of voltage profile improvement and power loss reduction by optimally placing STATCOM with different optimization techniques has been shown in the Figures 2 and 3 respectively.
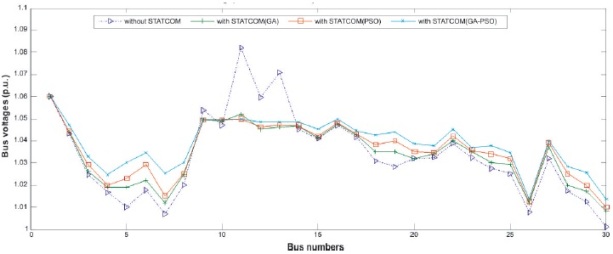
Figure 2. Voltage Profile Before and After Placement of STATCOM by using HGAPSO Heuristic Method for IEEE 30 Bus System
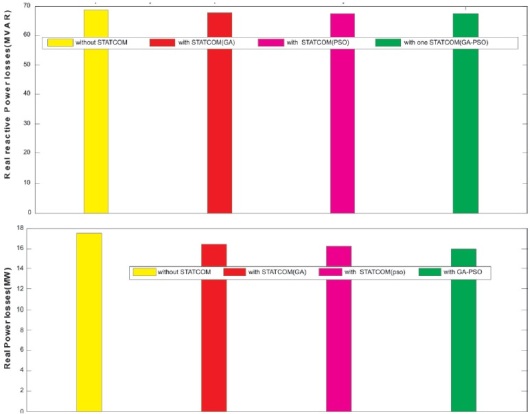
Figure 3. Total Real Power Losses and Reactive Power Losses Before and After Placement of STATCOM by using HGAPSO Heuristic Methods for IEEE 30 Bus System
The voltage profile improvement and power losses reduction before and after placement of SSSC are shown in Figure 4 and 5 respectively.
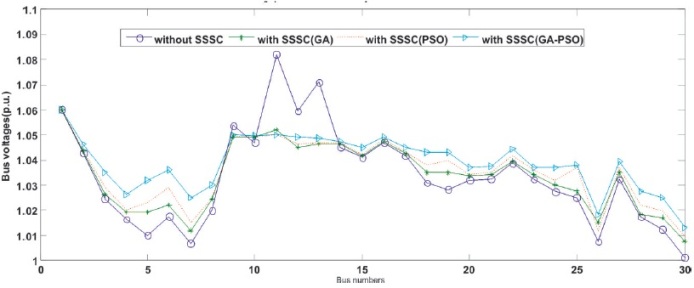
Figure 4. Voltage Profile Before and After Placement of SSSC by using HGAPSO Heuristic Method for IEEE 30 Bus System
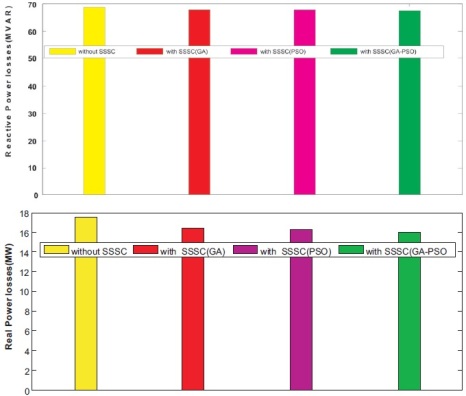
Figure 5. Total Real Power Losses and Reactive Power Losses Before and After Placement of SSSC by Using HGAPSO Heuristic Methods for IEEE 30 Bus System
Figures 6 and 7 indicates the significant improvements in the voltage profiles enhancement and power losses reduction in a power transmission system before and after placement of UPFC.
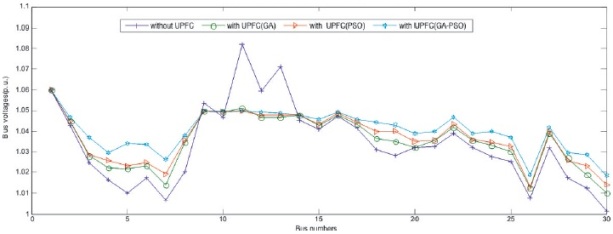
Figure 6. Voltage profile before and after placement of UPFC by using HGAPSO Heuristic method for IEEE 30 bus system
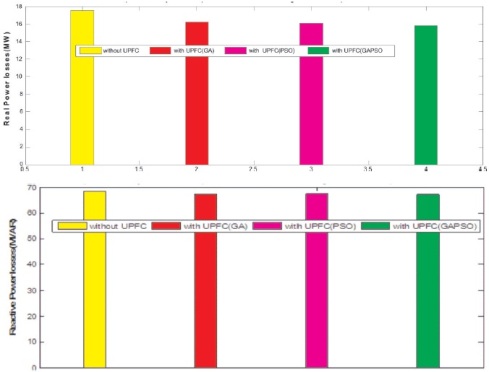
Figure 7. Total Real Power Losses and Reactive Power Losses Before and After Placement of UPFC by using HGAPSO Heuristic Methods for IEEE 30 Bus System
Conclusion
In this paper, the impact of location of shunt, series and series-shunt FACTS devices such as STATCON, SSSC and UPFC are discussed to enhance the voltage profile and minimization of active power and reactive power losses using GA, PSO and GAPSO heuristic techniques. MATLAB simulations were performed on IEEE 30 bus test system and also discussed the FACTS devices locations and reactive power compensation effects based on the generating stations by using different heuristic methods are explained.
Due to superior functional characteristics and advantages of UPFC over STATCOM and SSSC, the best location of UPFC is being identified by using the HGAPSO method gives better results than GA and PSO methods of placement of UPFC. Further it is identified that with the effect of UPFC, the voltage profile enhancement and more significant decrement of power (Active and Reactive) transmission losses than STATCOM and SSSC.
Hence from the above analysis, it is concluded that compared to STATCOM and SSSC optimization based on GA, PSO and HGAPSO, the UPFC placement using GA, PSO and HGAPSO on IEEE 30 bus system gives better performance in terms of power losses reduction and voltage profile enhancement.