Figure 1. Phasor Estimation using PMU Connected to CT and PT
Present day power system is moving towards Smart Grid for more reliable, secure and economic operation. Data mining is the process of turning raw data into some useful information. Data mining is necessary as more number of PMU's added into the nations Power grid generates huge data which is necessary to take actionable insights. In this paper we are discussing state of art related to data mining techniques, present big data architecture and software languages and tools that facilitate data mining to power system.
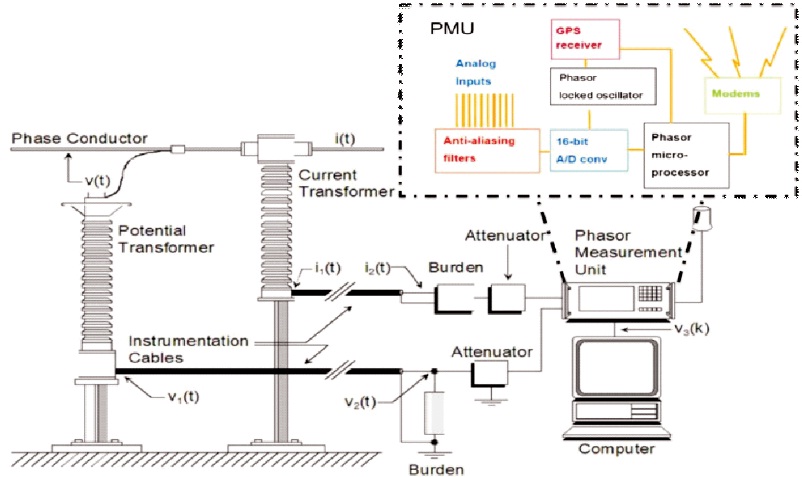
Synchrophasor technology uses PMUs to monitor electrical quantities like voltage, current phasors, and frequency at specific locations on an electric power system. PMUs estimate phasor values typically 30 to 60 measurements per second using the measured voltage/current values (13U.S. Department of Energy, 2013) and by taking GPS signal as a reference clock, time stamping is provided for synchrophasor values which are as depicted in Figure 1. This information provides a high resolution view to transmission grid planners and operators about the current status of power system in real time and the stored data can also be used for post-analysis of various types of disturbances.
Figure 1. Phasor Estimation using PMU Connected to CT and PT
The investigation report of North America's blackouts reveals that major disaster have been caused by inadequate situational awareness for grid. Muir and Lopatto (2004) carried out an investigation of August 14, 2003 blackout and reported that the disaster could have been prevented if immediate actions were taken by both Canada and US authorities. Then onwards the usage of PMU was increased. After 2008 it is recommended that the real-time operational tools should have high speed capabilities, both in accessing and processing power system data, which enhances the reliability of electric power systems.
Data mining process examines raw data, which gives new insight or information using statistical and mathematical algorithms (Ge et al., 2015). Everyday utilities are generating different variety of data which is relevant to reliable, resilient and optimal operation of the electric grid. Various types of data from different sensors describe the different aspects of grids behavior. The different type of collected data stored systems which cannot be combined very easily. By bringing this data into one place, that data must be easily used, visualized, analyzed and consumed for different applications or it can be thrown away after some days or same data can be utilized for the next decade. The important philosophy underlying the big data revolution is that, this data is more valuable and if we compress it then we may loss the data and we may loss the information which describes the grids behavior forever (Daki et al., 2017). In many cases intentionally throwing away the data in an age when storage is available easily. But retaining complete data also increases the probability of containing some events or system states. Further this high frequency data gives the information which helps machine learning algorithms to predict failure of an asset. Finally retained big data may be easily accessible and usable, which may generate new ideas of previously unimagined applications will be built.
In the following section different types data mining techniques are discussed in detail.
Feature extraction is one of the preprocessing tools which are commonly used when data sets are very large and redundant information is expected within the data. The features are usually derived from the raw data. These features may be simple summaries like means or standard deviations, like a nonlinear or linear combinations of variables. These features are smaller in size as compared to raw data which can be used as inputs for various types of analytical algorithms. The different type of multiple feature extraction methods are as explained below.
The dimensionality reduction is the main purpose of principal component analysis (PCA) (Chen et al., 2013). When the data is in matrix format where rows containing the observations and columns containing the features, then principle component analysis technique can be applied. If the features are in different magnitude then it is recommended to normalize the each column by taking the variance otherwise the feature with higher magnitude will receive more weight. Then compute the covariance matrix of the data matrix. After that, find the eigen values as well as eigenvectors of covariance matrix. The sum of all eigen values is the total variance of the sample data.
Based on measured variables or characteristics grouping of similar observations or objects can be done in this process. Here set of data is partitioned into number of groups based on similarity. Class of data in one cluster is more similar to data in another cluster. Data clustering is used in many applications like data analysis and pattern recognition etc.
K-means algorithm is one of the popular parameter dependent clustering algorithms. It is an iterative algorithm that tries to partition the dataset into predefined subgroups (clusters) where each set point belongs to only one group. This is an example of hard clustering where each observation is assigned to group. This algorithm is dependent on observations that start the algorithm, because the group means are a function of the previous observations that were already clustered into the groups. Usually k-means is run with many different random starts to help the methodology to optimize. The user has to define either the number of groups that are expected to exist, or the actual means of the groups.
Hierarchical clustering is one of the most commonly used clustering algorithm. This type of clustering builds a hierarchy of clusters by either starting from the bottom up observations begins by themselves and then pair with the most similar points or top down observations begin in one group and then split out by being most different. This type of algorithm is also an example of hard clustering. This technique is also used to partition the power system network into some specific coherent zones (Eissa & Kassem, 2018).
Fuzzy clustering is soft clustering, where each observation belong to more than one group. Fuzzy c-means clustering algorithm is a widely used fuzzy method. This method is very much similar to k-means clustering but the concept of calculating fuzzyfier. Only the change here is the term fuzzifier which is calculated, that helps in calculating observations pertaining to multiple groups. This method clusters the poles and zeros of the original power system model into new clusters so that reduced-order model can be easily obtained. Then this model is used to design a proportional-integral type power system stabilizer to improve the damping in system oscillation after a system disturbance (Wang et al., 2006).
It is one of the most common parameter independent clustering algorithms where it is based on density-based clustering method. In this method observations are considered as outliers that exist in low density areas. It is a density based algorithm that forms clusters based on density of data points. DBSCAN initially select a point X arbitrarily then observes all the points that are density reachable from X. If X is a border point and no points are density reachable form X then it visits next point of the data base. This process will continue till all the points have been processed.
Basically this technique is depended on statistical learning theory which is used for learning classification and regression rules from data. When this technique is used for classification problems, then the algorithm is usually called support vector classification (SVC) and when used for regression problems, then the algorithm is support vector regression (SVR). Because of these characteristics this method has been widely used in different real-world applications. Outstanding properties of SVM technique are very much popular in predicting power system events. This technique uses a hypothesis space of linear functions in a high dimensional feature space, which is specially trained with a learning algorithm from optimization theory.
Some of these properties include:
In this section we are discussing about the various software tools and computer languages those are used in data mining algorithms. The most common open source languages are briefly discussed below.
It is one of the most commonly used open source language which is used for statistical computing. In developing analytical and graphical processes this language is very much helpful for data miners. This statistical software package comes with a steep learning curve. R language interfaces well with programming languages like C++, Python etc. Complete information about R language is available in Comprehensive R Archive Network (CRAN) Website. Many of the user developed packages that contains different mathematical and algorithmic tasks can be accessed on CRAN.
Especially for data analytics and machine learning this type of programming language is most commonly used. It is very much suitable for research as well as in large scale production systems. This is a kind of scripting language where compilation of source code is not required before run. Hence it easy to port a Python program between computers and Operating Systems. This language supports procedural and objects oriented programming. This programming language can call external C or C++ programs which can be embedded in other languages to implement the scripting capability. Another most important quality of this programming language is, it has an incredibly large ecosystem of open source libraries which extends the capability of the language as compared with MATLAB's toolboxes.
This library provides a high-performance numerical computing data structures for vectors and matrices with most common mathematical functions.
This type of open source library is used to solve scientific and mathematical problems.
It is a plotting library for Python programming language. This type of library provides visualization option and specially designed to provide mimic and replicate the functionalities offered by MATLAB.
This library is used in open source data analysis for Python. This library provides an easy way to create, manipulate the data.
One of the free software Machine Learning libraries for Python is Scikit. It has become the reference library for machine learning algorithms including support vector machines, random forests, DBSCAN etc. Scikit is one of the efficient tool for data mining and data analysis which is very simple and easily accessible to everybody.
MLPY is another Python module for Machine Learning which is developed on top of NumPy / SciPy using GNU Libraries. Especially this module provides wide range of machine learning methods for solving different supervised and unsupervised problems.
Google has released Python library for fast numerical computing application especially for data mining packages for neural network in the year 2015 under open source license. This type of Python library is also applicable to languages like C and Java.
It is a data science platform that unites data preparation, machine learning and predictive model deployment. It is a GUI interfaced data mining tool. This data mining software can be used freely when analyzing large amount of PMU data i.e., more than 10000 rows in less than 3 minutes. This has very good and easy to use graphical capabilities which are very much essential in power system visualization.
It is one of the Machine Learning based software tool with GUI interface. This software enhances the developer's capability to create their own machine learning algorithms for unique applications.
For data mining and Machine Learning methods, Orange is one of the open source software package available with a GUI. This software package also has simple data manipulation and visualizations capabilities also.
In transmission networks PMU brought new opportunities for more intelligent and secure control from precise and timesynchronized measurements that make the grid behavior comparable between different locations. The high resolution synchrophasor data usually 30 to 60 samples / second (huge volume of data) enabled the application of data mining as well as machine learning techniques in both operations and planning environment. Synchrophasor data and historical data both can be used in real time applications such as event detection, stability monitoring etc. Data mining techniques are used to assess operating condition of the grid which helps grid operators to take the correct action to mitigate future problems and also highlights on system security threats. Huge amount of recorded and stored or historical synchrophasor data can be utilized for offline applications also.
Gadde et al. (2016) discussed that compression methods are necessary to archive the PMU data. He also stated that several methods essentially seek to maximize the Compression Ratio (CR), and minimize the loss of data, which is measured by certain error metrics but the parameters chosen for chosen compression technique are heavily depends on the nature of the data. In normal condition PMU data remains almost constant or varies slowly but when disturbance occurs, speed and data variation will vary drastically based on type of fault. Therefore, any compression technique chosen to compress PMU data with high fidelity should be able to detect a disturbance and change the compression parameters for efficiently compressing any disturbance data.
Klump et al. (2010) discussed that around 100 PMU's for 30Hz sampling rate having 20 measurements generates more than 50GB data in one day. For the 60Hz or 120 Hz sampling rate in modern PMU's generates more than 100GB or 200GB data respectively. This means that even larger volume of data need to be stored in PDC's or may be transmitted to Super PDC's further. The disturbance monitoring and reporting requirement (NERC PRC 002-2) requires that actual recorded disturbance data to be preserved for only 10 calendar days. However, all PMU data will be finally achieved by utilities. This archived data of PMU can be utilized for testing new wide area monitoring and control applications.
Khan et al. (2014) discussed about the use of Wavelet Packet Decomposition (WPD) based technique to compress the PMU data resulting in a low CR of 2 with root −6 mean square error (RMSE) of 3.68 × 10 . But the extensive application of the WPD algorithm is not only to the denoising and compression but also for the analysis of different type of signals in SG. Therefore the research gap in this paper is that we can use another metric along with the SNR to assess the quality of the compressed data based on the extent of essential information of the data that has been preserved after compression.
In Top and Breneman (2013), they discussed about a comparative assessment of standard compression algorithms, where szip algorithm is used to achieve a CR of 2.77 for voltage data and 3.77 for frequency data, which are low values.
Khan et al. (2015) introduced about an Embedded Zero Tree Wavelet based denoising and compression method, but it lacks proper analysis, and doesn't perform well for real PMU data.
Xie et al. (2014) proposed a dimensionality reduction algorithm for PMU data utilizing Principal Component Analysis (PCA) subspace for detection of disturbances, but the issue of compression is not adequately addressed in this paper.
Ge et al. (2015) proposed a real time event detection and data archival scheme, where PCA is used for event detection, and least square curve fitting method is used for compressing the data. Result shows CR of 63.3 for voltage data with RMSE of 0.176 for steady state data. But, CR reduces to 4 for voltage data at the time of disturbance. But the recorded current and frequency values are not considered by author because both will show different variations during the disturbance. Another point here is author has used data from campus microgrid not tested with large scale data from transmission systems which will show different disturbance patterns. Hence in this paper author tested results for large scale transmission data as it shows different disturbance patterns as compared to microgrid system.
In this paper we are focusing on the new method of improving power system online monitoring by using synchrophasor data. While the synchrophasor data offer many opportunities to improve the situational awareness. But for power system operators, it becomes a major challenge for large-scale to utilize the data in a timely manner. Power system authority needs to manage huge amount of data as more number of PMUs installed now a days in power system. Hence it becomes very difficult for the power system operators using the raw data directly for real-time decision making. As already conventional model-based monitoring and decision making tools are available in the control room, the introduction of PMUs offers new opportunities for real-time data driven analytics for the power system operators. Hence we propose a generalized method that works with any number of PMUs and significantly improves the CR while maintaining excellent fidelity, and show the robustness of the method on extensive data from field as well as from accurate simulations.
When disturbance occurs then multiple PMU's at different geographical locations are simultaneously captures different snapshots of the same event. Hence it stands to reason that the parametric signatures of all the snapshots would be similar in passion. The correlation among multiple local PMU data streams which are connected to PDC is used for the compression of data. Hence after studying several papers we are planning to use PCA technique to minimize spatial redundancy among data collected by different PMUs in future. In Kaur and Singh (2017), authors reviewed the literature on Data Mining and Big Data (Zhang et al., 2018).
In this section we are discussing about applications of different data mining tools with grid data, and especially with synchrophasor data. The high-resolution, time synchronized PMU data provides good observations which were not possible before without the phase inclusive angle measurements. Embedded information in PMU data can be utilized for various data mining and data-driven applications. In predicting short-time events and faults detections the different characteristics big data are effectively used to take the advantages of new machine learning applications. These activities are still in the Research & Development maturity level, indicating the ever growing interest of the power systems community in the application of these techniques on synchrophasor data.
The available statistical and machine learning methods can be applied to large synchrophasor data sets to detect different types of events (e.g. frequency or voltage) and abnormalities (Roy et al., 2018). The first approach is basically depends on user-specified thresholds for signal values and duration. Many of the electrical utilities uses this method to detect power system events. The second approach basically depends on multi resolution wavelet analysis which clusters one-dimensional signals into twodimensional components that overlaps in the timefrequency domain. Wavelet-based multi-resolution analysis (MRA) uses wavelet and scaling functions to decompose and construct signals at various resolution levels. Anomaly phenomena can be detected and localized at every resolution level. The cluster analysis and Principal Component Analysis (PCA) are used efficiently for identifying similarities between the events.
The high resolution and synchronized PMUs data can be effectively utilized for the implementation of different data mining techniques. Basically data mining is based on pattern recognition algorithms those can be used for power system analysis. Three pattern recognition algorithms are applied to perform data mining analysis. Firstly fault data classification is applied on PMU data, then faults which are occurring repeatedly are identified and finally the root cause of those faults are identified by clustering the parameters behind each scenario. For such classification three algorithms are chosen, k-Nearest Neighbor, Naïve Bayes and the k-means Clustering. Fault analysis becomes more challenging in presence of failures in protection system.
The large amount of synchrophasor data produced in the day to day operation of modern power systems has become a valuable resource for the development of advanced applications for both real-time operations, as well as for offline planning environment. An area of research that has recently attracted the interest of the power systems industry is the application of Artificial Intelligence, Machine Learning and Data Mining techniques with high resolution time synchronized measurements. This paper summarizes the state-of-the-art in data mining and analysis of big data and also provides an overview of the data mining software and open source tools. After referring several papers, we are planning to develop data compression method using PCA. The proposed compression technique is a very general technique and the same can be applied to a PDC fed from any number of PMUs and does not need any modifications if this number changes during operation.