 61,000/kW solar PV installation capacity, i.e. one can receive at most 18,300 per kW as subsidy on their solar power plant.
In order to address the double-pronged challenge of energy security and climate change, it is important for India to tap into its renewable energy resources to replace fossil fuel generated energy that adversely impacts the environment, in terms of resource use and GHG , particularly CO2 emissions. Technologies that harness this renewable energy need to be deployed at the points of consumption. Pune city in the heart of the state of Maharashtra faces rapid urbanization and a burgeoning demand for electricity. In fact, where energy consumption is concerned, the residential sector is the dominant sector amongst all others, consuming 40% of the total utility's supply. Of particular interest are high rise residential towers, which are expected to dominate the city's urban landscape in the near future. These account for a large energy demand, given the high density of tenements housed in a comparatively small building footprint. It is possible to supplement the energy consumption of these high rise residential buildings using renewable energy. With a low foot-fall, free space and good exposure to the sunlight, rooftops of these high rise residential buildings have potential for installing renewable energy systems like Solar Photo-Voltaics (SPV). This study aims to determine the rooftop SPV potential for a typical high rise residential building - 12 to 15 storeys with apartments for middle income group residents. Two complexes in Pune with 5 to 6 such buildings were studied for their electricity consumption and the potential of their rooftops to generate electricity from SPV systems towards meeting this consumption. Percentage of total energy demand of the apartment which can be supplemented with renewable energy was estimated. Payback calculations were done to assess the viability of capital investment in the RTPV systems. It was found that rooftops can meet 100% of the common electricity demand and generate revenue with a low payback period of 4 years.
India's development goals need to be pro-environment in order to be sustainable. Energy from various renewable sources can fuel development without compromising on environment issues. The National Action Plan on Climate Change (NAPCC) was unveiled by the Prime Minister of India on 30th June, 2008 and the Jawaharlal Nehru National Solar Mission (JNNSM), launched under it promotes Solar energy use. It aims to install 20 GWp of grid-connected and 2 GWp of off-grid SPV systems. The Ministry of New and Renewable Energy (MNRE) in conjunction with the Indian Renewable Energy Development Agency Ltd (IREDA) is promoting solar power utilization, and increasing the market share of solar energy through research and developme nt, demonstration projects, government subsidy programs, and private sector projects. Of the 100 GW of solar capacity aimed to be installed by 2020, 40 GW is through decentralized and rooftop-scale solar projects.
Central Finance Assistance via Maharashtra Energy Development Agency (MEDA) offers the residential sector a subsidy of - 30% of the project cost or 30% of the benchmark cost whichever is lower. The benchmark cost is 61,000/kW solar PV installation capacity, i.e. one can receive at most 18,300 per kW as subsidy on their solar power plant.
Roof Top Photo-Voltaic (RTPV) technology has matured since the 1990s when it was first introduced, and has progressed in terms of efficiency and growth of deployment. However, high production costs, material availability, consumer awareness, and acceptance are challenges still to be overcome (Sundaray et al., 2014).
The potential of RTPV deployment is large, taking into consideration the status of Pune as a Solar City under MNRE's Solar Cities Program. Pune is one of the 100 cities chosen for Smart City development. According to the Smart city guidelines, at least 10% of electricity generated shall be from renewable sources. Pune has planned to supersede this target for the Local Area Development of its suburbs by aiming at 15- 20% of electricity generated by Roof Top Solar alone (ICLEI, 2017).
Census data predicts a two-fold increase in the Urban residential sector from 2014 to 2032 for the country. Pune city is no exception, with its residential real estate sector set to grow exponentially in the coming years, with ever increasing energy demands. Figure 1 shows the electricity consumption in the city, over the years.
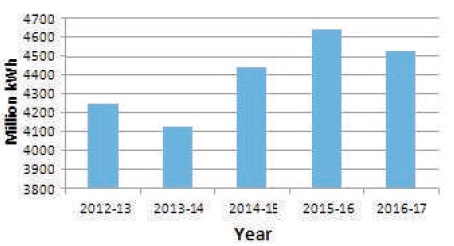
Figure 1. Electricity Consumption over the Years (Source: MSEDCL Data)
The consumer base of the Maharashtra State Electricity Distribution Company Ltd (MSEDCL) is categorized into Residential, Commercial, Industrial, Agricultural, and Municipal sectors, of which the residential sector consumes the most electricity, followed by the commercial. Figure 2 shows the sector wise electricity consumption in Pune city.
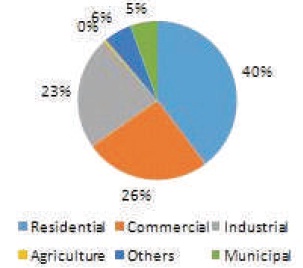
Figure 2. Sector-wise Electricity Consumption (Source: MSEDCL Data)
Shortage in availability and high cost of land in urban areas, is leading to the predominance of high rise residential buildings over other residential typologies ( EMPORIS, n.d).
Pune has a Metro Rail and Bus Rapid Transit System (BRTS) project in progress, and the Pune Municipal Corporation (PMC) has planned for Transit Oriented Development (TOD) along these commutation corridors. In this light, Pune cityscape is soon to be dominated by High-rise buildings.
It would be worthwhile to note the definition of High-rise Buildings. These according to the Development Control and Promotion Regulations for PMC (DCPR-2017) are buildings equal to and more than 70 metres in height. (Regulation no. 17.11). Regulation numbers 2.77.13 and 15.2.8 describe multi-storeyed buildings more than 24 metres heigh from the ground, built on plots abutting roads 12 metres or more, and with a minimum marginal open space of 6 metres as 'Special Buildings'.
In this study, the term 'High rise' is generic and has been used to connote a residential structure with high tenement density.
The Energy and Resources Institute (TERI) has carried out studies of the technical, economic, and market conditions in six Indian cities, including Pune, to understand the potential of RTPV deployment and the barriers against its commoditisation. Technical potential was assessed based on calculations of built up area of buildings (Sundaray et al., 2014). A more detailed Geographic Information System (GIS) based study for the city of Chandigarh yielded an estimation of India's current market potential in its in urban settlements. It was about 124 GWp more than the currently installed 280 GWp. These studies establish the important role of RTPV in providing energy security and optimizing land resource (Datta, 2014). Figure 3 shows India's potential for RTPV.
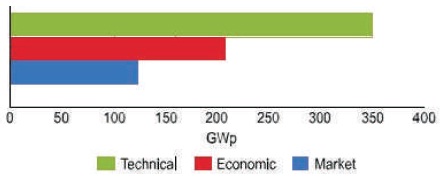
Figure 3. India's Potential for RTPV (Source: TERI, 2014)
Stakeholder surveys throw a light on the factors that affect commoditisation. Consumers perception is that RTPV systems mean savings in electricity bills, economic value for unused rooftop, and green and reliable electricity. They expect government subsidy, time-bound and efficient government procedures to obtain subsidy, friendlier loans, and annual maintenance contract from the vendor (Sundaray et al., 2014).
The main barriers to RTPV are a lack of awareness among consumers, high capital investment, paucity of a wider network of suppliers and service providers, and lack of financing schemes. A notable barrier is the lack of availability of standardized RTPV systems. Currently, an installation is seen as a project, not a product, with end use energy estimation for systemsizing, roof top measurements and analysis. This is seen as too complicated by the consumer and there seems to be a hesitation in investing in the system (Sundaray et al., 2014). Inaccurate potential assessment is also an important barrier that needs to be addressed.
Different techniques have been used to date, on an international scale to accurately assess solar potential. There are two main techniques based on how buildings are represented; One is the use of vector data like in a CAD environment and two, representation based on Digital Elevation Models (DEM). The former offers smooth surfaces, but is difficult to create for a large number of buildings and the inclusion of surrounding topography is a big task. On the other hand, DEM affords easy use of topographical data, but the representation is pixelated. Both methods have been used to calculate Solar potentials at different scales (Mavromatidis et al., 2015).
2.4 Feasibility Studies of RTPV
Various studies across the globe have explored the physical and other barriers to RTPV installation in existing high-rise buildings - legal, technical, and economic. Common Property (CP) demand (areas like lifts, lobbies, water pumps, site illumination, etc.) have a proportionately high electricity demand and may be easier to meet than individual apartments' demand (Roberts, 2016). The economic viability of the same has also been evaluated using the prevalent retail tariff structure. It was found that many of these PV systems have a payback period less than 8 years. Also, a major factor affecting electricity consumption and costs is energy efficiency in an apartment and demand side measures (Roberts, 2016).
A more ambitious aim of using renewable energy is to realise its potential in rendering a building net zero. Many studies have been done towards determining the zero potential of high-rise residential buildings based on simulated building energy demands. However, studying actual energy demand in apartments and common areas of the building can provide a more realistic picture of energy flows. Low energy feasibility studies carry a higher validity with such a method of evaluation (Cho & Kim, 2015).
Several configurations of Grid and RTPV interconnections exist based on a basic energy flow system as illustrated in Figure 4. Grid-tied systems are more suited to urban areas because of the availability of grid connections and the grid acts as storage for the intermittent RTPV supply of electricity (Sundaray et al., 2014).
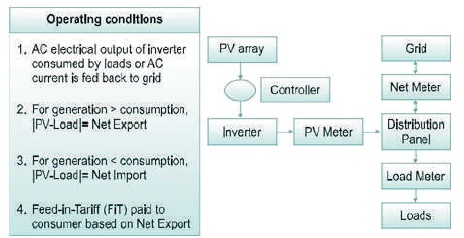
Figure 4. Energy Flow in a Grid-tied RTPV System (Source: TERI, 2014)
Prayas Energy Group's policy discussion paper writes on RTPV and Grid interconnection -"Rooftop PV (RTPV) systems are systems installed on rooftops of residential, commercial, or industrial premises. The electricity generated from such systems can either be entirely fed into the grid at regulated feed-in-tariffs, or used for self consumption with the net-metering approach. A netmetering mechanism allows for a two-way flow of electricity wherein the consumer is billed only for the 'net' electricity (total consumption - own PV production) supplied by the DISCOM (Distribution Company). With netmetering, consumers can install RTPV and first use the solar generation for their own consumption, and feed in only excess RTPV generation into the utility grid. They will continue to draw their power requirement from the grid as and when needed. At the end of the billing period, excess RTPV power fed into the grid will be deducted from the power supplied by the DISCOM during the billing period, and the remaining 'net' consumption will be charged at normal tariff slabs" Gambhir et al. (2012). Revenue flow in such a system is shown in Figure 5.
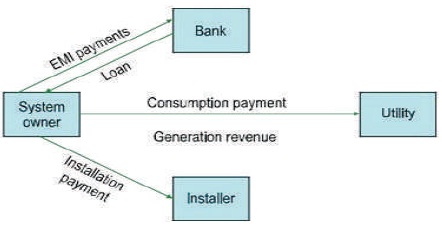
Figure 5. Revenue Flow in Net-metering and Self-owned Model (Source: TERI, 2014)
In a net-metered connection, the electricity meter will run backwards to provide a credit against the electricity that is consumed at night or other periods where the consumer's electricity use exceeds the system's output.
PV technology has matured over the years and its potential in generating 'clean energy' is proven by the number of installations world-wide and the active promotion of the same by the Government of India. MNRE is providing a subsidy of 30% on capital cost of RTPV systems and Net-metering is already in practice in Pune.
However, there are barriers that stand in the way of its widespread use (Sundaray et al., 2014). One of them is a lack of awareness and knowledge of the consumer regarding the financial implications of adopting the technology. There is a need to present a clear picture to the consumer of grid electricity, as to how switching to solar energy for meeting his electricity demands actually works in his favour.
This study for the city of Pune is an effort at accurately evaluating the potential of rooftops of high-rise complexes, for generating clean energy and becoming self-sufficient in meeting electricity demands.
Two residential complexes in suburban Pune for middle income group residents, each with 5 to 6 towers of 12 to 15 storeys and amenities like clubhouse, parking areas, internal roads, and recreational garden, were selected for the study. Terrace Plans in Figures 6 and 7 show the rooftops to be studied.
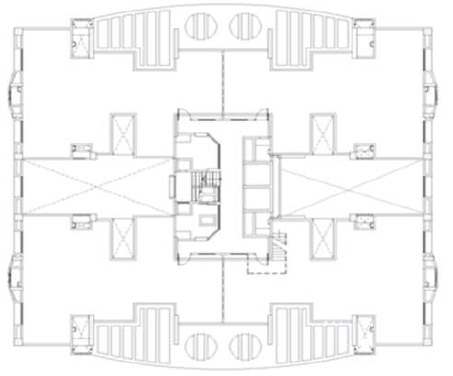
Figure 6. Terrace Plan of a Building (Case 1)
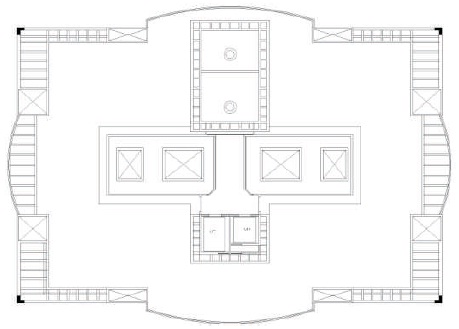
Figure 7. Terrace Plan of a Building (Case 2)
Rooftop drawings of the buildings were studied and the area estimations were done. Physical validation was done to understand the factors like availability of free space, of possible location of the RTPV system, material of the roof top surface, and shadows cast by the projections on the terraces that would affect SPV output. A detailed shadow analysis in Design Builder 5.5.2.007, a whole building energy simulation software, was done to identify shadowfree areas of the terrace throughout the year.
The electricity consumption and billing details of the apartments and the Common Property areas were studied from data provided by the MSEDCL to understand the PV output required to meet these demands.
The potential of the rooftops using estimated PVinstallable area was calculated for each building, by simulation in PVsyst V6.78. A thorough system design using detailed hourly simulations was done, with assumed design and technical parameters, so that maximum possible accuracy of PV output could be achieved. Finally, payback period was calculated for the two case studies.
For simulation in PVsyst V6.78, the following parameters and main components were used.
A sample simulation report is shown in Figure 8.
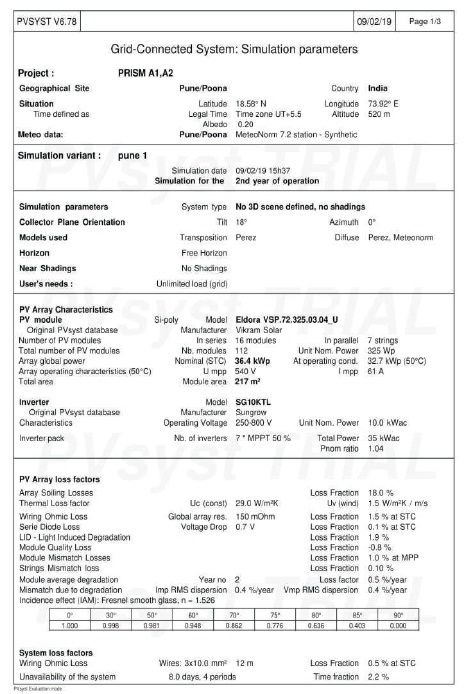
Figure 8. Grid-Connected System: Simulation Parameters
Shading is a relevant factor that influences the energy production of solar panels installed on the roof of a building. As is seen in Figures 9 and 10 from Google Earth below, the rooftops in both cases are free of shading from adjacent buildings and there is no mutual shading that reaches the rooftops.
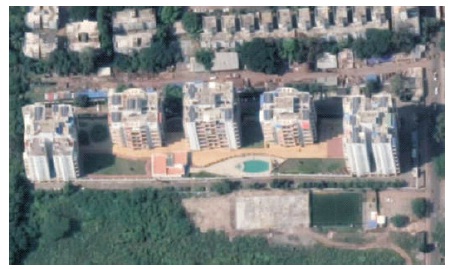
Figure 9. Case 1
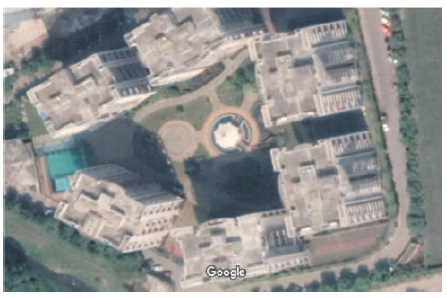
Figure 10. Case 2
Simulations in Design Builder for the months of April, August, and December established that as the day proceeds, shadows cover different parts of the rooftop, to an extent that greatly reduces its potential for installing the SPV modules. This can be seen in Figures 11 - 19. Simulations in PVsyst have shown that the production of solar energy by the PV modules in Pune, approximates 1450 kWh/ kWp/year, only if they are kept completely free of shading. It is therefore deduced that if the entire PV system is mounted at a height that keeps it free of the shadows cast by projections on the terrace, maximum output from the PV modules can be got.
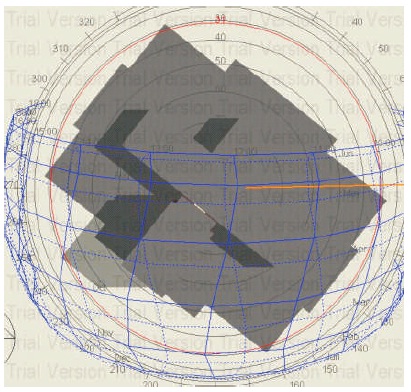
Figure 11. Apr 8 am
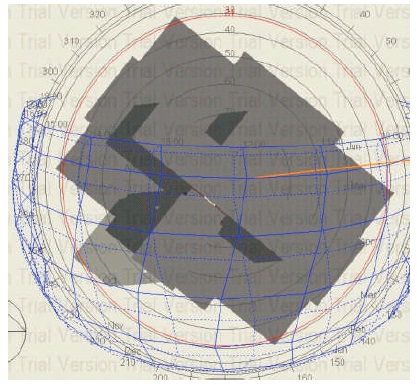
Figure 12. Apr 8 am
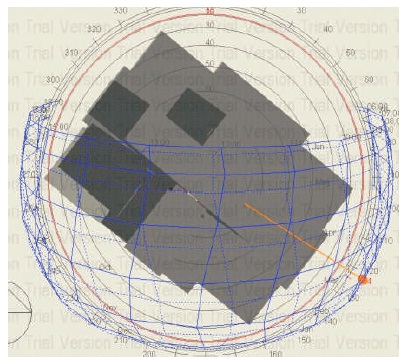
Figure 13. Dec 8 am
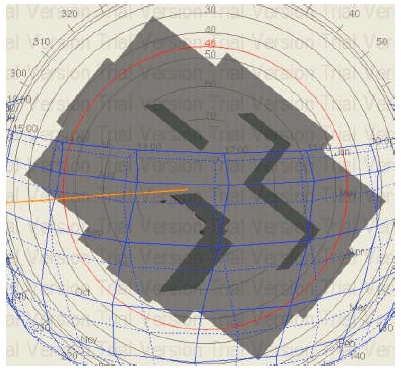
Figure 14. Apr 3 pm
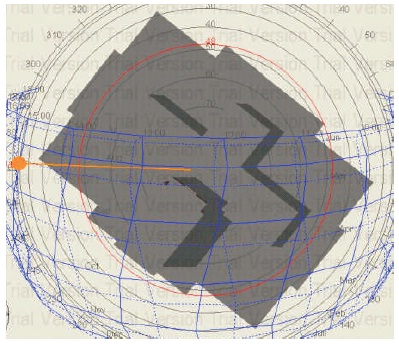
Figure 15. Apr 3 pm
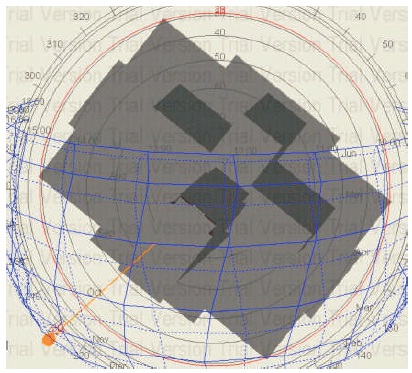
Figure 16. Dec 3 pm
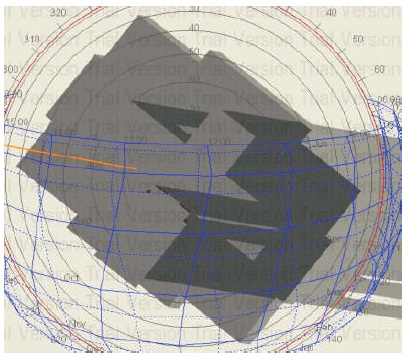
Figure 17. Apr 6 pm
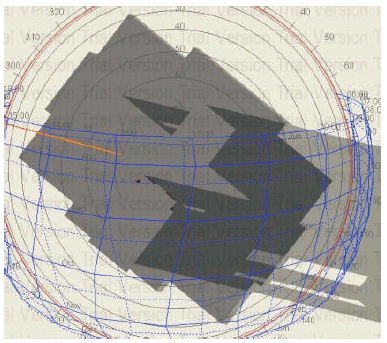
Figure 18. Apr 6 pm
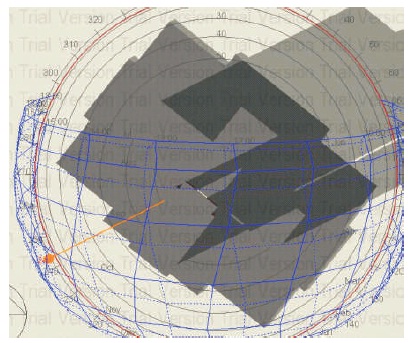
Figure 19. Dec 6 pm
The total number of consumers across its 5 towers are 227 Apartment owners and the Common Property. Table 1 shows the average monthly electricity consumption and billing for them.
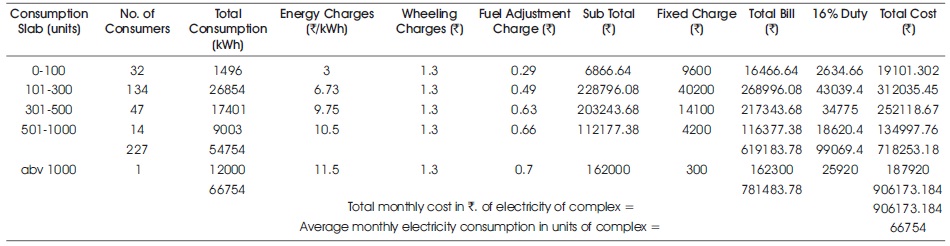
Table 1. Average Monthly Electricity Consumption and Billing
Deductions from the total rooftop were done for
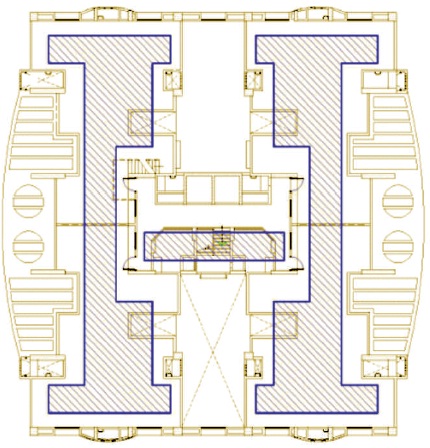
Figure 20. Net SPV rooftop area
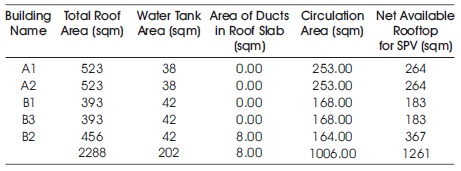
Table 2. Area Estimation
The net rooftop area was further reduced by 15% to accommodate loss of area because of structural constraints. The resultant area for panels was then simulated in PVsyst with the necessary parameters to calculate the final number of panels that could be accommodated and the annual output of energy.
The RTPV output result of the simulation in PVsyst is as shown in Table 3.
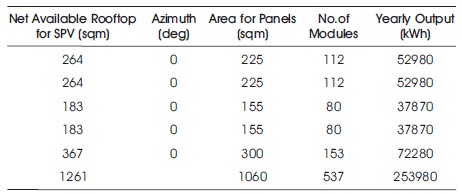
Table 3. Annual RTPV Output
Average monthly Generation from 537 modules of 325 Wp = 2,53,980 units
Daily generation from 537 modules of 325 Wp = 174.5 Units
This is the output of a system size of 175 Kwp
Average monthly Generation from RTPV = 21,165 units
Average monthly consumption of CP = 12,000 units
Balance electricity RTPV = 21,165 - 12,000 = 9,165 units
Therefore, 100 % electricity requirement of CP can be met with RTPV generated electricity, indicating zero purchase from the grid. The balance electricity can either be used by all the 227 Apartments for self-consumption or fed into the grid.
No. of units that can be supplied / apartment = 40 units
If fed into the grid, monthly billing would show zero energy charges, but all other charges like wheeling charges, fuel adjustment charges, fixed connection charge and government duty would be applicable. However, on the receipt of the excess electricity from the society's RTPV system (accepted at a 4.5/ kWh rate), the utility adjusts this billing accordingly.
Total system size = 175 kWp
Cost of SPV system at 60/W = 1,05,00,000
Cost of supporting structure at 6/W = 10,50,000
Total capital cost of RTPV system = 1,15,50,000
Subsidy available (at 18,300/kW) = 32,02,500
Annual Operation & Maintenance costs = 4,000/yr
Net cost of project = 83,51,500
Referring to Table 1:
Monthly savings from CP bill = Sub-total amount +16% duty on it = 162000 + 25920 = 1,87,920
Yearly Savings from RTPV system in CP bill = 22,55,040 (1)
Annual Revenue from feed-in of excess units to grid = 9,165 x 4.5 x12 months = 4,94,910 (2)
(Assumed Feed-in tariff is ` 4.5/unit)
Total income from RTPV system (1)+(2) = 27,49,950 Payback period = 3.03 years
CO2 emissions mitigated by a 175 kWp RTPV system is 215 tonnes/year. As the life of an RTPV system is 25 years,
CO2 emissions mitigated - 5381 tonnes, which is equivalent to planting 8610 Teak trees over 25 years. (source : solarrooftop.gov.in )
The total number of consumers across its 6 towers are 257 Apartment owners and the Common Property. Table 4 shows the average monthly electricity consumption and billing for them.
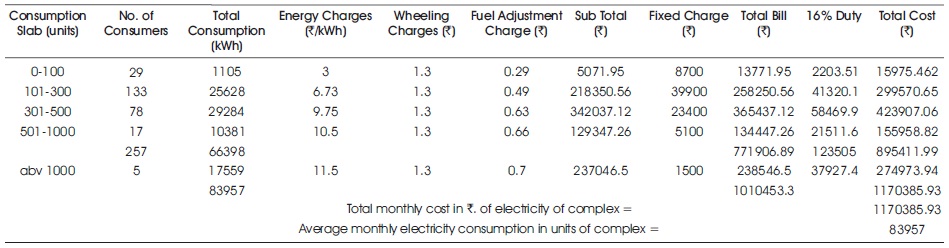
Table 4. Average Monthly Electricity Consumption and Billing
Energy charges or tariffs are proportional to consumption of units. Other charges include wheeling charges, fuel adjustment charges, fixed charge for connection, and finally a 16% duty payable to the government. The total cost of electricity has been calculated for all the consumers in the various consumption brackets.
The consumers in the consumption brackets 0 to 1000 are the 257 Apartment owners with a total Average monthly consumption = 66,398 units
CP is the consumer in the consumption bracket of above 1000 units with an Average monthly consumption = 17,559 units
These consumptions indicate the total electricity requirement of the complex which needs to be fulfilled by RTPV systems installed on all the towers.
The area calculations were done as in Case study 1, with Figure 21 showing the net SPV rooftop area got.

Figure 21. Net SPV Rooftop Area
The RTPV output result of the simulations in PVsyst is shown in Table 5.
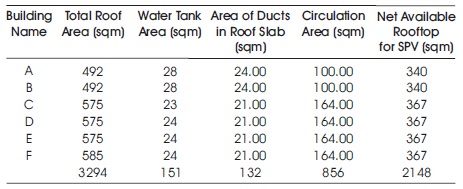
Table 5. Area Estimation
Average Annual Generation from RTPV = 4,23,390 units
Daily generation from 873 modules of 325 Wp = 283.725 Units
This is the output of a system size of 284 Kwp
Average monthly Generation from RTPV = 35,282 units
Average monthly consumption of CP = 17,559 units
Balance electricity RTPV = 35,282 - 17,559 = 17,723 units
Therefore, 100% electricity requirement of CP can be met with RTPV generated electricity, indicating zero purchase from the grid. The balance electricity can either be used by all the 257 Apartments for self-consumption or fed into the grid.
No. of units that can be supplied / apartment = 69 units
If fed into the grid, monthly billing would show zero energy charges, but all other charges like wheeling charges, fuel adjustment charges, fixed connection charge, and government duty would be applicable. However, on the receipt of the excess electricity from the society's RTPV system (accepted at a 4.5/ kWh rate), the utility adjusts this billing accordingly.
Total system size = 284 kWp
Cost of SPV system at 60/W = 1,70,40,000
Cost of supporting structure at 6/W = 17,04,000
Total capital cost of RTPV system = 1,87,44,000
Subsidy available (at 18,300/kW) = 51,97,200
Annual Operation & Maintenance costs = 6,000
Net cost of project = 1,35,52,800
Referring to Table 6:
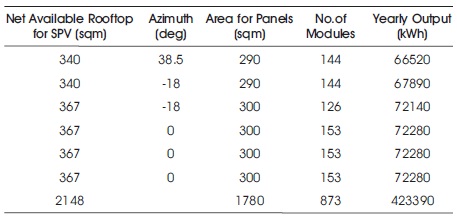
Table 6. Annual RTPV Output
Monthly savings from CP bill = Sub-total amount +16% duty on it = 2,37,046 + 37,927 = 2,74,973,/p>
Yearly Savings from RTPV system in CP bill = 32,99,680 (3)
Annual Revenue from feed-in of excess units to grid = 17,723 x 4.5 x12 months = 9,57,042 (4)
(Assumed Feed-in tariff is 4.5/unit)
Total income from RTPV system (3)+(4) = 42,56,722
Payback period = 3.18 years
CO2 emissions mitigated by a 284 kWp RTPV system is 349.3 tonnes/year. As the life of an RTPV system is 25 years, CO2 emissions mitigated are 8733 tonnes, which is equivalent to planting 13973 Teak trees over 25 years. (source : solarrooftop.gov.in )
The study suggests that rooftops of high-rise apartment buildings have the potential for deployment of PV systems that can meet 100% of the common property electricity demand. The excess PV generated electricity is returned to the grid and the owed amount adjusted in the payment of the other charges appearing in the CP bill.
It can be concluded from the two case studies that the designed RTPV systems are certainly viable for reasons of CP bill savings and payback periods about 3 years.
The Apartment owners would, if they had to consume their share of the solar generated electricity, either have to be net-metered by the grid or connect individually to the building's RTPV system, to meet a part of their total electricity demand. Both these options are technically cumbersome and economically disadvantageous because there is no cash paid for units returned to the grid.
The most suitable option would be to install a RTPV system of sizing that can meet only the CP energy demand, with an excess that can cover the fixed monthly charges in the CP electricity bill.
As of now, for residential societies, the Net-metering model is in practice, but it would be useful to explore options of other deployment models and regulatory arrangements towards more savings/revenue. A more detailed economic analysis involving loans can further clarify financial aspects of investing in Net-metered RTPV systems. Potential estimation for RTPV installations on the other buildings in the selected complexes has been excluded from this study for paucity of time. This could be taken up for further study.
The authors wish to acknowledge Dr. Santosh Patni, Deputy Executive Engineer, MSEDCL and Er. Saumyajit Paul, Director, Celestial Renewexperts LLP, Pune for their invaluable contribution to this study.