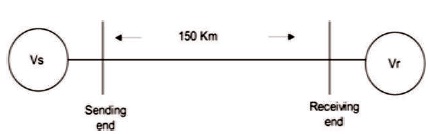
Figure 1. Model of Transmission Line
Electrical energy is transmitted through the electrical network from power generating stations to the consumers. For this purpose, the overhead transmission line is used through which bulk power can be transferred. The conventional electrical network transmits the energy with power loss. The reason for the power loss is due to corona discharge, which affects the performance of the transmission line. Due to the above reason this paper analyzed the corona loss with modeling of AC transmission line by using MATLAB software and also tested different factors which affect the corona in different weather (fair and stormy) conditions by using Peek's formula.
The corona discharge is an exceptional case in power system which can be noticed in cables of power stations. Generally, corona is formed on both High Voltage line and Extra High Voltage lines. When the voltage of the HV line has exceeded threshold value (30kV/cm) is also called critical value, then air surrounding the conductor is ionized, it means that in overhead transmission line, when the electrical gradient is set up between two parallel conductors, electrons and ions start the motion by the electric field resulting a small current produced between the conductors. This phenomenon undergoes a radical change when the electric field intensity reaches critical values of 30kV/cm. At this stage, the moving ions achieve a high velocity and strike the adjacent molecule shift electrons from it. This shift electron and the remaining portion of the molecule (i.e. Positive ion) further collides with another molecule producing more ions. The complete electric breakdown of the dielectric medium between the two conductors is known as the ionization process of the air (Iliceto & Cinieri, 1988). And corona discharge occurs in the form of chemical, ozone (O ) (Djalel & Abdelhakim, 2014; Gupta, 2007; Khan & Khan, 2015). When the corona discharge occurs different colors appears surrounding the conductors. This Phenomenon is called visual corona which is also provided with a hissing sound. Some factors which affects the corona discharge (Djalel & Abdelhakim, 2014; Li, Fan, Yin, & Chen, 2010) are as follows,
Frequency: Applied frequency is nothing but the supply frequency which is directly proportional to the corona loss.
Line Voltage: The corona is affected by the line voltage. When the line voltage increased then air surrounding the conductor is ionized and starts the breakdown of air, which act as a dielectric medium therefore corona is formed. However, if the line voltage is low, there is no change in the condition of air surrounding the conductors and hence no corona discharge (Yin, Farzaneh, & Jiang, 2015)
Size of conductor: The shape and the material of the conductor affects corona loss. Corona loss is inversely proportional to the breakdown voltage. But the application of rough and irregular surfaced conductor,t he (VBd) decreased and also corona loss decreased. Thus power loss reduced (Tonmitr & Ratanabuntha, 2016).
Spacing between conductors: If the spacing between conductors is more as compared to their diameter, then there is no corona formation. If the spacing between conductor is increased then electro-static stress surrounding the conductors is reduced. Thus avoiding the corona discharge and no power loss occurs. (Saadat, 1999; Mukherjee & Gupta, 2017).
Atmospheric condition: Ionization of air is the main cause of formation of the corona. In stormy weather condition, corona formation is more as compared to fair weather condition because in stormy weather condition, more ion present in atmosphere. Thus power loss is more in stormy weather, it is present by Tonmitr, Ratanabuntha, Tonmitr, and Kaneko (2016). The corona has a very important role in the power loss of a transmission line. Corona affects the performance of the transmission line. Ozone (O3) is produced due to corona effect. This corona effect causes corrosion in the conductor by chemical action and radio interference. Due to the corona loss a nonsinusoidal voltage drop occurs in the line. This induces inductive interference with neighboring communication lines and generates hissing sound and violet glow color surrounding the conductors of the transmission line. The corona effect of transmission line is a very special phenomenon. This is the big reason for loss of power. Hence, it is very much necessary for reduction of corona, generally which occur on HV line. The reduction of corona loss depends on some factors such as conductor size, spacing between conductor etc (Yin, Farzaneh, & Jiang, 2017; Chartier, Lee, Dickson, & Martin, 1987; Srinivasulu & Subramanyam, 2010).
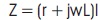
Figure 1 Shows the model of a 400-kV three- phase AC transmission line of 150km long. Where sending end voltage is 454.19kV and receiving end voltage is 400kV. The resistance per phase is 0.15 per km and the inductance per phase is 1.3263 mH per km. The shunt capacitance is negligible (Husain, 1928). The series impedance per phase is mathematically defined as follows:
Figure 1. Model of Transmission Line
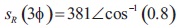
The receiving end voltage per phase calculated as:

The apparent power is,
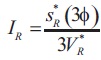
The current per phase is given by
The sending end voltage is,
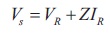
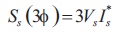
The sending end power is
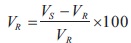
Voltage regulation has been calculated as
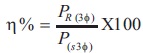
Transmission line efficiency is,
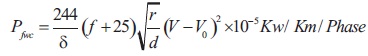
For the above discussed transmission line, this paper analyzed corona loss by using Peek' s formula as discussed on the paper (Tonmitr et al., 2016).
For fair weather condition
For stormy weather condition.
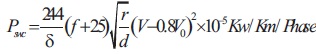

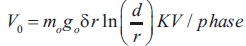
Pfwc represent the power loss due to corona in fair weather condition, Pswc is power loss in stormy weather condition, f is frequency in Hz, r is radius of the conductor in cm., d is spacing between conductors in cm. δ is air density factor, p is atmospheric pressure, t is temperature, V0 is disruptive critical voltage in kV/Phase, m0 is surface factor of the conductor.
The flow chart of the proposed work is shown Figure 2(a) and (b).
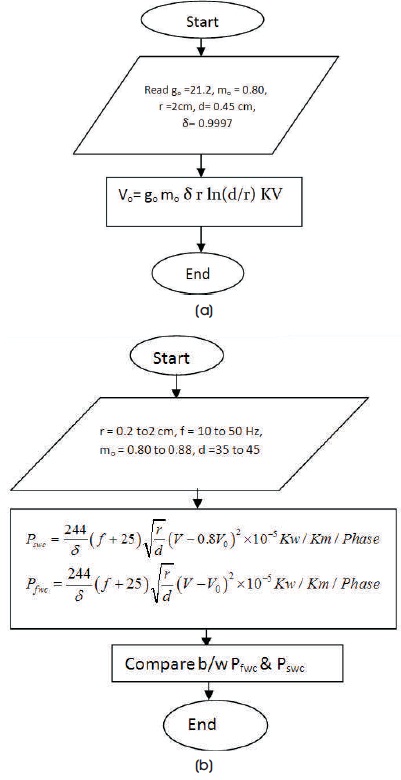
Figure 2(a) & (b). Flow Chart of Proposed System
This paper presents the analysis of corona loss by using Peek' s formula with modeling of transmission line. This analysis has been simulated by using MATLAB software and results has been given in Tables 1-5. By using this tables Figures 3 and 4 are plotted, when representing the spacing between conductor (d) versus Power loss for fair weather condition (Pfwc) and stormy weather condition (Pswc). This analysis shows that if the spacing between the conductor is increased then the Power loss is decreased. Whereas, as the spacing between the conductor decreases, then the Power loss is increased. Because the equations (9) and (10) shows that the spacing between conductor (d) is inversely proportional to the Power loss due to corona. If the spacing between the conductors is made very large as compared to their radii (r), there may not be any corona effect. It is because larger spacing reduces the electrostatic stresses at the conductor surface. Figures 5 and 6 shows frequency (f) versus Power loss for fair weather condition and stormy weather condition. this analysis also provide as frequency of the system is increased then the power loss is also increased. Whereas, as the frequency is decreased, then Power loss is also decreased. Because frequency (f) is directly proportional to the Power loss due to corona. Figures 7 and 8 depict the disruptive critical voltage Vo versus Power loss for stormy and fair weather condition. In this analysis, it is found that mo is the irregularity factor of stranded conductor which depends on Vo as given in equation (12). When mo is increased then Vo is also increased, therefore Vo depends on the Pfwc and Pswc. When the Vo is increased then the Power loss is decreased, this relation is given in equations (9) and (10). Vo is inversely proportional to the Power loss due to corona. Therefore by increasing conductor size, the voltage at which corona occurs is raised and hence corona effects are considerably reduced. It is due to this reason that ACSR conductors which have, a larger cross- sectional area are used in transmission lines.
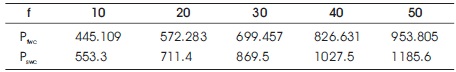
Table 1. Simulation results for frequency
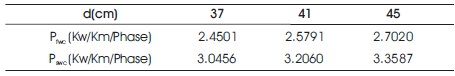
Table 2. Simulation results for Spacing between two conductors
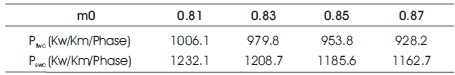
Table 3. Simulation results for Irregularity factor of conductor
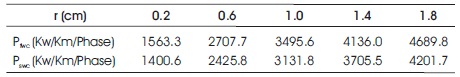
Table 4. Simulation results of radius directly Proportional to Power loss
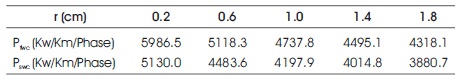
Table 5. Simulation results depends on V0
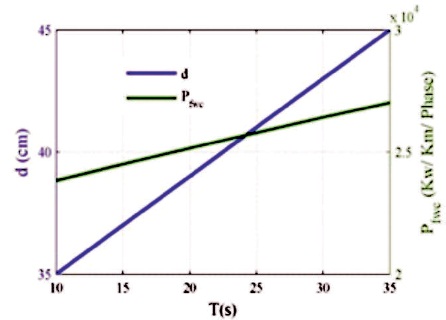
Figure 3. Spacing Between Conductors versus Power Loss in Fair Weather Condition (for increasing spacing between conductors)
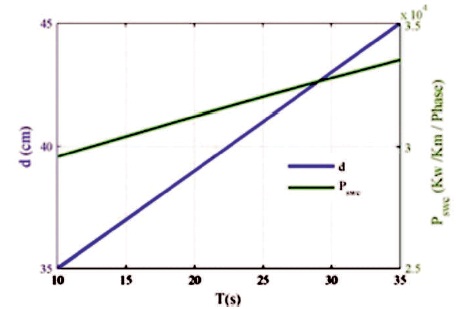
Figure 4. Spacing Between Conductors versus Power Loss in Stormy Weather Condition (for increasing spacing between conductors)
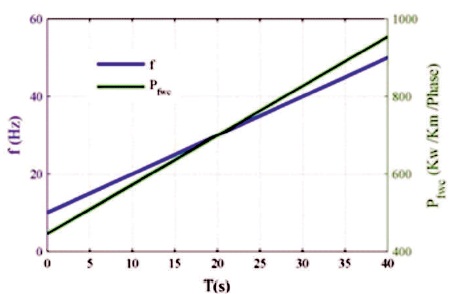
Figure 5. Frequency versus Power Loss in Fair Weather Condition (for increasing frequency)
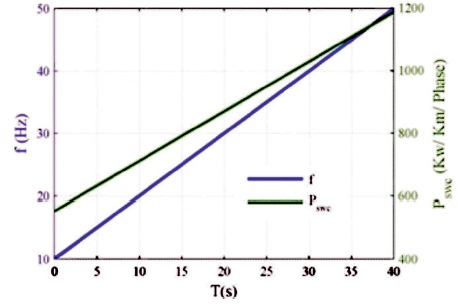
Figure 6. Frequency versus Power Loss in Stormy Weather Condition (for increasing frequency)
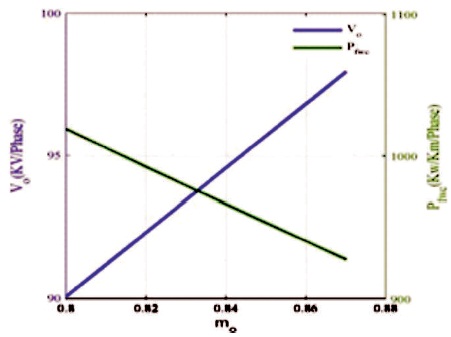
Figure 7. Irregularity Factor of the Conductor versus Power Loss in Fair Weather Condition (for increasing irregularity factor of conductors)
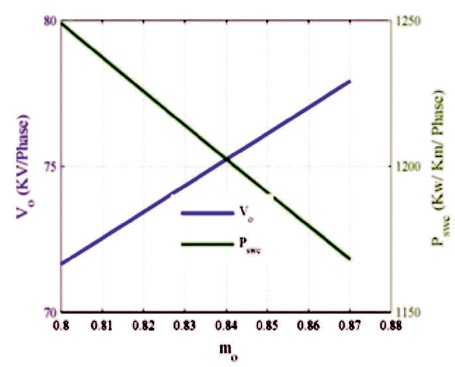
Figure 8. Irregularity Factor of the Conductor versus Power Loss in Stormy Weather Condition (for Increasing Irregularity Factor of Conductors)
Figures 9 and 10 shows radius versus Power loss for fair and stormy weather condition. In this analysis, it is found that from the equations (9) and (10), when the radius of the conductor is increased then Power loss is also increased. And the Figures 11 and 12 shows Vo versus power loss, whereas from the equation (12), the radius of the conductor is inversely proportional to disruptive critical voltage (Vo). Therefore, this paper analyzed that when the radius of the conductor is increased then negative value of Vo is varied from negative to positive value that means negative value of Vo is increased then power loss is decreased because Power loss depends on the positive and negative value of the Vo. Corona is affected by the atmospheric condition therefore, the power loss in different weather (stormy and fair) conditions are analyzed, since corona is caused due to the ionization of air surrounding the conductors and it is affected by the physical state of the atmosphere. In the stormy weather, the number of ions is more than normal and corona occurs at much less voltage as compared with fair weather. So, the comparison between power loss in fair weather condition and stormy weather condition is presented for different factors, which affect the corona such as spacing, radius, surface factor, frequency etc. Figures 13-15, shows the power loss in fair weather condition versus power loss in stormy weather condition (Pfwc Versus Pswc). In this analysis, it is found that the power loss due to corona in stormy weather condition is greater than the fair weather condition, but in case of Figures 16 and 17 Power loss in fair weather condition is more than the stormy weather condition.
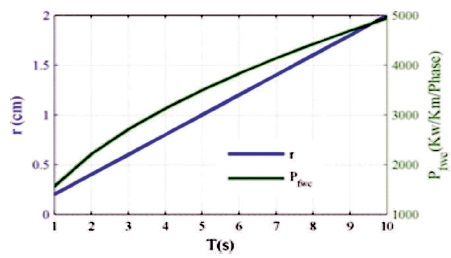
Figure 9. Radius versus Power Loss in Fair Weather Condition (for increasing radius of conductors
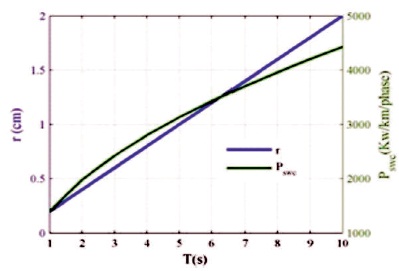
Figure 10. Radius versus Power Loss in Stormy Weather Condition (for increasing radius of the conductors)
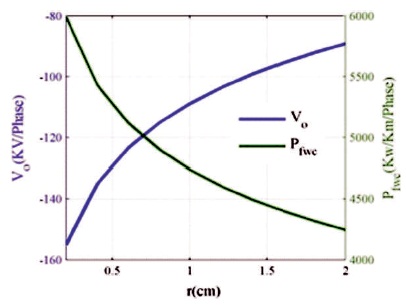
Figure 11. Disruptive Critical Voltage versus Power Loss in Fair Weather Condition where Radius is Depends on Vo (for Increasing Radius of the Conductors)
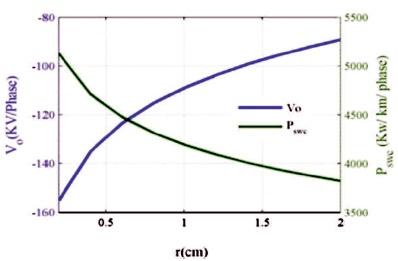
Figure 12. Disruptive Critical Voltage versus Power Loss in Stormy Weather Condition where Radius is Depends on Vo (for Increasing Radius of the Conductors)
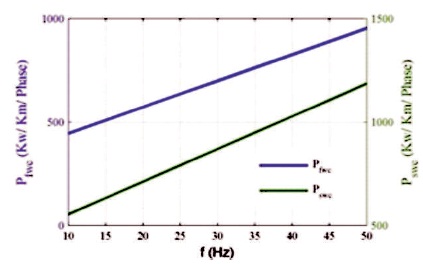
Figure 13. Power Loss in Fair Weather Condition (Pfwc) versus Power Loss in Stormy Weather Condition (Pswc) for Increasing Frequency (f)
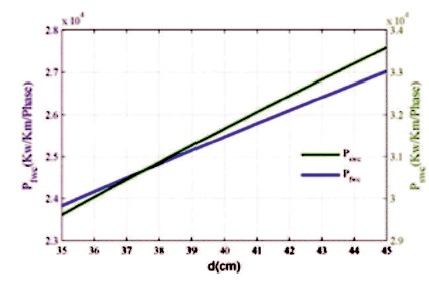
Figure 14. Power Loss in Fair Weather Condition (Pfwc) versus Power Loss in Stormy Weather Condition (Pswc) for Increasing Spacing Between the Conductors
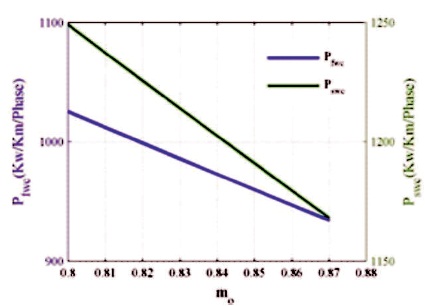
Figure 15. Power Loss in Fair Weather Condition (Pfwc) versus Power Loss in Stormy Weather Condition (Pswc) for increasing Irregularity Factor of the Conductors
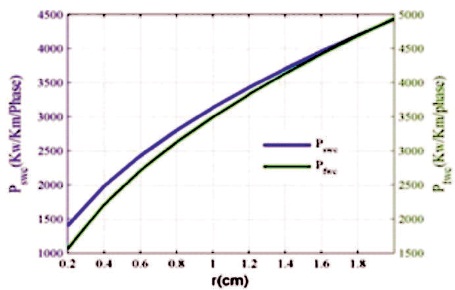
Figure 16. Power Loss in Fair Weather Condition (Pfwc) versus Power Loss in Stormy Weather Condition (Pswc) for Increasing Radius of Conductors
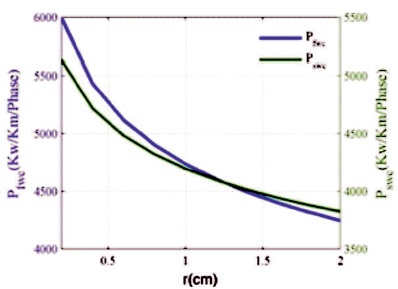
Figure 17. Power Loss in Fair Weather Condition (Pfwc) versus Power Loss in Stormy Weather Condition (Pswc) for Increasing Radius of the Conductors which Depends on the Vo
The analysis of corona loss is an important aspect of the transmission line. Because, it affects the performance of the transmission line this paper estimates the corona loss through the modeling of a transmission line system. It also analyze the different parameters which affects the corona loss in fair and stormy weather condition using peek's formula. The development of a three-phase AC transmission line model in the presence of corona loss is very important which is very helpful for investigating the corona effect.