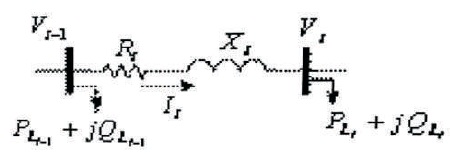
Figure 1. Single Line Diagram of Two Buses of a Distribution System
As increase in the high demand utilization of electrical energy over few decades the power loss issue is persevered. In order to minimize the power losses, various methods are followed in distribution system such as capacitor placement, distribution generator placement and proper conductor selection methods. In all these methods, lot of money is to be invested to decrease the losses. The network reconfiguration method is one, where investment for loss reduction is minimum. By changing the position of sectionalizing and the tie switches the distribution system reconfiguration is done to minimize the power losses. In this paper, Genetic Algorithm (GA) and Binary Particle Swarm Optimization (BPSO) techniques are used for distribution system reconfiguration. The performance of the two algorithms is tested with two different test systems i.e. 33 and 69 node radial distribution systems. The outcomes illustrate that after reconfiguration the power loss is minimized and voltage profile is improved. Finally the results of the two algorithms are compared and found that BPSO has given better results compared to Genetic Algorithm.
The chief objective of electrical distribution system is to provide power continuously to the consumers within acceptable parameter limits. Distribution network are passive termination of the transmission grid with high resistance and reactance resulting in high distribution losses, contributing to large voltage drops, low voltage stability, increased power losses and decreased reliability to sustain disturbance. Thus, key focus of this paper is to reduce distribution loss while fulfilling operating constraints. In this paper, two soft computing techniques are used for distribution system reconfiguration. The distribution network reconfiguration can be performed by changing the status of switches. The switch status in distribution system can be represented by a binary variable 1 or 0 which will make Genetic Algorithm (GA) suitable for the network reconfiguration.
Numerous researches were done with the aim of power losses reduction in distribution network while maintaining its reliability and quality of the network. Distribution network consists of interconnected radial networks. By changing the switching operations to transfer loads in the feeders, the configuration may be varied. There are two types of switches, normally closed or sectionalizing switches and normally open or tie switches are used in primary distribution network. The protection and reconfiguration can be done by using these two switches. Reconfiguration of the network is the process of altering the structure of distribution network by changing the status of switches. Many switching combinations are there to reconfigure the network. Network reconfiguration is a complicated, combinational, non-differentiable constrained optimization problem.
There are few techniques that are applied to solve the network reconfiguration, which are switch exchanging, mathematical optimization, artificial intelligence and optimal flow pattern techniques. Initially, a traditional network reconfiguration has been implemented for power losses reduction, load balance and voltage stabilization in normal operating conditions. The discrete nature of the switches and more number of switching combinations in the network will make the problem a dreadful mixed nonlinear optimization problem. Generally the transfer of loads from heavily loaded feeders to relatively less heavily loaded feeders are allowed in the power distribution network reconfiguration. Altering the level of loads, improving the voltage profile in the feeders and total system power loss reduction are effective by such transfers.
The reconfiguration of the network problem in a distribution network has to determine the best configuration and it has to provide minimum power loss while the operating constraints have been to be satisfied. The main aim is to minimize the real power loss of the distribution system.
The electric power distribution networks involves groups of interconnected radial lines and constraints like configuration, all loads has to be served, protective devices coordination, and voltage etc. Every feeder in the distribution network consist commercial and industrial type of loads with daily load variations. Due to uncertainty of loads on feeders, the operation and control of distribution network will be very complex particularly in areas where the load density is high. Power loss in distribution system is not minimum for a fixed network configuration and for all cases of varying loads.
A GA based optimal network re-configuration is suggested in (Hu, Hua, Wang, Gong, & Li, 2010; Ravibabu, Ramya, Sandeep, Karthik, & Harsha, 2010; Vitorino, Neves, & Jorge, 2009; Zhang, Huang, & Zhang, 2005; Nara, Shiose, Kitagawa, & Ishihara, 1992; Shamsudin, Omar, Sulaima, Jaafar, & Kadir, 2014). Ravibabu et al. (2010) have used load balancing. Vitorino et al. (2009) used adaptive crossover and mutation probabilities. Zhang et al. (2005) have used a dynamic retribution factor, a decimal coding and dynamic mutation factor. Nara et al. (1992) have used sectionalizing switches, total system real power losses and voltage drop. Shamsudin et al. (2014) used switch adjustment.
A PSO based optimal network re-configuration is suggested in (Abdelaziz, Mohammed, Mekhamer, & Badr, 2009; Amanulla, Chakrabarti, & Singh, 2012; Kennedy & Eberhart, 1995; Franken & Engelbrecht, 2005; Zhang & Hu, 2005; Sadri & Suen, 2006; Kennedy & Eberhart, 1997; Taşgetiren & Liang, 2003). Abdelaziz et al. (2009) have used modified inertia weights. Amanulla et al. (2012) have used reliability models. Kennedy and Eberhart (1995) used paradigms. Franken and Engelbrecht (2005) used iterated prisoner's dilemma and symmetrical structure. Zhang and Hu (2005) used an optimum input subset for a SVM in time series forecasting. Sadri and Suen (2006) used birth and death operations. Kennedy and Eberhart (1997) also used trajectories. Taşgetiren and Liang (2003) used total ordering and holding costs. A plant growth simulation based optimal network reconfiguration is suggested in Rao and Sivanagaraju (2010). In this work, authors have used branch load balancing index and system load balancing index.
It is assumed that the three-phase radial distribution system is balanced. The one line diagram of two buses of a given distribution system is shown in Figure 1.
Figure 1. Single Line Diagram of Two Buses of a Distribution System
Based on bus or node and branch numbering, voltage of bus i is expressed as:
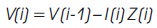
where,
V(i) : Voltage of bus i
V(i-1) : Voltage of bus i-1
I(i) : Current flow in line i
Z(i) : Impedance of line i
Since the line voltage of source node has been known, equation (1) is used in forward sweep to determine voltage of remaining buses in distribution network.
The load current of bus i, I (i) is written as
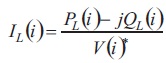
Where PL(i) and QL(i) are respectively real and reactive power of the load connected to bus i.
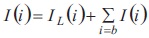
The current through branch i, I(i) is equal to load current of bus i, IL (i) plus the sum of the branch currents which are connected to this line, i.e.:
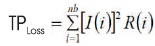
Total real power loss in the distribution network is written as the following equation:
Constraints:
(i) Vimin ≤ Vi ≤ Vimax
Here, Vimin = 0.9 pu and Vimax = 1.1 pu
(ii) Network should be radial structure
Reconfiguration is achieved by manually changing the status of various switches which is very monotonous and time engrossing job. To overcome its disadvantages, artificial intelligence technique can be used for reconfiguration. In this paper, Genetic Algorithm and BPSO are used for the distribution network reconfiguration. The distribution network reconfiguration can be generally performed by changing the status of switches. The status of each switch in distribution system is naturally represented by binary parameter 0 or 1 which will make GA suitable for network reconfiguration. The Figure 2 shows the flowchart for the distribution network reconfiguration using GA.
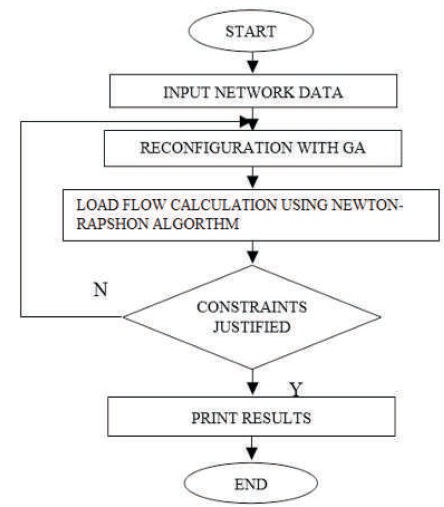
Figure 2. Flowchart for Network Reconfiguration using GA
Kennedy and Eberhart (1997) proposed a discrete binary version of PSO for binary problems. In their model a particle decides on “yes” or “no”, “true” or “false”, “include” or “not to include” etc. Also these binary values can be a presentation of a real value in binary search space. In the BPSO, the particle's personal greatest and overall best will be updated as in true-valued version. The significant difference between BPSO and with true-valued version will be that speeds of the particles will be rather defined in terms of probabilities that a bit can change to 1. Using this definition a speed should be restricted within the limits [0, 1]. So a map can be introduced to map all true valued numbers of speed to the limits [0, 1]. The major difference between PSO and BPSO is position update function. The Figure 3 shows the flow chart for the distribution network reconfiguration using BPSO.
The algorithms are implemented in MATLAB simulation.
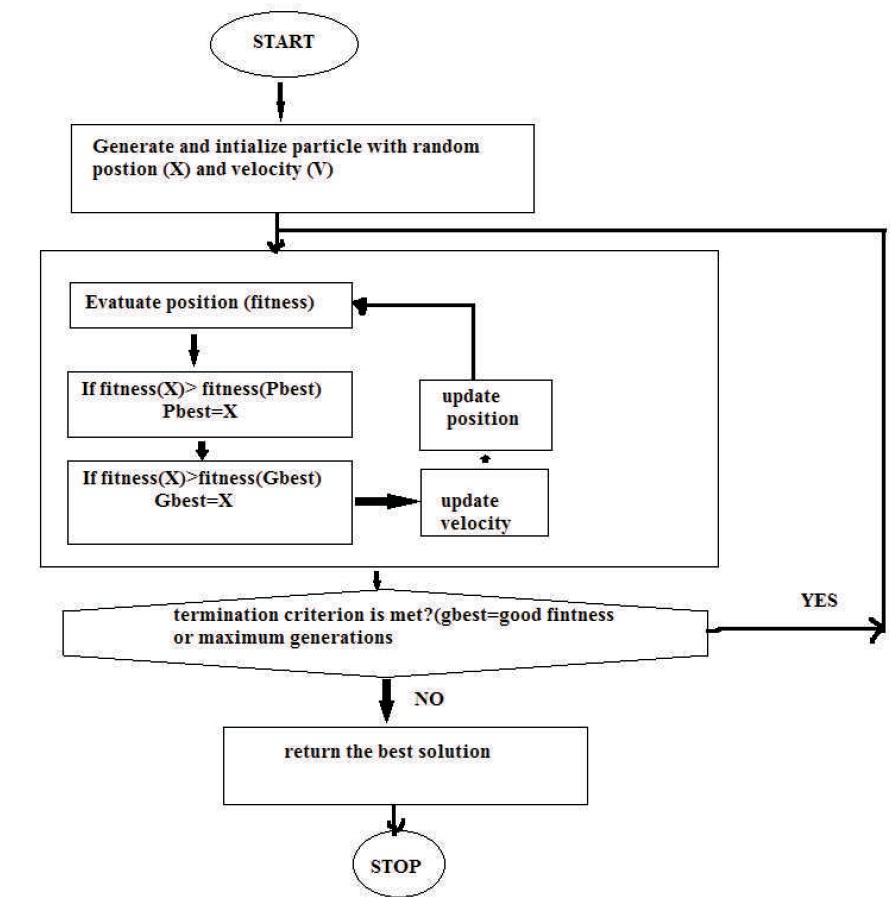
Figure 3. Flowchart for Network Reconfiguration using BPSO
The effectiveness of the algorithms are illustrated with two examples i.e. 33-node distribution system and 69-node distribution system. The simulation is conducted in a 64 bit PC with 2.50 GHz CPU, 4 GB RAM with MATLAB software is used to solve the model. The base capacity is 100 MW and base voltage of 11 kV for IEEE-33 and 69 node radial distribution networks. At bus 1 the voltage is taken as 1.000 pu.
The 33-node radial distribution network can consist of 38 switches where five will be tie switches and 33 will be sectionalizing switches. The single line diagram of 33- node radial distribution system is shown in Figure 4.
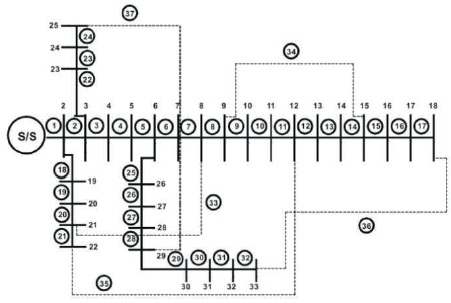
Figure 4. The Single Line Diagram of 33- Node Radial Distribution System
The 33-node radial distribution system data has been taken from Amanulla et al. (2012). The base voltage is 12.66kV. Before reconfiguration, the total real power losses are found to be 208.4592 kW. The parameters used for GA for 33-node distribution system are:
Length of chromosome=13; population size = 20; crossover probability=0.7 and mutation probability= 0.09.
It has been observed that with genetic algorithm the power loss is reduced from 208.4592 kW to 160.9 kW and 208.4592 kW to 138.92 kW using BPSO shown in Tables 1 and 2. The losses are reduced by 33.355% of total losses after reconfiguration using BPSO. It can be also observed that binary PSO has been better efficient than Genetic Algorithm.
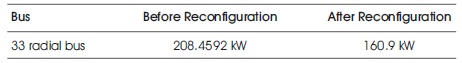
Table 1. Power Losses using GA
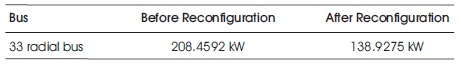
Table 2. Power Losses using BPSO
Figure 5 shows the voltage profile of 33 bus radial distribution system. The minimum voltage is 0.91075 pu before reconfiguration at bus no 18 and 0.9499 pu after reconfiguration at bus no 32. Hence, the minimum voltage is increased after reconfiguration from 0.91075 pu to 0.9499 pu.
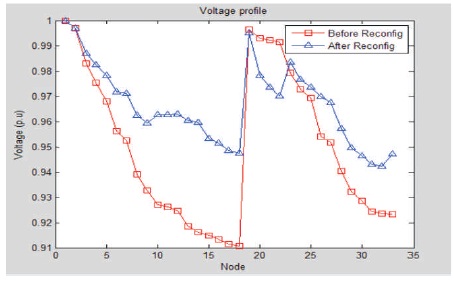
Figure 5. Voltage Profile of 33 Node Radial Distribution Network
The 69-node radial distribution system consists of 74 switches where five will be tie switches and 69 will be sectionalizing switches. The 69-node radial distribution system data has been taken from Rao and Sivanagaraju (2010). The 69-node radial distribution system data has been taken from (Taşgetiren & Liang, 2003) and single line diagram is shown in Figure 6.
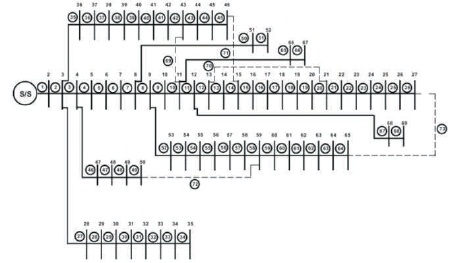
Figure 6. The Single-line Diagram of 69- Node Radial Distribution System
This 69-node radial distribution system has been initially tested by selecting the five tie switches and power loss is calculated and found to be 224.9457 kW From Tables 3 and 4, it has been observed that the power loss is reduced from 224.9804 kW to 108.40 kW using genetic algorithm and 224.9457 kW to 98.5952 using BPSO. From the results, it can be observed that binary PSO has been better efficient than Genetic algorithm.
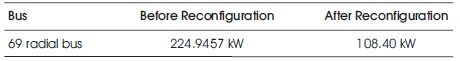
Table 3. Power Losses using GA
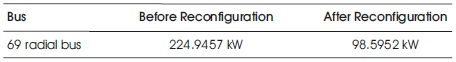
Table 4. Power Losses using BPSO
The parameter values for genetic algorithm for 69-node distribution system are:
Length of chromosome = 15; Population size = 20; crossover probability = 0.8 and mutation probability = 0.004
Figure 7 shows the voltage profile of 69 bus radial distribution system. The minimum voltage is 0.9091 pu before reconfiguration at bus no 65 and 0.9494 pu after reconfiguration at bus no 62. Hence, the minimum voltage is increased after reconfiguration from 0.90915 pu to 0.9494 pu. Table 5 gives the comparison of power losses with Genetic Algorithm and BPSO algorithm. From the Table 5 it has been observed that BPSO has got better loss reduction compared to Genetic Algorithm.
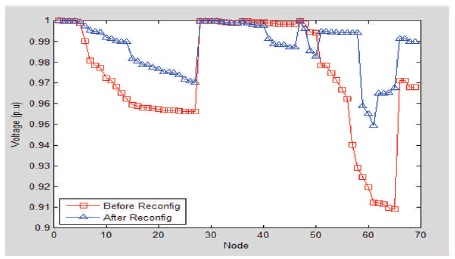
Figure 7. Voltage Profile of 69 Node Radial Distribution System
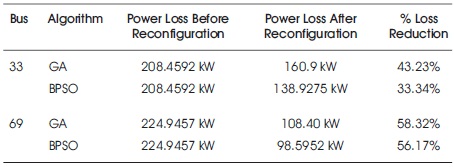
Table 5. Comparison of Power Losses
The final configuration of 69-node redial distribution system is shown in Figure 8.
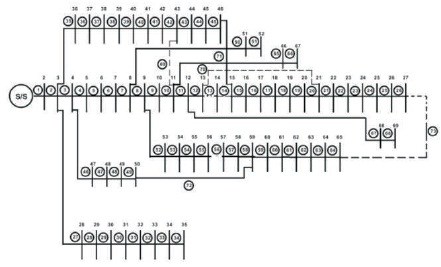
Figure 8. Final Configuration of 69-node Radial Distribution System
Table 6 gives the comparison of minimum voltage of before and after reconfiguration. For 33-node and 69- node systems, the BPSO algorithm has given a better minimum voltage compared Genetic algorithm.
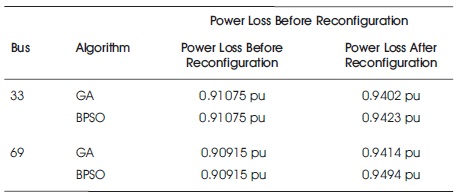
Table 6. Comparison of Minimum Voltages
The types of distribution system and their importance have been explained. The mathematical formulation of the loss minimization problem has been formulated. The two algorithms i.e., GA and BPSO have been explained. The two algorithms are tested with 33 bus and 69 bus radial distribution systems. After reconfiguration and using BPSO, the opened switches for 69-node radial distribution system are 69, 70, 13, 56, 73, and for 33-node radial distribution system are 7, 9, 14, 32, and 37. The power losses and voltage profile have been compared and found that BPSO gives better results compared to Genetic Algorithm.
In this work, the distribution network reconfiguration using Genetic Algorithm and Binary PSO to reduce power losses has been demonstrated. The same algorithm can also be extended for service restoration when there is fault in the system.