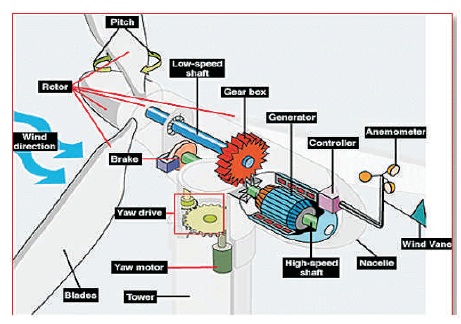
Figure 1. Detail Over View of a Wind Turbine representing Parts clearly
Renewable energy sources are playing a vital role in the power sector. Among the renewable energy sources, wind energy is playing a vital role. As the power of wind energy system increases, the control of their system becomes complex. Active and reactive power becomes increasingly more important from a system to satisfy the load demand for the consumers. To improve the power production, in the market, many companies are in the competition. Weibull analysis is used for analysis of wind speed. Based on the wind probability distribution function (pdf), the power curve and power distribution is calculated. This paper provides the detail set of power production of different types of wind power plants. A case study has been performed using simulation software by considering the base data of the companies.
Wind power is the most reliable renewable sources of energy. Wind technology has been in use since 644 A.D. In early 1900's wind technology has been implemented to generate power; now it is one of the prominent sources of renewable energy sources. Now a day's wind machine are installed vastly throughout the world and generating power in Mega Watts (Annual Report, 2014-2015). These wind plants are operating with two types of turbines viz HWAT and VWAT, but most of the companies are using HWAT. Most of the companies are designing the NACA Foils to improve the power profiles of the turbines. Figure 1 shows the parts of the wind turbine and how those are connected inside the wind turbine (Jilledi, Shalini Teshome, Tuka, & Wakijira, 2013). Figure 1 shows the detail parts of the wind energy system.
Figure 1. Detail Over View of a Wind Turbine representing Parts clearly
The detail graphical report of the power generation from wind power plant for the year 2013 to 2014 is shown in Figure 2.
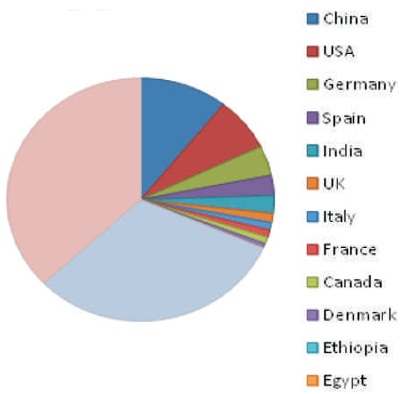
Figure 2. Detail overview of the Wind Power Generated by Wind Plants in the Year 2013 to 2014
The developing countries like India, Nepal, SriLanka, Ethiopia, Ghana, are concentrating more on the wind energy, as these countries are having very good wind and atmospheric conditions (Rao, Kumar, & Reddy, 2012). Due to favourable conditions in these developing countries, power generation in the renewable sector is increasing. Many research institutes are playing a vital role in developing this wind energy (Wind Energy Industry Manufacturing Supplier Handbook, 2011).
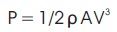
Here the main concern is about the HWAT wind power plants. A wind turbine transforms the kinetic energy of the wind into mechanical energy through a shaft and finally into electrical energy in a generator. The power can be expressed as in equation (1) (Manwell, McGowan, & Rogers, 2010).
Generally on the surface of land the wind is strongly affected by many obstacles like plants, roughness of the ground, and other geographical elements (Zhe, Yiru, Chuan, Jianhui, & Hao, 2009). As the height increases from the ground, the air layers of the geostropic is undisturbed. Between these two extremes, wind speed changes with height. This phenomenon is called vertical wind shear (Gertmar, Liljestrand, & Lendenmann, 2007; Gamesa Sustainability Report, 2013; Dena, 2010; Bhadra, Kastha, & Banerjee, 2003; Dewind, 1995; Jilledi & Shalini, 2017). In flat terrain and with a neutrally stratified atmosphere, the logarithmic wind profile is a good estimation for the vertical wind shear:
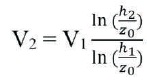
The reference wind speed v1 is measured at height h1. V2 is the wind speed at height h2. Z0 is the roughness length (See Appendix - 1).
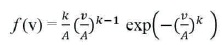
Naturally, the wind's speed constantly varies. In order to predict the wind turbines production, it is necessary to know exactly how often the wind blows and how strongly. Normally, the wind is measured with an anemometer and the mean wind speed is recorded every 10 minutes. This data can be sorted into wind speed classes of 1 m/s. The energy contained in the wind at a certain site may be expressed by this frequency distribution (Sarkar, Singh, & Mitra, 2011; Mohammadi & Mostafaeipour, 2013; Nasir, Raza, & Jafri, 1991). The Weibull distribution is often a good approximation for the wind speed distribution:
The approximation for the air density ρ (for dry air) was established based in measurements from a number of meteorological stations:

There are many companies which are contributing in the renewable energy production from wind power. Case studies of different companies like Dewind, Enercon - E33,53,82,101, Fuhrlander FL-1500, 2500, Gamesa G87,97, GEwindEnergyGE-1.5/77, 2.5/100, Leitwind-L77, L-80Nordex –N90, N100, REPOWER-MM92, RE3.2MW, Vensys- 90,100, have been presented.
Dewind power deployed the first turbine: D4 (500 kW) and it is using a Double Fed Induction Generator (DFIG) in its architecture. And major installed power plants are Little Pringle I&II Wind Farm-20 MW; it is installed in 2010 March, and the ratings of the station are ten2.0MW and it is located in north of Amarillo in the panhandled of Texas. And Dewind Frisco Wind Farm- 20MW and it under construction in Texas and 80MW in the south of Guymon in the Oklahoma Panhandled and 160MW in the same region (Dewind, 1995).
The Fuhrlander is one the major power produces in the wind sector; it started the journey in the year 1980 for inland sites. In this progression the power output had increased from 30 up to 800KW from the 13 to 54m tower (Fuhrlaender, 1991).
In the year 1994, it started the developing the wind turbines, but the company started the practical installation of wind turbines from the year 1996 in Aragon with Laplana III wind farm development, from that they didn't seen back in planting the wind plants in Spain with G42-600 KW in the year 1998 (Gamesa 2.0-2.5MW technical evolution, n.d). A lot of plants has developed, those are supporting the customers without any fail. Recent development in the market of Finland 135 MW, 44 MW in Turnkey and 50 MW in Urugay in the year 2012. And in 2014 for Brazil 98 MW and 25.5 MW in Greece to Eren (Siemens Gamesa, n.d). And many achievements has been taken from year 1994 to 2014. Throughout the world this is operating in 50 countries.
GE brings its years of experience with more than 18,500 wind turbines installed around the world. There are 1.5 MW turbine power projects in the states of Maharashtra, Karnataka and Tamil Nadu playing a vital role in developing the wind power (Ge, n.d).
The prototype of the first Leitwind turbine was installed in 2003. From that day it started to develop the wind farms in the year 2007. Now present almost 300 units are running throughout the world majorly in the countries, Austalia, Canada, France, India, Italy Sri Lanka, USA with an total power generation of 419.35 MW as per the reports of 2014 (Leitwind, n.d).
Apart from the above mentioned turbines in this paper the power profiles has been discussed below clearly for Nordex turbines (Nordex, n.d). It has been installed in many countries like Columbia, Ireland, Sweden, Japan etc. Repower (Repower, n.d) in 2013 Repower sold around 17 terawatt hours of electricity in the renewable sector and it is running from the hub of Germany and Switzerland. Vensys (Vensys, 1990) turbines it started the journey from the year 1990 at the University of Applied Sciences of the Saarland (HTW) in Saarbrücken under the leadership of Prof. Friedrich Klinger, developed a prototype in 1997 from the year 2002 Wind energy pioneer Hugo Denker joins the company, up to now many turbines has been installed, superfluous of power is generating by this turbines.
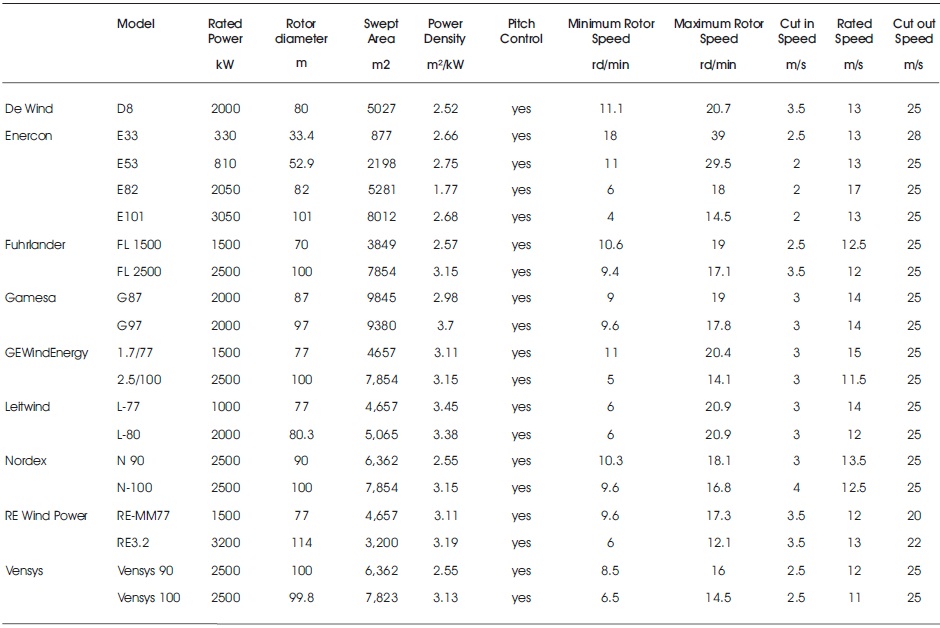
To perform the analysis of these turbines it is compulsory to determine the wind profiles (Kaoga, Sergeb, Raidandic, & Djongyangd, 2014). The technical specifications of the wind turbines under study are provided in Appendix - II.
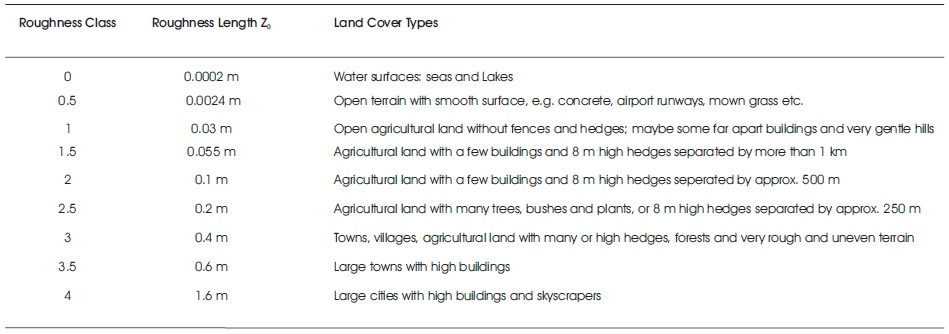
By considering the wind profiles as constant for all machines, and the (Rehman & Al-Abbadi, 2007; Chadee & Sharma, 2001; Tar, 2008) roughness class for seas, oceans, agriculture fields has been considered as constant values presented in Appendix -I.
1. The height above ground is h1 = 10 m
2. Wind Speed is v1 = 5 m/s
3. Roughness length it will varies from z0 0.1 to 1.6 m but, in this paper, for all calculations roughness class 2 is used.
The wind velocities arrived from the formula equation (2) an presented in Table 1.
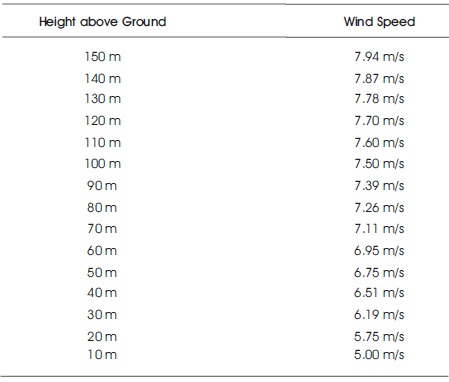
Table 1. Calculated Wind Speeds as with respective to Heights Swiss Wind Power Data (SWPD)
The wind profiles with respect to heights has been presented in the Figure 3.

Figure 3. Graphical Results of the Wind Speed (m/s) with respect to Height (m) SWPD
To do the Weibull analysis the equation (3) has been used. In this A is the Weibull scale parameter in m/s; a measure for the characteristic wind speed of the distribution (Conradsen, Nielsen, & Prahm, 1984; Koumanoudis, 1988; Azad, Rasul, & Yusaf, 2014). A is proportional to the mean wind speed. 'k' is the Weibull form parameter. It specifies the shape of a Weibull distribution and takes on a value of between 1 and 3. A small value for k signifies very variable winds, while constant winds are characterized by a larger k. So the Weibull analysis has been presented graphically in Figure 4.
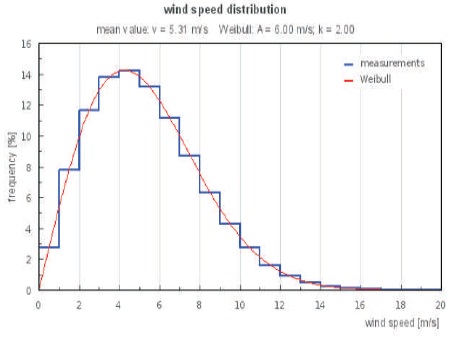
Figure 4. Wind Speed Distribution by Wei bull Analysis SWPD
The air density has been calculated by using equation (4) here the air density can be calculated by using altitude or by considering air pressure, temperature and relative humidity (Mathew, 2006; Redlinger, Andersen, & Morthorst, 1999; Mihelić-Bogdanić & Budin, 1992). The data considered for this
1. Air pressure =1050 hPa but the air pressure has been considered in between (500-1100 hPa).
2. Temperature is 25 oC, it can be considered between - 50 oC to 50 oC.
3. Relative humidity = 65%
The calculated air density is 1.218 kg/m³. This is used for all turbine analysis.
The power production analysis for different turbines has been presented clearly for each turbine and capacity factor for turbine, full load hours and operating hours has been presented clearly. And the parameters considered here are A= 6m/s, k=2. Let us see the results for each turbine.
[NOTE: All the below graphs shows the comparative results for Wind Speed Distribution, Power curve, Power production distribution. In the below graphs Blue line indicates Wind speed Distribution, Red line indicates power curve, Green line indicates power production distribution]
In Appendix – II few parameters of Wind Turbines of different Companies are tabulated like power capacity, power production based on operating conditions etc. using the red line from the Figures 5 to 13.
The Dewind D8/80 can produce the power of 2000 KW. The capacity factor is 17%, Full load hours per year is 1490 hour/year, operating hours 6233 h/year. And the power curves have been presented in Figures 5.
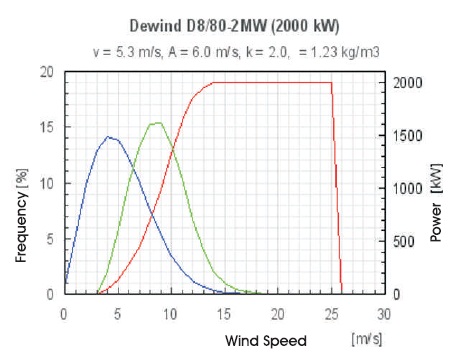
Figure 5. Graphical Results for Dewind D8/800
The Enercon E-33,E-53,E-82,E-101, here 4 different types of Enercon turbines has been considered with different power rating. And the graphical results has been presented below Figure 6.
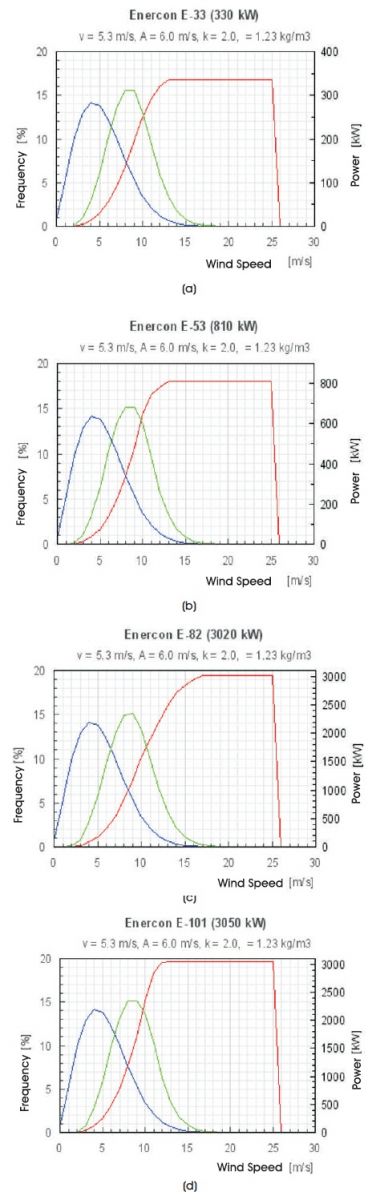
Figure 6. Graphical Results for Enercon (a) E-33, (b) E-53, (c) E-82, (d) E-101
The Fuhrlander FL-1500-77, and FL-2500- 100 here 2 different types of turbines has been considered with different power ratings. And the graphical results has been presented below Figure 7.
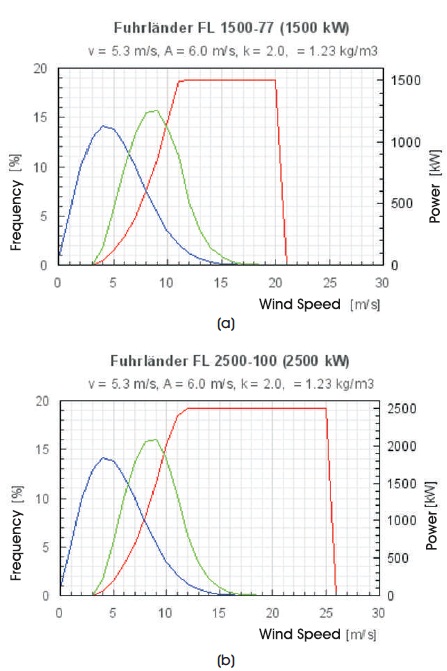
Figure 7. Graphical Results of Fuhrlander (a) FL-1500-77, (b) FL-2500-100
The Gamesa G-87 and G-97 these 2 types of turbines has been considered with same power rating. And graphical results has been presented below Figure 8.
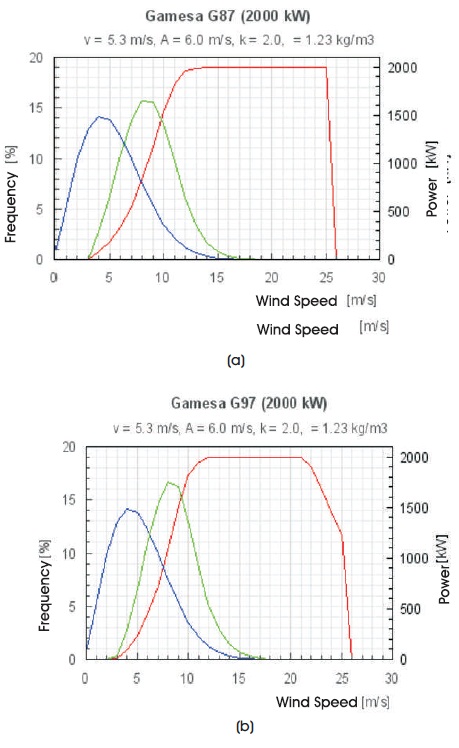
Figure 8. Graphical Results for Gamesa (a) G-87, (b) G-97
The G.E wind energy G.E-1.5/77 and 2.5/100 these 2 types of turbines has been considered with different power rating. And graphical results has been presented below Figure 9.
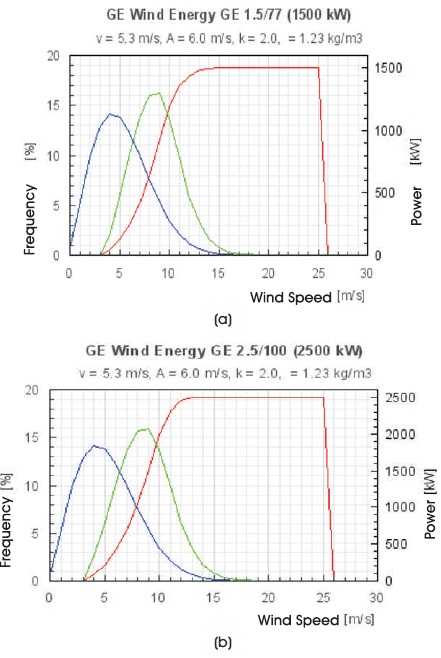
Figure 9. Graphical Results of G.E Wind Energy (a) GE-1.5/77, (b) GE-2.500-100
The Leitwind L-77 and L-80 these two types of turbines have been considered with different power rating. Graphical results has been presented below in Figure 10.
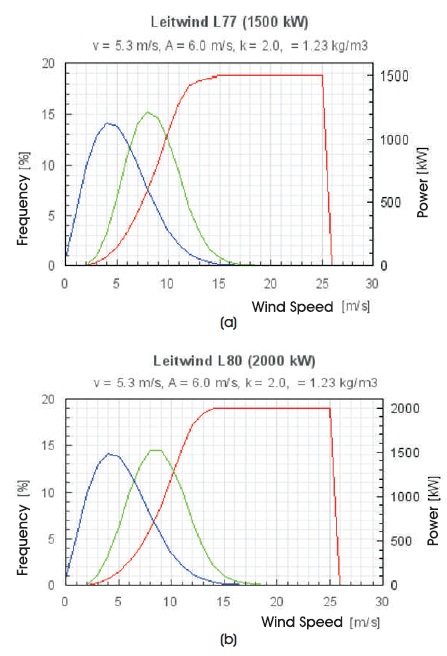
Figure 10. Graphical Results of Leitwind (a) L-77, (b) L-80
The Nordex N-90 and N-100 these two types of turbines have been considered with different power rating. Graphical results has been presented below in Figure 11.
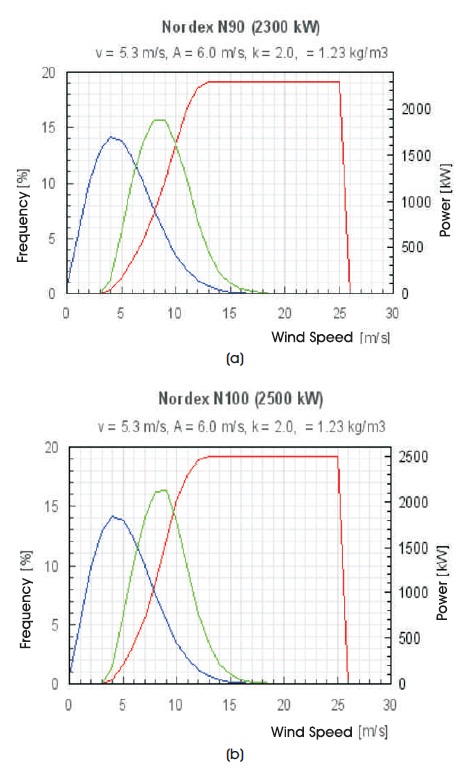
Figure 11. Graphical Results of Nordex (a) N-90, (b) N-100
The Repower MD-77 and RE3.2 these two types of turbines have been considered with different power rating. Graphical results has been presented below in Figure 12.
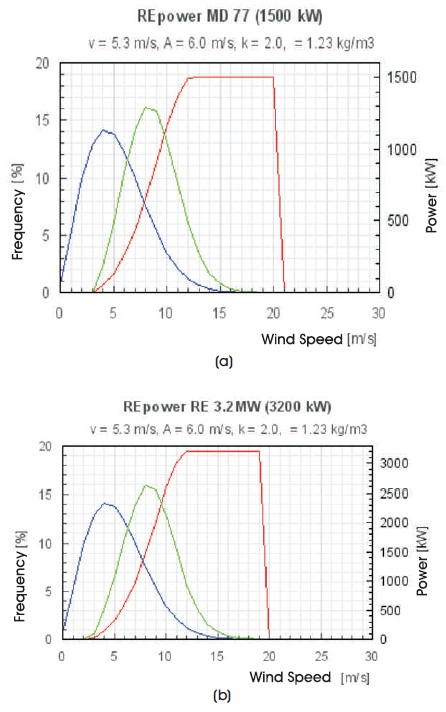
Figure 12. Graphical Results of Repower (a) MD-77, (b) RE-3.2
The Vensys V-100 and V-90 these two types of turbines have been considered with different power rating. Graphical results has been presented below in Figure 13.
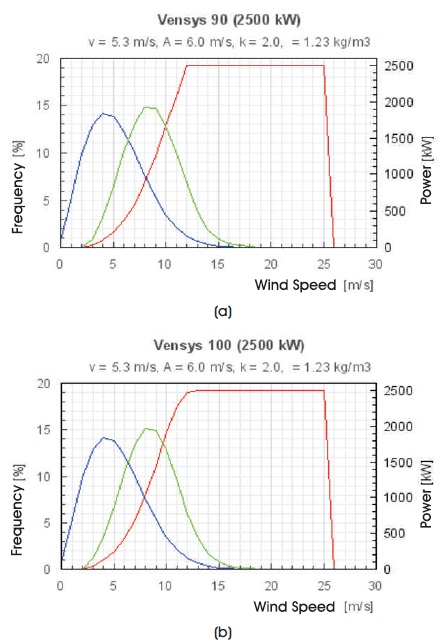
Figure 13. Graphical Results of Vensys (a) V-90, (b) V-100
After the Weibull analysis, the values of power production, capacity factor, full load hours and operating hours are calculated from the graph and tabulated in Table 2 for each commercial turbine. These calculated parameters will help the user to select appropriate wind turbine for installation.
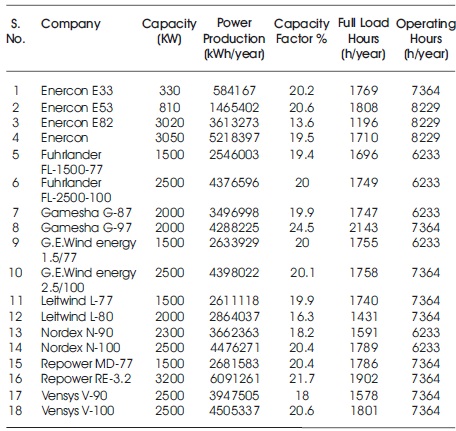
Table 2. Results for all Wind Turbines of Different Companies
This paper presents a new methodology for comparison of different company wind turbines at the specified wind speed, air density, constant temperature and mean wind speed. The wind speeds has been varied gradually from low to high. Different wind turbines graphical results have been presented clearly in graphical results. Finally the results have been presented for annual production of each turbine, capacity factor, operating hours of each turbine. So this paper will help the practical people to select the better wind turbine company to be installed in their country.
Appendix- I: Roughness Classes and Lengths
Appendix- II: Specification of Different Wind Turbine Models used in this Study