(1)
This paper presents an advanced Open Circuit Voltage (OCV) prediction technique for battery cells. The work contains an investigation to examine the relaxation voltage curves, to analyse the potential for the OCV prediction technique in a practical system. The technique described in this paper employs one simple equation to predict the equilibrated cell voltage after a small rest period. The practical work detailed in this paper was conducted at the Center for Automotive and Power System Engineering (CAPSE) battery laboratories at the University of South Wales (USW). The results indicate that the proposed OCV prediction technique is highly effective and using this technique appreciable benefit can be accrued.
Energy storage devices play a key role in the automotive sector. The overwhelming reliance that the world's consumer markets have placed on energy storage devices can be seen in the vast amount of applications required today (Zhang & Harb, 2013;Juraschka, Thanapalan, Guwy & Premier, 2014). The demand for Uninterruptible Power Supply (UPS) systems is growing substantially in parallel with the technical and economic evolution. They are used to protect hardware and electrical equipment, provide emergency power to a load when the input power supply fails (Bitterlin, 2004). This factor has increased the demand of energy storage devices, in particular batteries, where the temperatures and the use of products vary widely for different applications (Stephen, 1999). In recent years the consumer needs and product responsibilities have changed. Banks, hospitals, telecom, and many other industries have expanded their market, requiring battery devices that can support high rate discharge applications in different climatic conditions (Mariani, Thanapalan, Stevenson & Williams, 2013).
There are several battery technologies being used in today's industry to meet the specific needs listed above. However, the lead acid and lithium technologies command a large market share. The lead acid battery may not have the high energy density or fast cycle rates that the lithium technologies possess (Ribeiro, Johnson, Crow, Arsoy & Liu, 2001), but they are unparalleled in their tolerance for abusive conditions and are low in cost (Divya & Ostergaard, 2009). This is most notable in UPS systems where a battery bank can be stored in a remote area, usually an attic or a basement, where conditions can o swing between too hot (+40o C) or too cold (-20o C) on a daily basis. The preferred use of lead acid batteries in UPS systems also reflects their low price, with lead acid batteries on average 8.5 times (Euro/kWh) cheaper than lithium technologies (Divya & Ostergaard, 2009; Mariani, Stockley, Thanapalan, Williams & Stevenson, 2014). By contrast, using lithium technologies over lead acid cell chemistries the following advantages can be obtained. (i) A higher cell voltage, which is key to the high energy density; (ii) Greatly improved cycle count, with typical figures of 300–400 cycles; (iii) A more consistent manufacturing process between cells of the same type, resulting in more balanced battery modules and (iv) An improved specific energy and energy density. However, the benefits of lithium batteries are counter balanced by several drawbacks: (i) High initial cost – although prices are reducing with increased high volume production; (ii) Costly electronics for the Battery Management System (BMS) to protect the cells; (iii) Increased risk of overheating and fire due to the high energy, albeit this is mitigated by the use of a BMS and safer cell chemistries. (Sima, 2006; Stockley, Thanapalan, Bowkett & Williams, 2014). A key element of the BMS is estimation of the State of Charge (SoC) of the battery. The SoC indicates what percentage of the battery capacity has been used, so that the user can recharge the cells when necessary. The most common SoC estimation techniques are, coulomb counting, Electrochemical Impedance Spectroscopy (EIS) method and the Open Circuit Voltage (OCV) prediction techniques (Stockley et al., 2014). The OCV of a cell can be used to find the SoC of the cell due to its relationship and this method can accurately estimate the SoC and is relatively easy to implement in a practical system (Chiang, Sean & Ke, 2011; Roscher and Sauer, 2011). Thus, this work describes the Open Circuit Voltage (OCV) prediction techniques by presenting an in-depth cell level analysis for lead acid and lithium technologies.
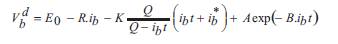
Over the last few decades battery system modeling has been addressed and developed to study the many different functions of the battery and the optimization of the battery cells. A variety of literature has been published on various aspects of battery cell modeling and operation (Thanapalan, Williams, Premier, & Guwy, 2011;Tremblay and Dessaint, 2009), that can be used to simulate and estimate the voltage of a cell from assets of known parameters. The cell voltage can be derived in both the charge and discharge state by using the following equations;

where, Vbc and Vbd are the cell voltage during charge and discharge. Eo is battery constant voltage, R is internal resistance, Q is battery capacity, ib is filtered current and b ib is actual battery charge. A and B are exponential zone b amplitude and time constant inverse respectively.
The equilibrated OCV is given by;
where, VOC is the equilibrated OCV, Vtr is the voltage at the time of measurement and Kv is a constant derived from v the equation Voc -Vt .
This section describes the test set-up, results and analysis of two types of battery cells. It aims to prove that equation (3) will be effective for both lead acid and lithium battery cells. In the case of lead acid battery cells, the OCV prediction technique may be difficult to implement due to the vast differences in cells, even in the same battery. Furthermore, a long rest period is required because the cells need to be equilibrated for an accurate measurement to be taken. An important research work has been completed by Aylor (1992) on an OCV prediction technique which estimates what the OCV will be after 3 hours, from a single measurement taken at 30 minutes, allowing the OCV–SoC method to be used practically. This prediction mechanism uses asymptotes on a semi-log scale and it is very complicated. However, it worked successfully, providing estimation errors of 5%.
By contrast, research and development at the CAPSE in USW has led to the development of a simple prediction mechanism which can be applied successfully to leadacid and lithium cells, with a maximum error of just ±0.2% and ±0.1% respectively. The prediction mechanism was validated with the experimental analysis conducted at the CAPSE's battery laboratory. This work was reported in Mariani, el at., (2014) and Stockley, et al., (2014). It is important to note that lead-acid and lithium cells have many different types and shapes. The work in this paper aims to prove that Equation (3) will be effective for any type of cell regardless of its shape and chemistries or technologies. Extensive system analysis and tests are conducted by using the prediction technique. The results indicate that the method may be used for variety of cases. In this paper, for illustrative purposes, example results of standard and advanced lead acid cell are shown. In the case of lithium battery system, pouch and cylindrical cell results are presented.
The experimental work conducted during this research work was performed on lead acid cells, from Valve Regulated Lead Acid (VRLA) batteries, and are the representation of many tests carried out in the CAPSE laboratory. As the work aims to prove that new advances in lead acid cells allow a more simplistic OCV prediction technique, the testing process was carried out on both "standard" and "advanced" cells. Figure 1 shows a VRLA battery on test and the test setup. As the battery needs to be intact to ensure any generated results are representative of a production VRLA battery, the Silversilver sulphate reference electrode technique was used. This technique measures the voltage across the ICC (internal cell connection) and the AGM (absorbed glass mat) to measure the voltage of each individual cell and is as unobtrusive as possible because access is gained through the vent valves as shown in Figure 1. The advantages of the silver-silver sulphate technique over alternative methods are 1) A precisely defined electrode potential. 2) Relatively simple implementation. 3) Availability in a variety of geometries at low cost (Ruetschi, 2003; Mariani et al., 2014)
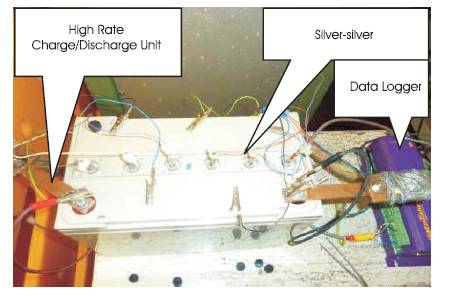
Figure 1. VRLA Battery Under Test
In order to apply this technique for both products, a similarity test was carried out. The test was to verify that the advanced and standard battery type had a suitable similarity between cells. This done by a set of capacity tests and relaxation tests. Figure 2 shows a comparison between two advanced cells and two standard cells for a 1C discharge. It can be clearly seen, that the results from the advanced product have less variability than the two results from the standard product. The standard product actually starts to deviate at 40-50% Depth of Discharge (DoD), whereas the advanced cells comply with each other until 95-100% DoD. Figure 2 also highlights the performance enhancement of the advanced cell compared to the standard cell, with the advanced cell voltage higher after 50% DoD.
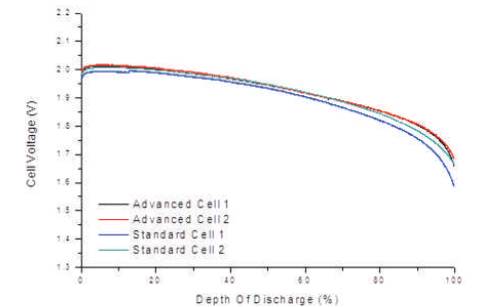
Figure 2. Similarity Test Comparisons of Lead Acid Cells
Thus, in this paper the results of standard cell are analyzed in order to incorporate the worst case scenarios and testify the effectiveness of the method. The cells were discharged at constant current to 80%, 60%, 40%, and 20% SoC. At the end of each 20% SoC, the cells were given a four hour rest period, where a voltage reading was taken every second. The cells under investigation were discharged at different current rates 0.3C, 1C, and 3C to monitor the variation on relaxation resulting from the increase in load applied on the cell. The example shown in the Figure 3 illustrates the discharge curve of the standard cell at 1C current rate. To ensure that the results were not discharge rate dependant, the tests were conducted at 0.3C, 1C and 3C rate.
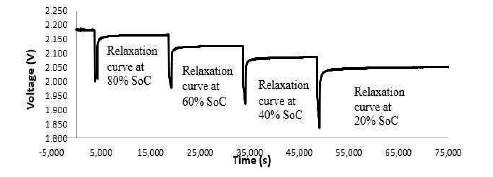
Figure 3. VRLA Cells discharge Test Setup
This was important because in a lead acid cell, the rate of discharge can drastically influence the amount of sulphuric acid consumed in the electrolyte. At low discharge rate, like 0.3C, the active material will be fully utilized by the discharge process, as the cells have enough time to utilize the significant quantity of strong electrolyte from the reservoir of the separator. During high rate discharge application (like 3C rate), the chemical reaction occurs so fast that it does not permit the full utilization of the reservoir of electrolyte contained in the cell separator. Figure 4 gives an overview of the cell OCV behavior of two standard products following a 1C discharge.
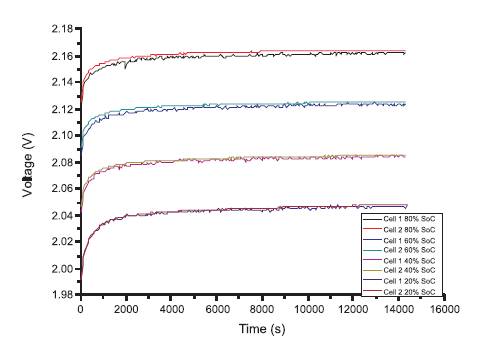
Figure 4. Comparison of the Voltage Relaxation Curves After 1C Discharge, of Two Lead Acid Cells
The results of the standard product OCV test have been compiled into Table 1. The cell voltage (Vtr) was measured after 30 minutes at open circuit, however, the true OCV measurement was not stable until the 240 minutes rest interval. For this type of cell the average voltage difference at open circuit from 30 to 240 minutes was 6.45 mV, and was chosen as the K constant value. Equation (3) v was used to calculate the predicted OCV after the 240 minutes interval, so that a comparison could be made with the measured (real) OCV after 240 minutes. To aid in this explanation a worked example has been provided below for the 1C relaxation curve at 60% SoC.
Voc = Vtr + Kv
Voc = 2.118 + 0.00645, Voc = 2.1245 OCV calculated, and
V real= 2.1248 OCV
From this example the error between calculated and real was -0.0165%. Table 2 contains a comparison of the real and calculated OCV of the investigated cell for all test conditions. The maximum prediction error for the standard product cell was calculated as ± 0.162% and can be seen in Table 2. It is important to note that these results may vary from product to product and in this work standard SWL2500 Yuasa battery cells were used.
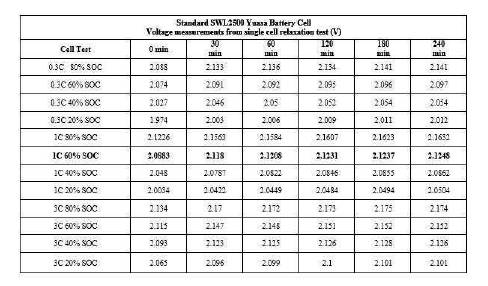
Table 1. Voltage Measurements From Standard Lead-Acid Cell Relaxation Test
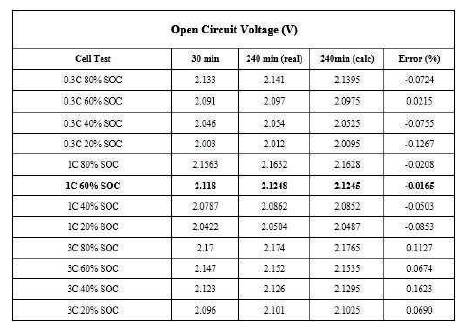
Table 2. Comparison of the Real and Calculated OCV for the Standard Lead-Acid Cell
This section describes the experimental studies of the lithium cells. The testing process was carried out on two of the most common types of lithium cells, cylindrical and pouch type. Figure 5 shows a block diagram of the test set-up. As previously stated, the tests were conducted in the CAPSE laboratories at the USW. An industry standard cell tester unit was used to charge/discharge the cell with a temperature logger to monitor the ambient temperature.
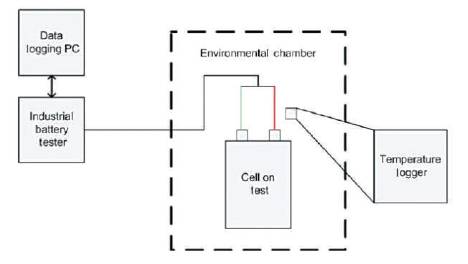
Figure 5. Block Diagram of Lithium Cell Test Equipment
For the implementation of the OCV prediction mechanism, the cells had to be proven to have a 'clonelike' similarity between two cells of the same chemistry and type. The OCV analysis carried out in the authors' previous work has indicated that the lithium cells are almost a clone of each other throughout the discharge until the 'knee' is reached(Stockley et al., 2014). The 'knee' occurs during the final 10 – 20% of the discharge resulting in a slight discrepancy between the two cells’ data, use of the cell after this point should be avoided and, therefore, the results are largely irrelevant. Furthermore, the previous results indicated that the cylindrical cells have more variability than the pouch cells. Thus, again similar to leadacid cells test, in order to incorporate the worst case scenarios and testify the effectiveness of the method cylindrical cells results are investigated in this paper.
The cylindrical cell chosen was an 8AhLiFePO4 cell. Figure 6 shows the relaxation test results for the 8Ah cylindrical cell following a 1C discharge. Similar to the lead-acid cell test, the relaxation tests were conducted by discharging the cell at 20% SoC intervals, followed by a 4-hour rest period at a sample rate of 0.1s to ensure the accuracy of the relaxation curves. The results of the cylindrical cell OCV test have been compiled into Table 3.
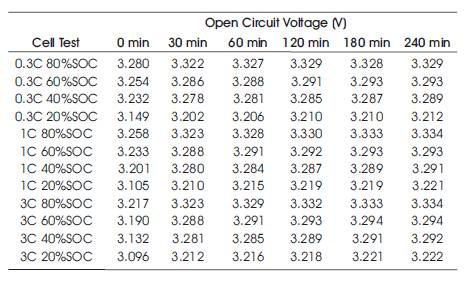
Table 3. Voltage Measurements From Cylindrical Lithium Cell Relaxation Tests
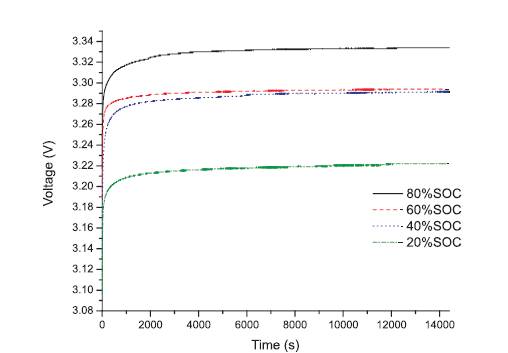
Figure 6. Relaxation Curves of Lithium Cylindrical Cell Following 1C Discharge
From Table 3 it can be seen that the difference between the 30 minute and 3 hour measurement is similar with an average difference of 0.01Volts difference. Therefore, to prove equation (3) on the cylindrical LiFePO4 cell the constant Kv was chosen to be 0.01. The following equation has been added to show the calculation for cylindrical cell. By substituting the calculated values in equation (3);
V
Voc = 3.323V + 0.01
V oc= 3.333V is obtained.
From the experimental tests conducted:
Vreal = 3.333V and therefore the error is 0% as shown.
The calculation proved to be a viable prediction method of the OCV of cylindrical cells. Table 4 shows the results of applying equation (3) for the cylindrical test points. Table 4 concludes that equation (3) can be successfully used to calculate the equilibrated OCV at the 3 hour interval from the 30 minute measurement with an error of just 5mV which is about 0.1%. This proves that the simple equation works on cylindrical cells, and that it can be transferred to different cell chemistries.
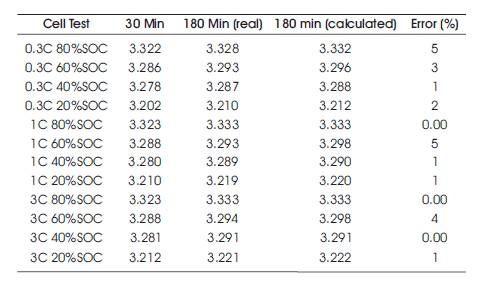
Table 4. Comparison of the Real and Calculated OCV for the Cylindrical Lithium Cells
This paper provides a comparative analysis of advanced OCV prediction mechanism for battery cells used in vehicular systems. By performing various tests, using a simple equation, it was possible to predict the OCV of any type of battery cell regardless of its shape and chemistries or technologies. The one simple equation was applied to two different lead-acid and lithium cell technologies. In both cases the margin of error found from the real OCV and the calculated values was ±0.2% and ±0.1% respectively. From the results it is evident that it was possible to predict the OCV in the lead-acid and lithium cells after a short rest period by using equation (3). Furthermore, the results shows that the equation (3) could be used on a wide variety of cells with a reasonable error margin. A notable point is that although the first measurement is taken only after 30-minutes and the error rate is lower, the next challenge is to reduce the waiting time to take the first measurement and to reduce the error rate. Stockley et al. (2014) addressed this issue and managed to reduce the waiting interval as little as 8 minutes, however the error had increased. Therefore, it is important to find a better trade-off between the first measurement waiting time and the error rate, in order to maintain a better accuracy. Future work is now proceeding to expand this OCV prediction mechanism to further account for the first measurement waiting time and the error rate.
This research was partially supported by the European Social Fund (ESF) through Welsh Government (WG) and the University of South Wales (USW).