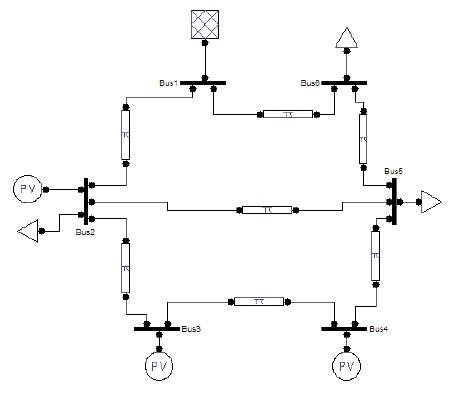
Figure 1. IEEE-6 Bus System
Contingency analysis is the study of the outage of elements such as transmission lines, transformers and generators, and investigation of the resulting effects on line power flows and bus voltages of the remaining system. This paper presents the simulation of a contingency analysis of IEEE-6 Bus power system using PSAT in Matlab toolbox. The contingency analysis for the given IEEE-6 Bus system for line 3-4 outage is carried out. Simulation of line outage is more complex than a generator outage, since line outage results in a change in system configurations.
Power systems are operated so that overloads do not occur either in real-time or under any statistically likely contingency.
Contingency analysis is the study of the outage of elements such as transmission lines, transformers and generators, and investigation of the resulting effects on line power flows and bus voltages of the remaining system. It represents an important tool to study the effect of elements outages in power system security during operation and planning. Contingencies referring to disturbances such as transmission element outages or generator outages may cause sudden and large changes in both the configuration and the state of the system. Contingencies may result in severe violations of the operating constraints. Consequently, planning for contingencies forms an important aspect of secure operation [1][2] [5]
Figure 1 shows the single line diagram of IEEE-6 Bus system. Load data, line data, and generator data are listed in the Tables 1, 2 and 3.
MVA Base=100 MVA
System Frequency = 60 Hz
Bus Nominal Voltage =11KV
Bus Maximum Voltage = 11.5 KV
Bus Minimum Voltage = 10.4 KV
Figure 1. IEEE-6 Bus System
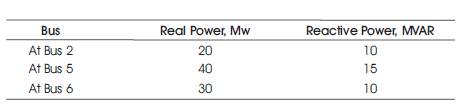
Table 1. Load Data
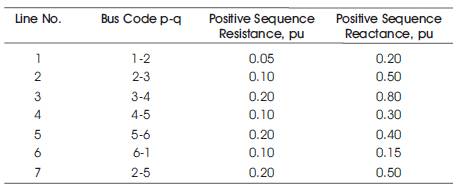
Table 2. Line Data

Table 3. Generator Data
PSAT is a Matlab-based power system analysis tool which is freely distributed on line[3]. PSAT includes power flow, continuation power flow, optimal power flow, small-signal stability analysis, and time-domain simulation. The toolbox [4] is also provided with a complete graphical interface and a Simulink-based one-line network editor. The features included in PSAT are the Power Flow (PF), the Continuation Power Flow and/or Voltage Stability Analysis (CPF-VS), the Optimal Power Flow (OPF), the Small-Signal Stability Analysis (SSA), and the Time-Domain simulation (TD), along with “aesthetic” features such as the Graphical User Interface (GUI) and the Graphical Network Editor (GNE).
PSAT has been thought to be portable and open source. At this aim, PSAT has been developed using Matlab, which runs on the commonest operating systems, such as Unix, Linux, Windows, and Mac OS X. Nevertheless, PSAT would not be completely open source if it ran only on Matlab, which is a proprietary software. To this aim PSAT can run also on the latest GNU/Octave releases, which is basically a free Matlab clone. In the knowledge of the author, PSAT is actually the first free software project in the field of power system analysis [6]. PSAT is also the first power system software which runs on GNU/Octave platforms.
The IEEE-6 bus system is simulated using PSAT and load flow analysis is carried out. The same system is simulated with 3- 4 line outage.
Case1: Normal Operation
Case2: With 3-4 line outage
From Figure 2 and Figure 4 we can conclude that power loss will increases with 3-4 line outage as load increases. From Figure 3 and Figure 4 we can conclude that power generation will reduce with 3-4 line outage as load increases. Figure 5 shows the Total Power generation for varying load.
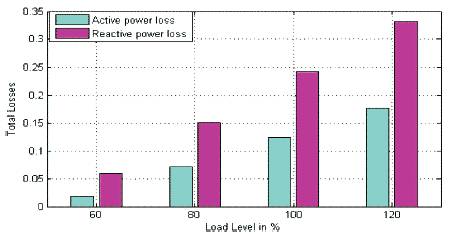
Figure 2. Total Power Loss for varying load
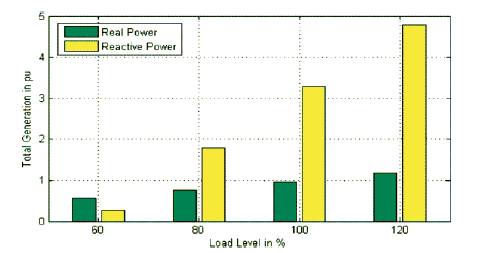
Figure 3. Total Power generation for varying load
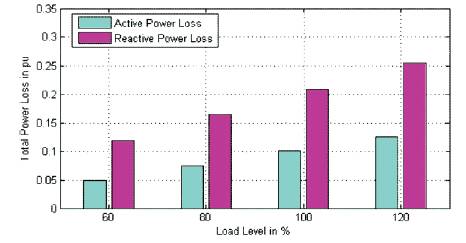
Figure 4. Total Power Loss for varying load
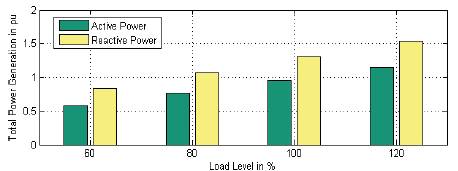
Figure 5. Total Power generation for varying load
In this paper, Contingency Analysis is carried out. The given system is simulated with normal condition and with 3-4 line outages. Figures 6 and 7 show the Load Flow Report. It is found that with 3-4 line outages, total power losses are increased. The line flows and power flows in each line are increased. The reactive power compensators are good devices to control the power flows during contingency.
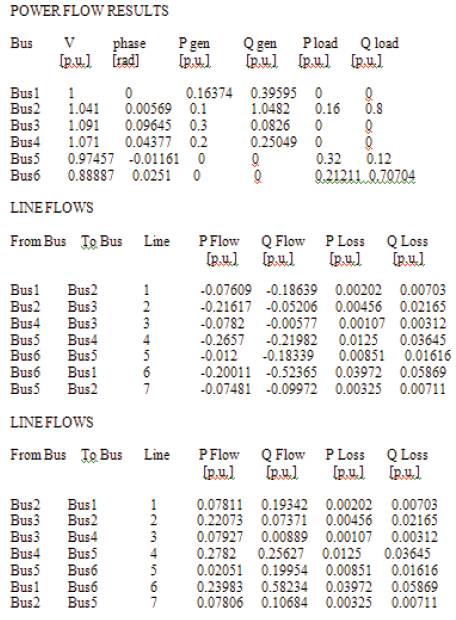
Figure 6. Load flow report with 60% load without 3-4 line outages
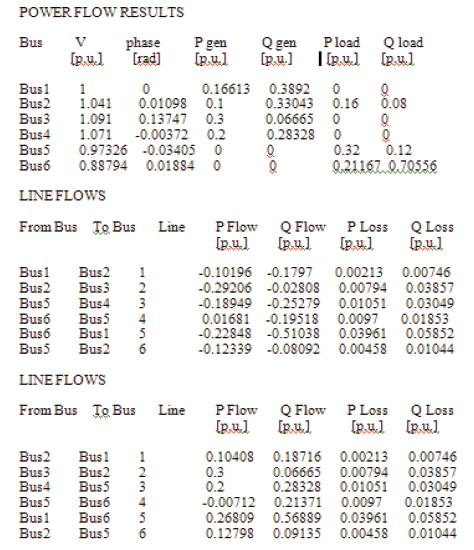
Figure 7. Load flow report with 60% load with 3-4 line outage
Results have shown that the power losses increase and power generation reduces in the system with line outages as load increases. To control the power flows during the contingency FACTS controllers are used, such as Static VAR Compensators (SVC), Static Synchronous Compensators (STATCOM), Thyristor Controlled Series Compensators (TCSC), Static Synchronous Series Compensators (SSSC) and Unified Power Flow Controllers (UPFC).