(1)
The modern power system is becoming more complex due to change in the system configuration day to day, to meet the increasing demand in electrical energy, by installation of new generating units and interconnection of transmission lines and extra high voltage tie lines etc. The ever growing load demand in the power system witnesses a gradual decrease in the system voltage profile. It is precisely the inability of the system to generate the required reactive power that propounds the cause of voltage collapse. The recent development in power electronics is the introduction of flexible AC transmission system (FACTS), which can facilitate the control of power flow and increase the power transfer, to be more flexible, secure and economical by controlling various electrical parameters of transmission circuits. To generate the required reactive power of the load and to improve voltage profile of the system, shunt compensation to the system is required. Shunt Facts controllers like SVC , STATCOM have the ability to provide the mentioned requirements of the power system.
In this paper an algorithm is formulated to model and place the STATCOM in two test cases which is approved by IEEE such as IEEE30 bus, and IEEE57 bus. The formulated algorithm is tested on the two IEEE test cases such as IEEE 30bus and IEEE 57bus and the results are discussed.
The present day power systems continue to witness an exponential growth in demand, owing allegiance to extensive automated needs of both domestic and industrial utilities. It is in tune with the growth of nation that extent of sophistication appears to evince a sense of reality in present day world. The ever growing load demand in the power system witnesses a gradual decrease in the system voltage profile. It is precisely the inability of the system to generate the required reactive power that propounds the cause of voltage collapse.
Introduction of the recent development in power electronics is the Flexible AC Transmission System (FACTS), which can facilitate the control of power flow, and increase the power transfer to be more flexible, secure and economical by controlling various electrical parameters of transmission circuits.
Shunt compensation, especially shunt reactive compensation has been widely used in transmission systems to regulate the voltage magnitude, improve the voltage quality, and enhance the system stability. Shuntconnected reactors are used to reduce the line overvoltages by consuming reactive power, while shuntconnected capacitors are used to maintain voltage levels by compensating the reactive power to transmission line.
STATCOM is the one of the shunt fact controller device which is used to improve the voltage profile and provide required reactive power to the load. The modeling of STATCOM for the load flow is discussed in the further parts of this paper
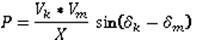
The power transmission line can be represented by a twobus system “k” and “m” in ordinary form. The active power transmitted between bus nodes k and m is given by:
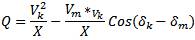
Where δk and δm are the voltages at the nodes, (δk-δm) is the angle between the voltages and, the line impedance. The power flow can be controlled by altering the voltages at a node, the impedance between the nodes and the angle between the end voltages. The reactive power is given by:
It is acceptable to expect that for the aim of positive sequence power flow analysis, STATCOM need to be represented by a synchronous voltage source with maximum and minimum voltage magnitude limits [4]. The synchronous voltage source stands for the fundamental Fourier series component of the switched voltage waveform at the AC converter terminal of the STATCOM. The bus at which the STATCOM is connected is represented as a PV bus, which may change to a PQ bus in the case of limits being violated. In this case, the generated or absorbed reactive power would reach to the maximum limit. The STATCOM equivalent circuit shown in Figure 1 is used to obtain the mathematical model of the controller for incorporation in power flow algorithms [2].
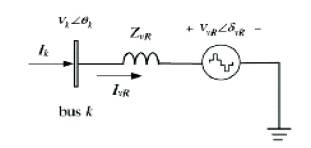
Figure 1. STATCOM Equivalent Circuit
The power flow equations for the STATCOM are derived below:
Based on the shunt connection shown in Figure 1, the following may be written:
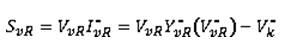
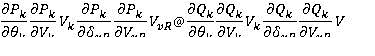
After performing some complex operations, the following active and reactive power equations are obtained for the converter and bus k, respectively:


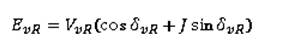
Using these power equations, the linear zed STATCOM model is given below, where the voltage magnitude VvR and phase angle δvR are taken to be the state variables[4].
The main consideration of shunt compensation is to improve the voltage profile and to provide the reactive power to the load. The compensation for achieving above requirements is done through the calculation of suitable location of the compensating device.
The limitation of the voltage profile of the power system is checked by using power flow analysis of the bus system. The bus which has least voltage profile is the suitable location of the shunt compensating device, but for the optimal location of the device “Voltage collapse prediction index ” is used.
Voltage stability index is proposed based on the voltage phasor information of the taking part buses within the system and also the network admittance matrix. Using the measured voltage phasor and also the network admittance matrix of the system, the Voltage Collapse Prediction Index (VCPI) is calculated at each bus. The value of the index determines the proximity to voltage collapse at a bus. The technique comes from the fundamental power flow equation, that is applicable for any variety of buses in an exceedingly complex system. The power flow equations are resolved by Newton Raphson methodology, that creates a partial matrix. By setting the determinant of the matrix to zero, the index at bus k is written as follows:
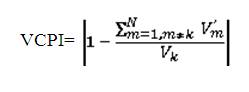
Where,
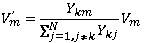
Vk is the voltage phasor at bus k
Vm is the voltage phasor at bus m
Ykm is the admittance between bus k and m
Ykj is the admittance between bus k and j
k is the monitoring bus
m is the other bus connected to bus k
N is the bus set of the system
The value of VCPI varies between zero and one. If the index is zero, the voltage at bus k is taken into account as stable, and if the index is unity, a voltage collapse is claimed to occur. VCPI is calculated solely with info of voltage phasor of taking part buses, and impedance of relating lines. The calculation is straightforward while matrix conversion is not. The technique offers quick calculation which may be applied for on-line watching of the power system.
The formulated method for optimal location of STATCOM is tested on two test systems which are IEEE 30 bus, IEEE57 bus system
The single line diagram of IEEE 30 bus system is shown in Figure 2.
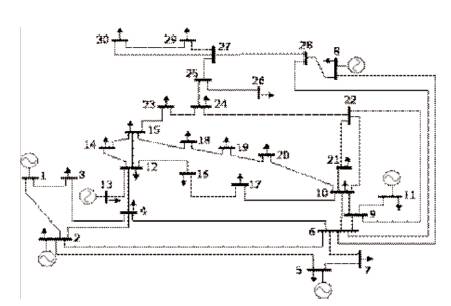
Figure 2. Single line diagram of IEEE 30 bus system
The load profile and line power flows of IEEE 30 bus system without placing the STATCOM is shown in Figures 3, 4 and 5 respectively.
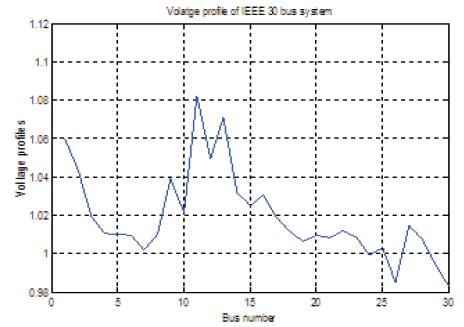
Figure 3. Voltage profile of IEEE 30 bus system
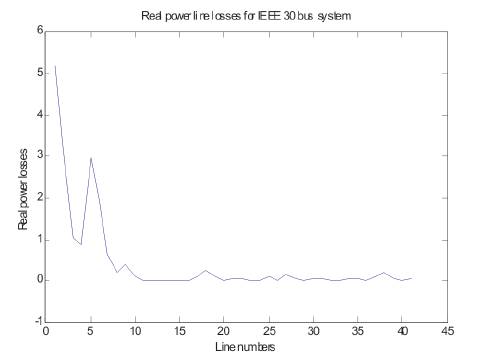
Figure 4. Real power line losses of IEEE 30 bus system
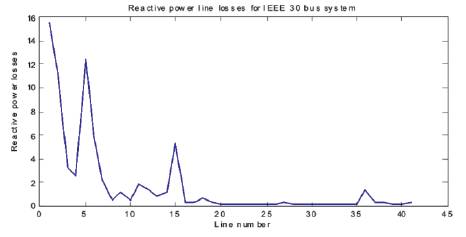
Figure 5. Reactive power line losses for IEEE 30 bus system without placing STATCOM
The minimum voltage for IEEE 30 bus system without STATCOM is 0.9828. The real power losses and reactive power losses for IEEE 30 bus system is 17.759 MW and 69.753MVar.
The Voltage Collapse Prediction Index (VCPI) of IEEE 30 bus sytem is shown in Table 2. At bus no 30, the VCPI is maximum (as seen in Figure 6) which has more chance for making the system to be unstable, so bus 30 is the most suitable and optimum placement for shunt compensation such as STATCOM. Table 1 shows the system conditions of IEEE 30 bus system with STATCOM.
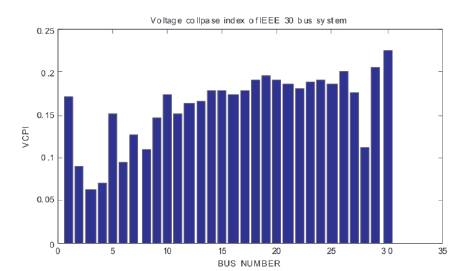
Figure 6. VCPI of IEEE 30 bus system
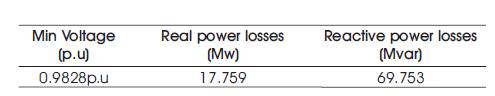
Table 1. System conditions of IEEE 30 bus without STATCOM
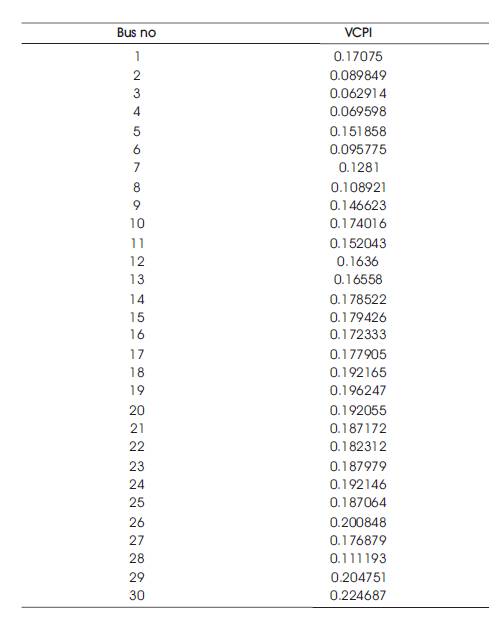
Table 2. VCPI of IEEE 30 bus system
By placing the STATCOM at bus 30, the voltage profile of the system is improved and the minimum voltage is 0.9912. The voltage profile of IEEE 30 bus with and without STATCOM is shown in Figure 7. The real power losses and reactive power losses decreases with the placing of STATCOM at 30 bus of the system which is shown in Table 3.
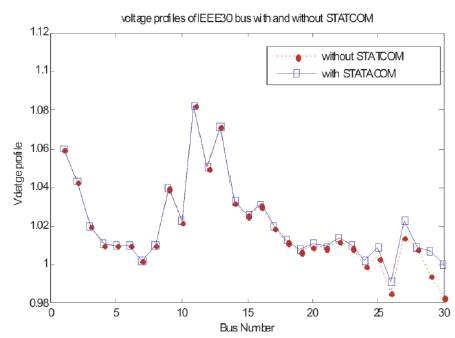
Figure 7. Voltage profile of IEEE 30 bus with and without STATCOM
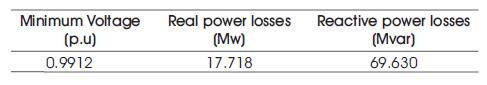
Table 3. System conditions of IEEE 30 bus system with STATCOM
The formulated algorithm for optimal placement of STATCOM is also tested on IEEE 57 bus system. The single line diagram, and voltage profile of IEEE 57 bus and real and reactive power losses without STATCOM are shown in Figures 8, 9 respectively. The real and reactive power losses and VCPI of IEEE 57 bus system is given in Table 4 and Figure11 respectively. After placing the STATCOM, the change in real and reactive power losses and voltage profile is shown in Table 4 and Figures 12 and 13 respectively.
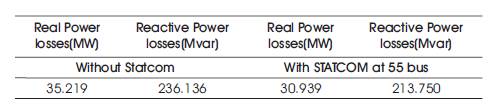
Table 4. Real and Reactive power losses of IEEE 57 bus with and without STATCOM
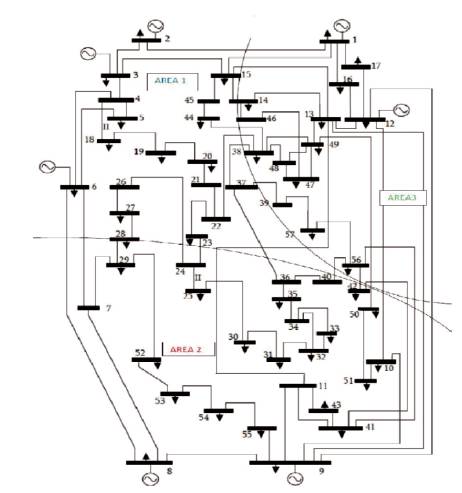
Figure 8. Single line diagram of IEEE 57 bus system
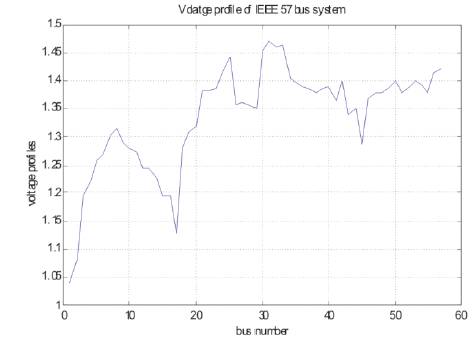
Figure 9. Voltage profile of IEEE 57 bus system without STATCOM
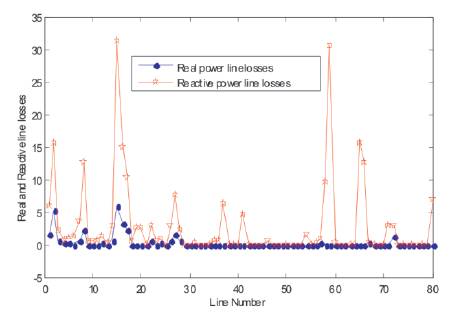
Figure 10. Real and Reactive line losses without STATCOM
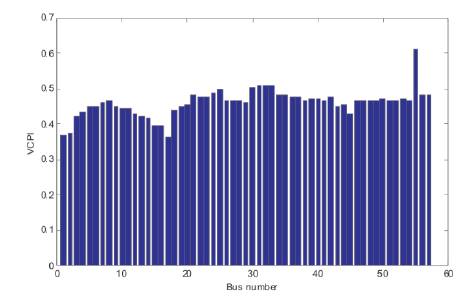
Figure 11. VCPI of IEEE 57 bus system
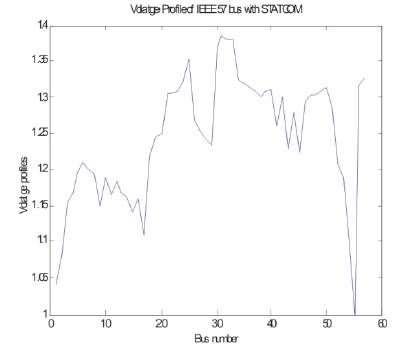
Figure 12. Voltage profile of IEEE 57 bus system with STATCOM
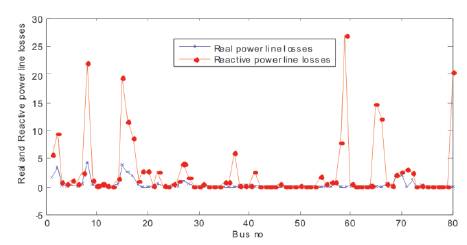
Figure 13. Real and Reactive line losses of IEEE 57 bus with STATCOM
The proposed method has been tested on two IEEE test cases. The algorithm for finding the location of STATCOM is done by using MATLAB software. In IEEE 30 bus system the location and improvement of voltage and reduction of losses are shown in Tables 1 and 3 respectively and in IEEE 57 bus system the voltage profile improvement is shown in Figure 12. From the two cases, it is concluded that the voltage profile is improved and power losses are reduced by using shunt FACT device like STATCOM.