(1)
In distribution systems, Distributed Generation (DG) plays a vital role in meeting the demands of electrical energy. It is a small and self generating plant which provides power to industries and homes by improving the voltage profile, stability and by reducing the system losses. Optimal location and sizing of distributed generation in a radial distribution network is an optimization problem with both discrete and continuous variables. This paper presents a fuzzy approach for finding optimal locations by Teaching Learning Based Optimization (TLBO) technique for finding optimal DG sizes. The main objective is to reduce the system power losses and improve the voltage profile of the distribution network. The TLBO is inspired by the influence of the teaching by a teacher to the students in a class. In this paper, GUI is developed in Matlab to perform load flow and to obtain optimal location and sizing of DG. The proposed method was tested on IEEE 15 bus, 33 bus and 69 bus systems and the results were discussed.
Electrical energy plays a vital role in the economic development of any country. Electric power system is an interconnection of generating, transmitting and distribution systems. Usually, distribution systems are radial in nature and power flow is unidirectional. Due to increase in the demand, modern power distribution network is constantly being faced with an ever-growing load demand. In the past decades, several attempts were made to improve the voltage profile and to reduce the power losses by placing distributed reactive power sources such as capacitor banks of optimal sizes at optimal locations. Recently, solutions have been suggested for complementing the passiveness of radial distribution system by embedding electrical sources of small capacity based on renewable energy technology to improve system reliability and voltage regulation. Such embedded generations in the distribution system are also called as Dispersed Generation or Distributed Generation (DG).
DG is a power source which is connected directly to customer or to distribution system. The benefits that can be achieved using DG are reduced power losses, improved voltage profile, better voltage regulation, onpeak operation cost reduction etc. So, in order to optimize all these benefits, it is necessary to identify the optimal access point and optimal capacity of DG.
Distributed Generation has become a research topic for the past twenty years. Lot of studies have been carried out in this area by (Dugan, R.C. & McDermott, T.E, 2002). (Kyu- Ho Kim & Yu-Jeong Lee, 2002) presented a Fuzzy-GA technique to solve DG placement problem for Radial Distribution System (RDS). Its objective is to reduce the costs and power loss of RDS. An analytical method for calculating optimal size of DG and an efficient methodology for identifying optimum location for DG were proposed by (Caisheng Wang, 2004) in order to reduce the losses. Optimal Capacitor Placement and sizing by using Fuzzy and PSO to reduce the annual cost savings is proposed by (M. Damodar Reddy, 2008), where capacitor is placed at high suitability index by using Fuzzy approach and optimal capacity is determined by using PSO.
(Rajesh Kumar Singh, 2010) presents a new technique based on nodal pricing for optimally allocating the distributed generation to achieve profit, loss reduction, and voltage improvement. (Ghosh, 2010) discussed a simple analytical technique for optimal DG placement and sizing in order to attain maximum benefit and congestion mitigation. The main objective is to reduce both cost and loss effectively. Minimizing the power losses and evaluating the network capacity by placing multiple DG units were discussed by(Naveen Jain, 2010) using Particle Swarm optimization. A multi objective function to enhance the reliability and voltage profile is solved by (N. Khalesi, 2011) by determining the optimal location and capacity of DG using dynamic programming.
In a distribution network, as the location and sizing of DG sources has a profound impact on the network losses, (Mohammad Hasan Moradi, 2012) proposed a novel hybrid technique combining Genetic Algorithm (GA) and Particle Swarm Optimization (PSO) to reduce the voltage regulation and to improve the voltage stability. (Ravipudivenkata Rao, 2012) proposed an efficient optimization technique called Teaching-Learning Based Optimization (TLBO) for solving continuous non-linear optimization problems. As the GUI acts as an easy interface to the users for giving the input and for obtaining the results, (Jaikaran Singh, 2014) developed a Matlab GUI screen for optimal location of capacitor using ant colony optimization algorithm. (Sneha, 2014) presented teaching learning based optimization technique for optimal capacitor location.
TLBO is an evolutionary method which is based on the influence of quality of teaching of teacher on the learners. Compared to all other algorithms, it can be easily implemented as it doesn't require any parameter dependency for its operation and it requires less computational effort and memory. As the meta-heuristic methods are becoming very attractive for solving optimization problems, in this paper optimal location of DG is obtained by using Fuzzy approach and optimal capacity of DG is determined by using TLBO.
The problem is to determine the optimal location and sizing of the DGs which minimizes the total real power losses and improves the voltage profile.
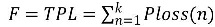
The objective function for optimal location and sizing of DG in radial distribution network problem is calculated as follows:

Where,
F - Objective function
TPL - Total real power loss
N - Number of buses
k - Number of branches i.e. k=N-1
Ploss(n) - Real power loss for branch m
Ib(n) - Current through branch n
R(n) - Resistance of branch n
The constraints are listed as follows:
a) Bus Voltage Limit:
Voltage magnitudes of buses are limited as
Vmin ≤ V1 ≤ Vmax
Where Vmin and Vmax are the minimum and maximum values of magnitudes of bus voltages respectively.
b) Power limits of DG:
Where, PDGJ is the injected active power of DG at ith bus.  are the minimum and maximum limits of injected active power of DG respectively.
In this paper, the optimal locations for DG are identified by using fuzzy approach. The main objectives for identifying the suitable DG locations are improving the voltage profile and minimizing the total power losses. The inputs to the fuzzy inference system (FIS) are per unit nodal voltages and power loss indices and the output is DG suitability index (DG.S.I). FIS consists of rules which are used to determine the optimal DG location in the distribution system. By modeling the membership functions and simulating, DG's can be placed on the nodes with the highest DG suitability Index. Here approximate reasoning is employed in such a way that a node in distribution system with high losses and low voltage magnitude is selected as the node with high suitability index.
Initially load flow solution is required to obtain the real and reactive power losses. In order to obtain the power loss reduction, compensate the real and reactive power load at every node and then normalize them into [0, 1] range. Power loss Index value at mth node can be calculated as follows:
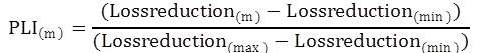
PLI(m) - power loss index at mth node
Lossreductionm - Loss reduction at mth node.
Lossreductionmin – Minimum Loss reduction
Lossreductionmax – Maximum Loss reduction
In this present work, Fuzzy Logic Toolbox is used for finding the DG suitability index.
In Matlab command window type, “fuzzy” to open the basic FIS Editor. Select Mamdani type FIS. In this paper, two input variables such as power loss index (PLI) and per unit nodal voltage (V) and one output variable DG suitability index (DGSI) are selected. PLI range varies from 0 to 1, V varies from 0.9 to 1.1 and DGSI varies from 0 to 1.
In this paper five membership functions like VL, L, M, H, VH are selected for PLI. All the above five membership functions are triangular in shape as shown in Figure 1.
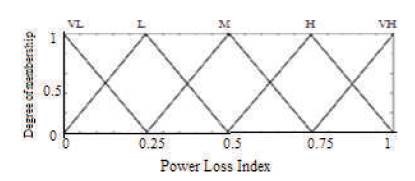
Figure 1. Membership Function Plot for PLI
Five membership functions like VL, L, M, H, VH are selected for Voltage. They are trapezoidal and triangular in shape as shown in Figure 2.
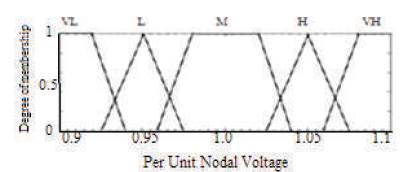
Figure 2. Membership Function Plot for Per Unit Nodal Voltage
Five triangular membership functions like VL, L, M, H, VH are selected for DGSI as shown in Figure 3. Table 1 shows the Rule Matrix for finding Suitable DG Locations.
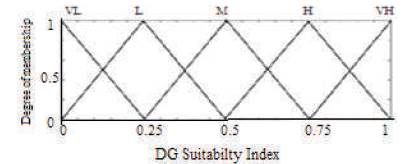
Figure 3. Membership Function Plot for DGSI
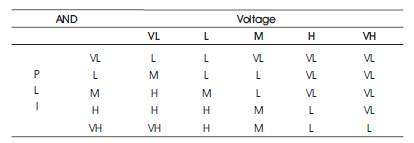
Table 1. Rule Matrix for Finding Suitable DG Locations
In FIS, rules play a vital role. Rules define the behaviour of the system. Here, rules are defined to determine the suitable location of DG. Rules are constructed in the form of IF premise (antecedent), THEN conclusion (consequent). In the present work, the inputs to the rules are PLI and V and the output is DGSI. Here, 25 rules are framed to find the optimal location of DG and are summarized in fuzzy decision matrix as follows:
The term optimization is defined as either maximizing or minimizing the tasks in order to obtain the best solution. Inspired by the nature of influence of a teacher on learners, Ravipudi Venkata Rao proposed Teaching Learning Based Optimization Technique (TLBO). In comparison with other algorithms, it is a simple and robust technique involving only few computations. TLBO algorithm consists of 2 phases. They are teaching and learning phase. Teacher shares the knowledge among the students and motivate them in enhancing their knowledge. The students then interact among themselves and try to improve their results. Thus, teacher tries to improve the level of student's knowledge and quality of the students depends on the teaching quality of teacher and interaction among them. Here population indicates number of learners and different design variables are similar to different courses.
Teacher Phase: In this, with the guidance of teacher, students improve their knowledge which in turn improves the mean result of the class. Improvement in the mean score depends upon the quality of teaching by the teacher. New position of each student is given by
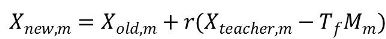
Xold.m is old position of individual who needs to learn from the teacher in order to increase knowledge level.
M is the number of courses.
Xteacher.m is the best position of individual who tries to improve, the mean score of class.
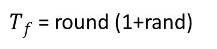
Tf is the teaching factor. r is the random number.
Mm is the mean value of the outcomes of class.
For each student, new value is accepted only if the new position is better than previous position.
Learner Phase: In this phase, students further improve their knowledge by interacting among themselves. Here, the new position of the student is obtained by considering two other randomly selected students knowledge level. Each student enhances their knowledge level by interacting with other randomly selected student if that student has better level of knowledge. New position of each student is given by
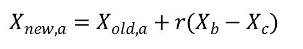
Xb and Xc are randomly selected students and b≠ c.
Here also new value is accepted only if the new position is better than previous position.
A Graphical User Interface (GUI) is a pictorial representation of a program. It makes the program easier to understand by providing them with a good look and with controls like popup menus, sliders, pushbuttons and so on. With the use of GUI in Matlab, user can perform any task interactively. Moreover, there is no need of understanding the details of a program for the end users.
In Matlab, a tool called Guide (Graphical User Interface Development Environment) is used to create GUIs. This tool simplifies the process of developing the GUIs. Programmer can select and align the components of GUI by using this tool. For performing a task in Matlab GUI, 3 steps are to be followed:
In order to create a Matlab GUI, 3 principal elements are required. They are Components, Figures and callbacks.
To start the tool GUIDE, enter guide in the Matlab command window. A Guide Quick Start dialog box will be displayed with default templates. From that you can either create a new GUI or open an existing GUI. If there is no existing GUI then select a Blank GUI and Click OK. In Layout Editor, a GUI is opened. Lay out Editor consists of component palette with components like popup menus, pushbuttons, and static text buttons and so on. Each component can be dragged and placed on the layout area.
Add the push buttons, axes, edit text, static text, popup menu, and slider buttons from the component palette to the lay out area. The Component Axes is used to display graphics in GUI. Arrange the components as shown in Figure 4. Select the components to be aligned and align them by selecting Tools>Align Objects. In order to set the properties of components, select the component, right click on it and select Property Inspector. In GUI, component properties can also be edited in the same manner.
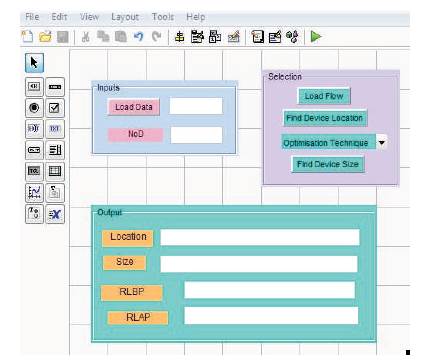
Figure 4. Matlab GUI for Finding Optimal Location and Size
When a component is added to layout then by default its callback property is set to string. For each component, Tag property is used as a name to its callback function. So, it is important to set Tag property with meaningful names. After setting the properties for all the components, Save the GUI. Upon saving, GUIDE generates M-file containing empty sub functions for each component. In order to perform the tasks, programmer needs to write the code for the callback functions of all the components in GUI. An important feature in the M-file generated is handles structure. It stores the handles of menus, controls and axes. It also stores the global data.
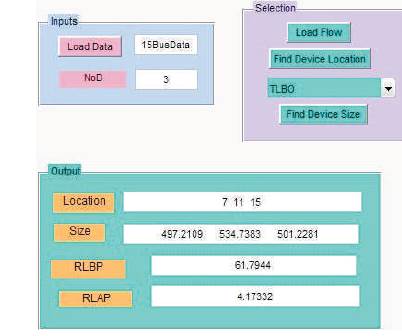
Figure 5. GUI With Displayed Results of Optimal Location and Sizes of DG
As GUI is an user interface, it allows the end user to understand the objective of the problem easily. Also GUI provides the user a familiar environment to work. It also provides the user with an easy interface for giving the input data to the system and for checking the output obtained with the proposed technique. According to the requirement, one can add as many components as possible and the respective functionality in order to achieve the desired result. In this paper, GUI is developed to perform load flow, to obtain optimal DG location using fuzzy and also to attain optimal DG sizes using TLBO.
NoD – Number of Devices (DG's) to be placed
RLBP – Real Loss Before Placement of DG
RLAP – Real Loss After Placement of DG
In this paper, Fuzzy approach is used to find the optimal DG locations. TLBO technique is implemented through Matlab GUI to find the optimal DG capacity for reducing the losses and improving the voltage profile.
For finding the optimal DG sizes using TLBO, the data is learners size=50, maximum iterations = 1000.
Through Matlab GUI, the proposed algorithm TLBO is applied to 15-bus system to find the optimal locations and corresponding sizes of DG. Table 2 gives the information of optimal locations, corresponding sizes of DG, power factor and power loss before and after placing DG. Comparison of voltage profile without and with installation of DG is shown in Figure 6.
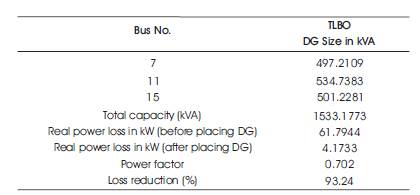
Table 2. Results of 15 Bus System
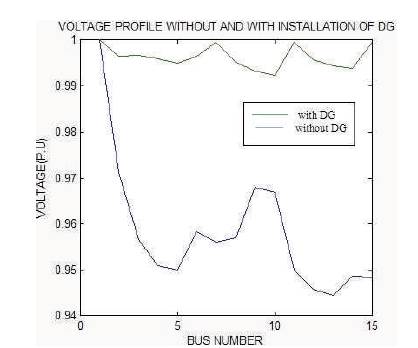
Figure 6. Comparison of Voltage Profile Without and With Installation of DG for 15 Bus System
Through Matlab GUI, the proposed algorithm TLBO is applied to 33-bus system to find the optimal locations and corresponding sizes of DG. Table-3 gives the information of optimal locations, corresponding sizes of DG, power factor and power loss before and after placing DG. Comparison of voltage profile without and with installation of DG is shown in Figure 7.
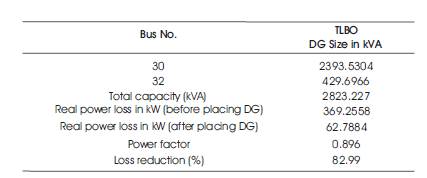
Table 3. Results of 33 Bus System
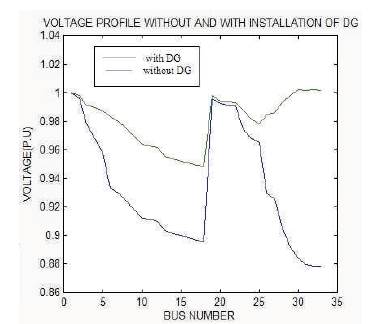
Figure 7. Comparison of Voltage Profile Without and With Installation of DG for 33 Bus System
Through Matlab GUI, the proposed algorithm TLBO is applied to 69-bus system to find the optimal locations and corresponding sizes of DG. Table 4 gives the information of optimal locations, corresponding sizes of DG, power factor and power loss before and after placing DG. Comparison of voltage profile without and with installation of DG is shown in Figure 8.
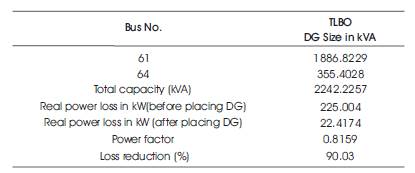
Table 4. Results of 69 Bus System
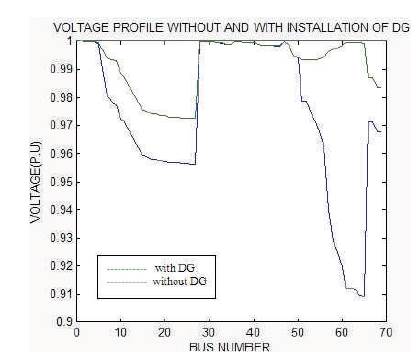
Figure 8. Comparison of Voltage Profile Without and With Installation of DG for 69 Bus System
The results show that there is a large reduction in power loss and great improvement in voltage profile by placing DG using TLBO.
In this paper, GUI is developed in order to obtain optimal DG locations using fuzzy approach and optimal DG sizes using TLBO technique. GUI implementation provides a better understanding to the end user about the objective and results without actually knowing the implementation of the program.
Based on the simulation results, the following conclusions are drawn:
By installing DGs at all suitable locations, it is observed that total real power loss of the system has been reduced significantly and at same time bus voltages are improved substantially.
Compared to other algorithms, TLBO can be easily implemented as it doesn't require any dependency parameter for its operation. It requires less computational effort and memory.