Statistical analytical procedures are usually applied for correlation techniques and in estimation of soil spatial trends. Euclidean cluster, scoter plot, correlation matrix, and inverse distance weight are more favorable statistical properties than traditional procedures. The distribution of soil properties experiment are used to understand engineering characteristics and to conclude suitability for engineering construction initial works. The investigational analysis shows the symptomatic properties of statistical analysis estimations. Three Mandals in Medak district, Telangana state, has been selected to locate appropriate places for civil engineering works. The Mandals are Narsingh Mandal, Shankarampet Mandal, Chegunta Mandal. These three mandals have good agriculture fields so it is difficult to recognize good soil source of geo-technical properties. The assessments are preferred to analyze liquid limit, plastic limit, compaction properties, particle size composition, and proctor compaction. The results of soils are plotted on thematic maps by using inverse distance weight (IDW) and reclassify techniques. These maps are a good example to quickly identify source places. Cluster I and II groups have suitable geo-technical properties of the region, and Cluster III gathers low strength soil samples. Pearson correlation reveals matrix theory to understand reasonable and most suitable parameter in the research region. The liquid limit versus plastic limit R-value is 0.5481 and p-value is <0.5, which indicates a positive correlation. The maximum dry density of plastic limit correlation value R is -0.1395, which indicates a negative correlation and inversely proportional to maximum dry density of the plastic limit.
The spatial executive of suitable constructions site in geotechnical point of view requires the geotechnical characteristics of soil properties. Prior knowledge of spatial geotechnical engineering maps helps to design a resourceful sampling outline by covering each characteristic soil type. The spatial trend is useful to identify and decrease the number of unnecessary soil samples.
The soil has distinct uniqueness depending on geological agents, weathering, erosion, transportation, and deposition. From one to another place soil properties varies. Precise stuffing of soil properties has been used to scrutinize and classify ( Kazemian & Huat, 2010). These data mostly help for geoengineering works by predicting exact soil for construction, the foundation of infrastructure. Index and engineering properties of soils are particle size distribution, consistency limits, specific gravity of soil particles, permeability, compressibility, moisture content, and shear strength. The shear strength of the soil for eternity depends on the wetness substance of the soil ( Terzaghi et al., 1996).
Geo spatial analysis is a non pollute method to achieve relevant information. In remote regions there is no access and it is difficult to do research. Spatial study provide clear path to understand the soil characteristics. These data can be preserved, transferred, calibrated and evaluated for future study and analysis purposes. Remote sensing is a branch widely used in different sectors like Geographic Information System (GIS) computer programming. It downloads all satellite images, captures and scans data, digitalizes process to be analyze, store, and display the required information ( Young & Hammer, 2000).
The digital soil mapping application is rarely used in Telangana and adjacent states. GIS software combined with soil information will help all geotechnical engineers and the construction industry. Any background information can be made available by a single click. Pedology has a subdivision named as digital soil mapping (DSM). Every year 12 papers are published on this DSM and quotations also expand by 384 citations per year. Mathematical interpretation with soil sources is not a new research but producing digital GIS maps is a new concept. It has been released since the 1990s.
There are many scientists, research scholars, and professors investigating on soil maps. Roger Tomlinson prepared soil maps with polygon tool ( Tomlinson, 2007). Best and Westin (1984) and Bie (1975) researched on digitized soil maps by using STATSGO polygon. Mackenzie and Smith (1977) have used digital elevation model and satellite images for preparation of soil maps.
There are few properties that determines the soil for engineering works such as permeability, compressibility, and shear strength. The following points describe the engineering and index properties of soil ( ASTM 2002a; Jumikis, 1965; Phadake & Jain 1998).
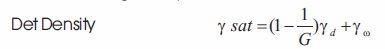
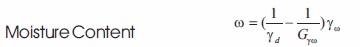
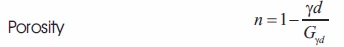
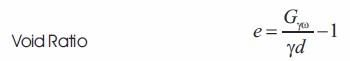
Geotechnical engineering properties are required such as moisture content, dry density, specific gravity, wet density, liquid limit ( ASTM, 2000; BS, 1990), plastic limit, and shrinkage limit ( ASTM, 1998). These are essential for the determination of soil quality for engineering works. These analysis reports and results will help for infrastructure development, the foundation works, earthworks and construction works ( Baecher, 1981).
The diverse catalogue properties of soil and their internal bonding are shown. These bonding will be a benefit for the identification of omitted properties of earthen soils ( Puri & Murari, 1963; Zhang, 2003).
The computer-based programming of GIS software has well-organized tools and these tools input the data from the sources and recovery of selected data for supplementary processes. GIS modules can be analyzed to systematically control the retrieved information to generate sufficient data on the specific outline. GIS components are covered and analyzes the remote sensing data it illustrates. This module covers spatial and non-spatial data in two various databases. Digital coded satellite information explicit object data orientation and association with other objects in two dimensional and three-dimensional spaces. GIS module has two major data such as Vector and Raster. Vector geo-referenced data has three important data interpretation tools such as line, point, and polygon. Raster has pixel information. Discrete feature data usually captured by the vector model and continuous features store the information with the raster model ( Adam et al., 2018; Kumar et al., 2020). GIS module has a great advantage in all types of survey techniques to inbuilt and scrutinize future works. They are total station, GPS, aerial photographic data, remote sensing images data, tabular data, and scanned datasheets ( Cook & Pocock, 1983).
A digital soil mapping (DSM) survey is the best survey for conventional soils. Environmental protection, management, and public authority projects soil as the main product for foundation and construction work. DSM survey reveals the solution with the help of digital soil maps. Geographically referenced maps are collected from the soil data from the spatially explicit environment and field laboratories. These quantitative relationships create a digital soil map.
The DSM process inference on observation of soil-forming factors and landscape segments are captured from aerial photographs and high-resolution satellite images. Scientists and research organizations aid to take these units for the mapping process. The existing soil maps have possibility to show a fraction of the soil landscape. Traditional soil maps consist of large scale regions by analyzing soil samples. Traditional maps only have been possible to observe soils in the landscape regions. In the present scenario, soil data can be stored in soil information systems (SIS) at a major part of soil geo-spatial database. SIS consists of vector data of soil properties, and classification of maps include reports, user manual, attribute data and metadata ( Bulut et al., 2012; Labib & Nashed 2013).
Thematic soil maps have reduced cost, time in the engineering site area and it indirectly protects the environment instead of damage. It includes soil properties, color, strength, and bearing capacity. Geographic Information System (GIS) and proper methodology of index soil properties combines to form a good identity for suitable soil. This study helps to explore the geo-technical properties of soil for good foundation materials ( Mhaske & Choudhury, 2009).
Mhaske and Choudhury (2011) have analyzed 450 samples in Mumbai city for soil index properties. The integrated GIS, Global positioning system (GPS), specific gravity, moisture content, and liquid limit to obtain huge soil database. This analysis will help to find a suitable location for a geo-technical engineering design. Remote sensing soil data and terrain mapping prominence on application of soil databases ( Mulder et al., 2011). Soil liquefaction and non-liquefaction maps with GIS also source for soil spreading maps ( Mhaske & Choudhury, 2010).
Chen et al. (2014) have analyzed soil moisture combined with Normalized Difference Vegetation Index (NDVI) in Australia between 1991 and 2009. They collected satellite images and soil moisture data in different regions ( Minasny & McBratney, 2016). They used statistical methods such as windowed cross-correlation, quantile regression, and piecewise linear regression. Finally, they found a good bonding between soil moisture and NDVI. Enhancement of wet content in the soil helps grow vegetation in dry regions and the initial stage of moisture area ( Rahman & Tahoun, 2019). Soil maps represents the cluster analysis to find different locations.
GIS database to store descriptive soil data, a geographic information system (GIS) to correlate the boreholes data with reference soil ( Denton et al., 2017; Swathi & Rani, 2019). A graphical user interface (GUI) assists the input, query, and output of information, in addition to drawing, bore logs. GIS has an accessible focus on planar/surface applications. Though, to display depth-wise soil characteristics. They build design-build organizations for analysis of the foundation, construction plan, integration between design and construction ( Oloufa et al., 2014).
Soil exploration has been one of the major components in civil engineering constructions. Upcoming civil engineering projects have to execute the number of soil boreholes data with referred scale and plotting on the paper. They preserve data in a standard report which contains location latitudes and longitudes. In every time, taking the coordinates is difficult and some data gets missed and hence permanent geographical spreadsheet in a particular region is very important. In this paper all the gathered soil samples coordinate with location and execute on the spatial spreading maps. These thematic maps contain all specified soil data text values such as liquid limit, plastic limit, sieve analysis, proctor compaction, and specific gravity.
The liquid limit is the water content at which the soils behave as a liquid. Soils changes by water content at the stage of liquid conditions known as liquid limit ( Zhang, 2003). Table 1 tabulates the soil classification and properties. Figure 1 shows the map of liquid limit values. As we see from Table 1 liquid limit is high for Narsingh Mandal soil samples when compared to Shankarampet Mandal and Chegunta Mandal soil samples. The map which is drawn from the values shows the liquid limit of each soil sample from the above mandals. From the map, we can say that the high contrast of the map from the narsingh region is due to the high liquid limit.
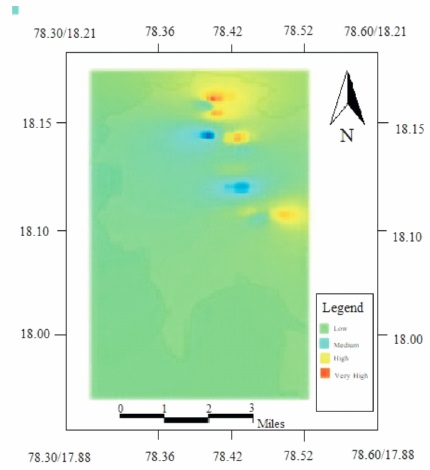
Figure 1. Thematic Map of Liquid Limit Values
Based on such considerations, the algorithm uses a different color image multiplied by the weighting coefficients of different ways to solve the visual distortion, and by embedding the watermark, wavelet coefficients of many ways to enhance the robustness of the watermark.
Clayey soils change their behavior while adding the water. Once the soil starts showing changes by adding water it converts into plastic stage material ( Casagrande, 1932; IS, 2002). The plastic material recognizes once it starts to crumble and is rolled in 3 mm diameter of threads. After that soil loses its plasticity. From the Table 1, we can say that the plastic limit is high in Chegunta Mandal soil samples. A map is drawn with plastic limit values and a high contrast is seen in the chegunta region because of it's high plastic limit.
Soils are naturally mixed sizes of no uniform particles. The numerical appearance of particle sizes distinct the ratio by sieving. 10 percentage of finer particles have effective size once the diameter of the sieve is taken from gradation curves. The coefficient of uniformity values between one and three indicates sand or gravel and it's grade ( Bhattacharyya et al., 1993; Bouyoucos, 1962).
As we see the map, the color contrast for the coefficient of uniformity is high in Chegunta Mandal when compared to the other two mandals. In the coefficient of curvature interpolation map, the blue color contrast is high in Narsingh Mandal, because of fewer values for the coefficient of uniformity.
Different soil types contain various moisture contents. Proctor compaction test provides experimental optimal moisture content in the soil. The high contrast color seen in the map is due to high optimum moisture content values which are obtained from Table 1.
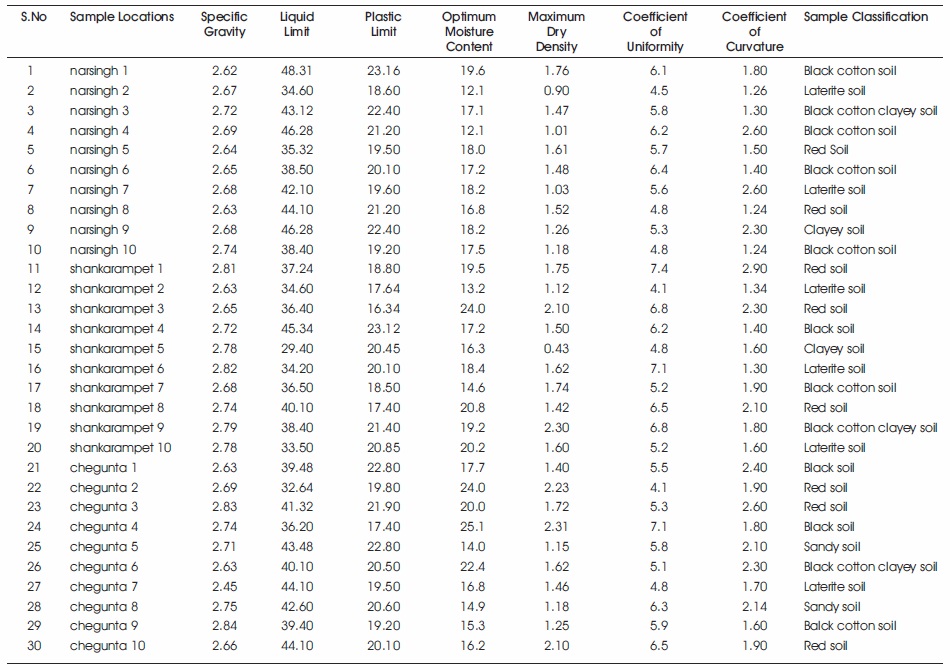
Table 1. Soil Classification and Properties of the Study Area
2.4 Cluster Analysis
Cluster analysis reveals that the Geo-technical properties of soil samples have been classified into 3 clusters, cluster I contain 7 location soil samples, cluster II has 10 soil samples, cluster III represents 9 soil samples. These are indicating the different controlling mechanisms ( Young & Hammer, 2000). Cluster I and II groups have suitable geotechnical properties of the region. These two clusters have covered good soil strength sample location and Cluster III gathers low strength soil samples and the result implies it is not good for construction.
2.5 Scatter Plot
Figure 2, 3, 4, 5 and 6 shows the graphs plotted for plastic limit, coefficient of uniformity, coefficient of curvature, proctor compaction test, specific gravity of soil respectively. Euclidean cluster analysis of soil is shown in Figure 7. These graphs data exhibit direct proportion with each other coefficient of curvature versus liquid limit, plastic limit versus liquid limit, coefficient of uniformity versus specific gravity, maximum dry density versus optimum moisture content, coefficient of uniformity versus maximum dry density, optimum moisture content versus maximum dry density. Liquid limit versus specific gravity, maximum dry density versus plastic limit are both directly proportional in the reverse direction as shown in Figure 8.
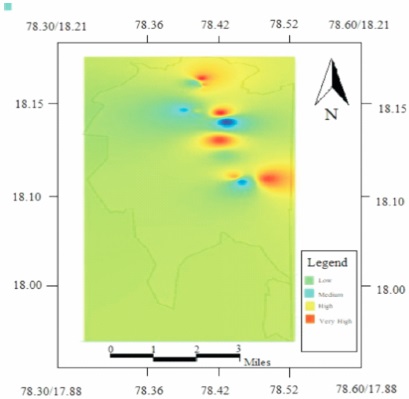
Figure 2. Thematic Soil Map for Plastic Limit Values of Soil Samples
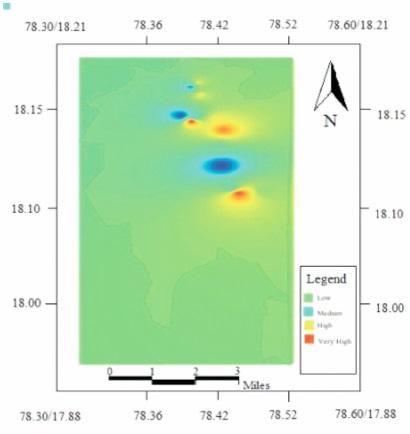
Figure 3. Interpolation Map for the Coefficient of Uniformity
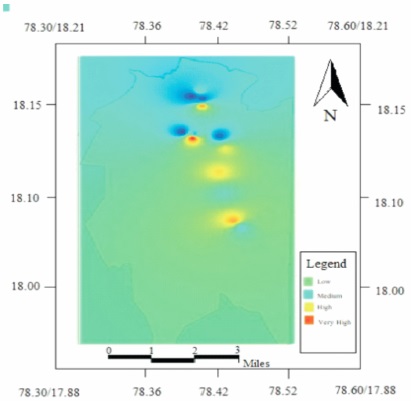
Figure 4. Interpolation Map for Coefficient of Curvature
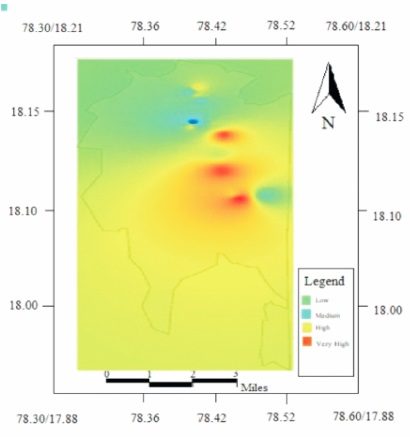
Figure 5. Interpolation Map for Proctor Compaction Test
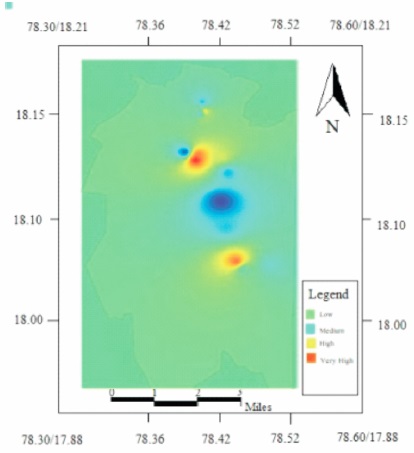
Figure 6. Interpolation Map for Specific Gravity of Soil
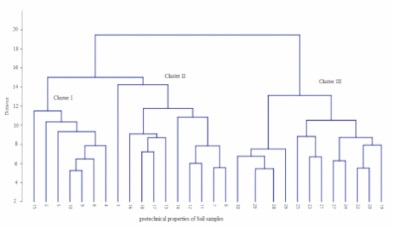
Figure 7. Euclidian Cluster Analysis of Soil Groups
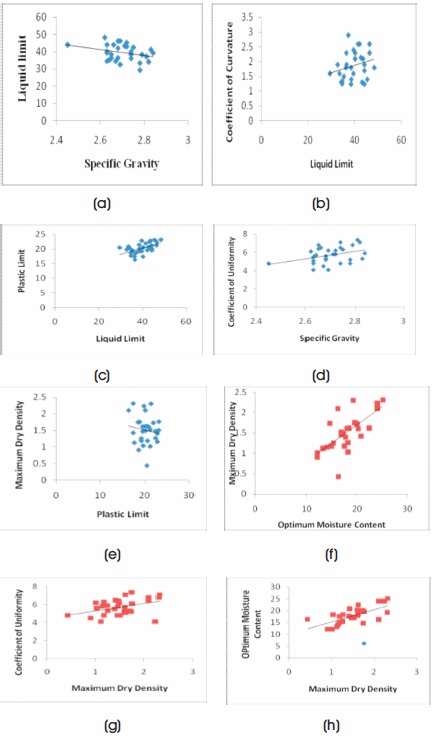
Figure 8. Illustrations of Soil Properties such as (a) Liquid Limit Versus Specific Gravity (b) Coefficient of Curvature Versus Liquid Limit (c) Plastic Limit Versus Liquid Limit (d) Coefficient of Uniformity Versus Specific Gravity (e) Maximum Dry Density Versus Plastic Limit (f) Maximum Dry Density Versus Optimum Moisture Content (g) Coefficient of Uniformity Versus Maximum Dry Density (h) Optimum Moisture Content Versus Maximum Dry Density
The relationship between soil parameters associated with different ratios ( Freedman, 1963) is correlation pearson matrix. Table 2 shows detailed information of matrix of correlation and the high negative value represents liquid limit (-.030768; P<0.05) and the highest positive value is maximum dry density (0.95115; P<0.05). The coefficient of uniformity has a negative value -0.05682 between positive values of maximum dry density. Pearson correlation coefficient between liquid limit versus plastic limit R-value is 0.5481, then p-value is <0.5. It indicates a positive correlation, and the liquid limit values are directly proportion to plastic limit values. The maximum dry density between plastic limit correlation value R is -0.1395, which indicates a negative correlation and is inversely proportional between plastic maximum dry density to plastic limit ( Soulie et al., 1990)
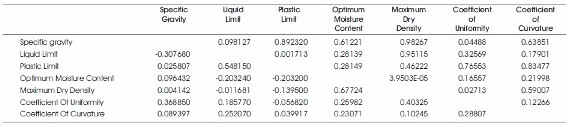
Table 2. Correlation Matrix Soil Samples Concerning Linear r Pearson
The experimental study consisting of the field truth data, statistical and spatial analysis have approached optimal spatial soil variation to find out the good condition of soil for engineering works. In this regard, maps showing the soil properties and layout of the selected area has been prepared. Narsingh Mandal, Shankarampet Mandal, Chegunta Mandal, in Medak district Telangana has been selected and tests were done on soils. Interpolating the data using GIS created soil properties map. Even though if anyone is planning for construction or engineering works they can directly take these maps as a reference. This will save time and also the labor cost. The liquid limit of soil shows Narsingh Mandal has high liquid limit values, which results in high compressibility or high swelling/shrinkage potential. As the moisture content increases, the shear strength of the soil decreases.
By sieve analysis, Narsingh Mandal has a high amount of well-graded soil. Well graded soils are suitable for infrastructure development and engineering works, and this region has been preferred for construction. Optimum moisture content is high for Chegunta Mandal and the compaction of soil during construction can be difficult.
Cluster I and II groups have suitable geotechnical properties of the region. These two clusters have covered good soil strength sample location and Cluster III gathers low strength soil samples and the result implies as not fit for construction. Scatter plots explain correction between two properties of soils such as liquid limit versus specific gravity, maximum dry density versus plastic limit both are directly proportional in the reverse direction.
Pearson correlation reveals matrix theory to understand and attribute most suitable parameter in the research region. The liquid limit versus plastic limit R-value is 0.5481, then p-value is <0.5. It indicates a positive correlation. The maximum dry density between plastic limit and the correlation value R is -0.1395, which indicates a negative correlation and inversely proportional between plastic maximum dry density in plastic limit.