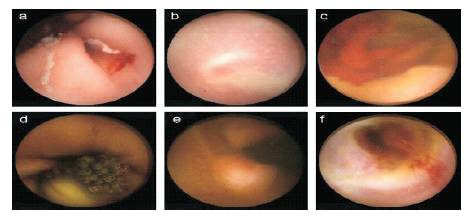
Figure 1. WCE images with various diseases or symptoms : (a) telangiectasia; (b) ulcer; ( c) bleeding; (d) tumor; (e) characinoid and (f) enteritis
Wireless Capsule Endoscopy (WCE) is a transitional endoscopy diagnosing disease in gross area of the Gastro Intestinal (GI) tract ahead the reach of other endoscopy. Cancer is a leading cause of death. As per WHO report 13 million people were affected by cancer disease every year. Bowel cancer is the third most cancer occurring in the GI system. Recent works address various screening methods, and adaptive controls to improve the analysis completion. This paper describes a robust method of segmenting the bowel images, and to discriminate the normal and affected location using Lab VIEW. The system shows that the threshold adjusted (segregation) capsule endoscopic images are emphatic, and sophisticate classification by adequate software used to afford an image as clarion.
Wireless Capsule Endoscopy (WCE) is a modality which involves the combination of three technologies: Complementary Metal Oxide Silicon (CMOS) image sensors, Application Specific Integrated Circuit (ASIC) device, and white Light Emitting Diode (LED) illumination. WCE has received a product mark (CE mark), and approval from US based health department (FDA approval) in August 2001 for use in patients [1]. The capsule has been slowed into the digestive tract to locate the abnormalities as a colour marker on the screen by blood recognition algorithm and localization software to make a video stream of the capsule path. The capture rate for the capsule's image has been calculated as 2 frames per seconds for over 7 hours. Its image acquisition rate is 50000 images, but the complication is the capsules are stuck at strictures or diverticular [2]. The system that capsule visualization time reduction by adaptive control system [3-5], characterizes the intestinal images as polyps [6]. The detection and diagnosis [7] of ulcer, tumors, and blood are identified. These gastrointestinal (GI) images are very challenging for analysis for the physicians, because the images’ trait and abundance is decided by the method elected for the classification and segmentation of that image only. The turbid parts are segmented by colour information, and the bubble images are segmented by textual information using SURF (Speeded-Up Robust Features) detection method [8]. After the detection of defected location, the method has to improve the performance of that process. Since the research work has to contribute for three main reasons such as, 1) to reduce the number of fault intimations, 2) to reduce the evaluation time for video analysis by eliminating the frame rate, 3) to act as an indicator of mobility dysfunction. Segmenting an image is the most important part at the luminance detection on GI. Segmentation is a process of subdividing an image into a number of separations based on its property, the dynamic contour efficiency with the adjustment of threshold variations [9] [10]. Multi scale image analysis has been used successfully in a number of applications to classify image features according to their relative scales. The gradient measurement is performed with the help of watershed segmentation [11], the cancer detection with the influence of watershed morphology [12]. Thus, the classification of segmented image is used to improve the detection of tumor affected areas, and reduce the number of frames. Such a feature selection is based on SVM (Support Vector Machine), Sequential Forward Floating Selection (SFFS), and Recursive Feature Elimination (RFE). These methods are used to improve the detection accuracy, and the feature selection performance filter method, wrapped method, and some embedded methods are preferred to precede the various classifiers to evaluate the images. The choice of a potent method is recycled to minimization generalization error of a classifier [13]. The active bloods intensity adjustment method is done to improve the segmented image quality [14]. The proceedings of tool Lab VIEW are on this image classification of steering video images [15].
Figure 1 shows that various possibilities of diseases are in the gastrointestinal tract, while performing WCE. The distinct parts of the intestinal tract (Stomach, Duodenum, and Jejunum-ileum) resent a variety of appearance with multiple textures and colors. In addition to this, a video frame can be described in three different components of the inner gut: intestinal wall, intestinal content, and intestinallumen.
Figure 1. WCE images with various diseases or symptoms : (a) telangiectasia; (b) ulcer; ( c) bleeding; (d) tumor; (e) characinoid and (f) enteritis
A wide range of computational vision algorithms can also benefit from the existence of reliable and efficient image segmentation technique [16] . For instance, intermediate-level vision problems such as, shape from silhouette, shape from stereo, and object tracking could make use of reliable segmentation of the object of interest from the rest of the scene. Fully automated segmentation techniques are being constantly improved; however, no automated image analysis technique can be applied fully autonomously with guaranteed results in general case. That is why semiautomatic segmentation techniques that allow solving moderate, and hard segmentation tasks by modest effort on the part of the user are becoming more and more popular [17]. Several powerful techniques for interactive image segmentation have been proposed recently based on graph cuts [18], and random walker [19], they seem to significantly outperform earlier methods both by resulting in good segmentation quality, and required user effort.
Methods based on threshold and edge detection work well only if the contrast of the image is excellent. However in most cases, this technique yields broken edges, and poor detection in noisy environments. Watershed techniques [20-21] have also been applied to the problem of cell segmentation. The principles followed in this paper are based on image processing tools such as image enhancements (filter, noise removal and etc.), image segmentation, pattern recognition, vision assistant, and Lab VIEW software. The most important property of this method is accuracy that preserves simplicity, and promptitude. This Figure 2 shows the system architecture of the flow of work.
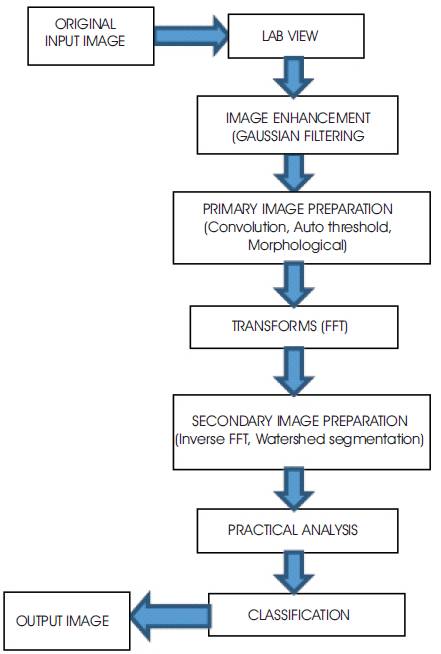
Figure 2. System architecture for segmentation of GI contents
The first step in any vision system is always image acquisition because the direct access of medical image is ambitious, for isolation issues, and less technical hurdles. In this stage, the image acquired from WCE is a noninvasive medical test that helps physicians to dignify, and treats medical conditions. WCE is already an efficient performer to capture the GI images, since this acquisition is also easy to perform with 10,000 images.
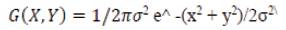
The preprocessing is considered as a process of enhancing the clear view of an image. Gaussian filtering also called as "smoothing", is used to remove noise from a (blur) digital image. Noise is introduced during the A/D process, by side-effect of the physical conversion of patterns of light energy into electrical patterns. When several images have been obtained from digestive tract, there is a possibility to sum the values for each pixel from each frame of the image and the average is calculated, but the process is not possible for video images (moving). The enhancement filtering is the solution of this problem, which attempts to improve the quality of an image for human or machine interpretability. This mode filters each pixel value and is replaced by its most common neighbor. In 2-D, an isotropic (circularly symmetric) Gaussian has the form,
Primary image preparation is the process of preparing an image to valid the scheduled performance of segmentation. Convolution, auto threshold, and morphological approaches are used to achieve these preparations. Convolution decides the size of an image by the kernel size with the array, and auto threshold also improves the image quality with the help of dark and bright object adjustment. Morphological operation is a collection of nonlinear operations related to the shape or features of an image.
Fast Fourier Transform (FFT) is the implementation of the algorithm in converting a 2D image to the frequency domain. Once the image is transformed into the frequency domain, filters can be applied to the image by convolutions. FFT turns the complicated convolution operations into simple multiplications. Fourier Transform decomposes an image into its real and imaginary components which is a representation of the image in the frequency domain. If the input signal is an image, then the number of frequencies in the frequency domain is equal to the number of pixels in the image or spatial domain.
Inverse FFT process performs the operation of converting a frequency domain into a 2D image, and such a converted image is segmented by watershed algorithm. Consider Figure 3 as an input frame of this Lab VIEW experiment.
Later, they reject border, and practical analyzes were also used to achieve with the help of required pixel measurements. Thus, the classification is performed to upgrade an efficient result. Figure 4 shows the block diagram of the proposed work in Lab VIEW software and Figure 5 shows the front panel view of the proposed design, which clearly shows the effectiveness of the algorithm compared to the previous one.
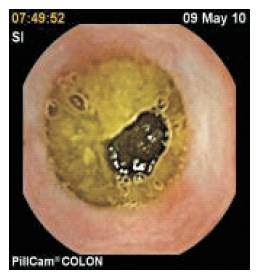
Figure 3. Input Image on Lab VIEW Experiment
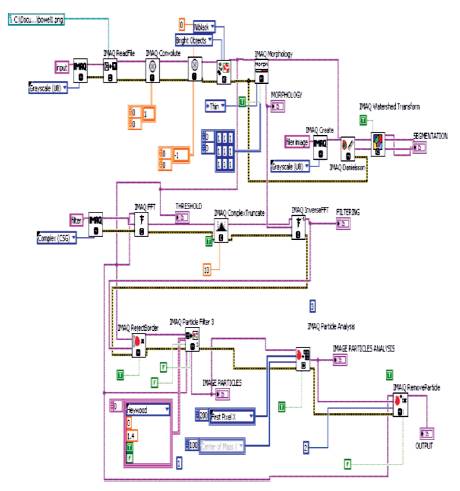
Figure 4. Lab View Block Diagram of the Flow of work
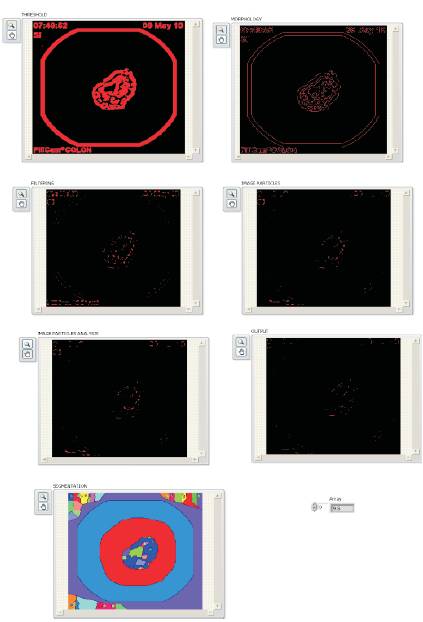
Figure 5. Lab View Front panel view of the Flow of work
In this paper, an efficient endoscopy method for image segmentation, and classification are performed with the affordable computerized VI Lab VIEW. Result shows that, this technique reduces the efforts required for segmenting images compared to graph-based methods like Graph Cuts, Grab Cut. This method combines the features of the mentioned methods, and provides dynamic interaction, and feedback to the user. This streamlined process shows the exact pretentious region by the different colour combinations. Future work would be possible with the various parameter based processes.