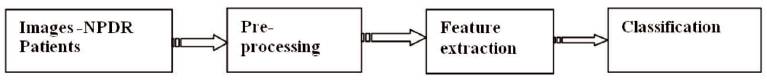
Figure 1. Model Diagram of NPDR – Images Classification Task
Diabetes Mellitus (DM) is a metabolic disorder gets great high impact on human life in recent years. The WHO has estimated that the number of diabetes in the world by 2025 may reach up to 60 million and India's contribution would be 30 million. Recent report says that one fifth of Asian countries, most lives are lost due to non-communicable diseases like cardiovascular disease, Cancer and Diabetes. Preventing the disease of diabetes is an ongoing area of interest to the healthcare community. Long term complications of DM patients' includes; Retinopathy (Disease affecting human eye/ retina), Neuropathy (Neuro-deficit problems/Nerve Damages), Nephropathy (Chronic kidney failure), Gastropathy, Cardiovascular disease (Heart attack), Cerebrovascular disease (Parkinson's disease, Stroke), Foot ulcers and Premature death. Diabetes Retinopathy (DR) is retinopathy, it only affects people who have had diabetes for a long time period and can result in blindness/loss of vision. The sight-threatening stages of DR can be broadly classified as Non-Proliferative Diabetic Retinopathy (NPDR), and Proliferative Diabetic Retinopathy (PDR). This study presents the DR patients' prevention and detecting the retinal images in early stages, can be treated more easily and clinically. A study by Indian Council for Medical Research (ICMR's) INDIAB (India Diabetes) confirmed that one out of 10 people in Tamilnadu are diabetic, and every two adults in a group of 25 are in the pre-diabetic stage. From this study, it is mandatory on clinical research to screen the diabetes patients in the line of retinopathy. MATLAB – classifier predicts the high accuracy level of retinal images classification out of three stages in non- proliferative retinopathy..
In India, Diabetes becomes a potential epidemic with more than 62 million individuals diagnosed [1]. This epidemic is accelerating and continues to be a prevalent problem in India and throughout the world also. DM is a clinical syndrome characterized by chronic hyper glycaemia with disturbances of carbohydrate, fat and protein metabolism. It is caused by an abnormal increase in the glucose level in the blood and which causes the damage to the blood vessels. The tiny blood vessels that nourish the retina are damaged by the increased glucose level. A healthy retina is a complimentary part of every human being’s life to get good vision. A study by Indian Council for Medical Research (ICMR's) INDIAB (India Diabetes) confirmed that the one out of 10 people in Tamilnadu are diabetic, and every two adults in a group of 25 are in the pre-diabetic stage [2]. Type 1 Diabetes (Insulin dependent/Juvenile-onset) is characterized by absolute deficiency of insulin secretion resulting from autoimmune response targeting the β-cells of the pancreas. Nearly about 10% of all diabetes cases are found in type 1. Type 2 Diabetes (Non-insulin dependent/ Adult onset) triggered by a combination of resistance to insulin and insufficient β-cell function. About 90% of all cases are Type 2 of diabetes in worldwide. Obesity, being overweight, being physically-inactive can lead to this disorder.
DR occurs when diabetes damages the tiny blood vessels inside the retina, the light-sensitive tissue at the back of the eye. This tiny blood vessel will leak blood and fluid on the retina, forming features such as micro-aneurysms, hemorrhages, hard exudates, cotton wool spots, or venous loops. The earliest symptom of DR is the Microaneurysms. It is very minor in size and appears red in color in the retina. It is very parallel to the dot hemorrhages. It is also the bodily strength among all of the capillary walls. DR can be broadly classified as NPDR and PDR. Depending on the presence of features on the retina, the stages of DR can be identified. DR is a critical eye disease, which can be regarded as manifestation of diabetes on the retina. The first stage of DR is NPDR which is earliest stage of DR. The damaged blood vessels in retina of eye starts leaking extra fluid and small amount of blood in the eye. Sometimes, deposits of cholesterol are collected or some other fats from blood may leak into the retina. The second stage is PDR which occurs mainly when a number of blood vessels in the retina close, which prevents enough blood flow. Thus it attempts to supply blood to that particular area where original vessels are closed. As a result, new blood vessels grow in the retina. This is called revascularization. If retinal vessels are closed in large number, neo-vascularization can occur in the iris (the colored part of the eye).
The main cause of DR is abnormal increase in blood glucose level, which damages vessel endothelium, thus increasing vessel permeability. The first demonstration of DR is tiny capillary dilations known as Micro-aneurysms, is small growth that forms on the side of the optic disk blood vessels and are caused by increased RBC aggregation and blood viscosity. Clinically, these are similar to retinal hemorrhages due to the similar shape and size. As DR progresses, it causes Neo-vascularization, Macular edema (Retinal thickening within 2 disc diameters of the centre of the macula, results from retinal micro-vascular changes causing leakage of plasma constituents into the surrounding retina), Hemorrhages and Retinal detachment in later. Fundus imaging has significant role in diabetic monitoring since presence of retinal abnormalities are common. Diabetic retinopathy is asymptomatic. A fundus camera is used to capture images of the retina that are then read and graded by doctors. Fundus images are employed by ophthalmologists most of the times for the detection and diagnosis of DR. Hence, it is significant to detect its occurrence in the retina of diabetic patients for early management.
The different stages of Diabetic Retinopathy are NPDR and PDR. Stages of Non-Proliferative Diabetic Retinopathy classified as Mild, Moderate, and Severe.
At least one micro-aneurysm with or without the presence of retinal haemorrhages, hard exudates, cotton wool spots, or venous loops will be present. Approximately 40 per cent of people with diabetes have at least mild signs of DR.
Numerous micro-aneurysms and retinal haemorrhages will be present. Cotton wool spots and a limited amount of venous beading can also be seen. 16 per cent of the patients with moderate NPDR will develop PDR within one year.
This is characterized by any one of the following (4–2–1 rule) characteristics:
Patients with two or more of these features are graded as very severe NPDR.
Proliferative Retinopathy is the advanced stage; the signals sent by the retina for nourishment, trigger the growth of new blood vessels. The common abnormalities found in the human retina are stated as below:
It is a small swelling that forms on the side of tiny blood vessels. These swellings may break and allow blood to leak into nearby tissue. People with diabetes may get micro-aneurysms in the retina of the eye. The earliest visibility of DR is the micro-aneurysms.
Retinal hemorrhage is a disorder of the eye in which bleeding occurs into the retina. These are in various size, shape and texture, hence it may get confused with noise. Retinal hemorrhages that take place outside of the macula if left undetected for many years, and may sometimes only be picked up when the eye is examined in detail by ophthalmoscopy or fundus photography. However, some retinal hemorrhages can cause severe impairment of vision.
These are bright yellow-white deposits on the retina due to leakage of blood from abnormal vessels. In DR progresses, a fluid rich in protein and cellular elements that oozes out of blood vessels due to inflammation and is deposited in nearby tissues. Exudates are manifested as spatially random yellowish or whitish patches of varying sizes, shapes and locations. These are the visible sign of DR and a major cause of visual loss in Non-Proliferative forms of DR. These new blood vessels are abnormal and fragile. They grow along the retina and along the surface of vitreous gel which fills inside the eye. These blood vessels do not cause symptoms or vision loss, but their walls are thin and fragile. It may result in severe vision loss and even blindness, if they leak the blood. About 3 per cent of people in this condition may suffer severe visual loss. Computer-assisted analysis of diabetic patients' retina can help eye care specialist to screen large population of diabetic patients.
In the past years, so many researchers proposed many methods for the automatic analysis of features for analyzing diabetic retinopathy, which are useful for the treatment. But, these methods are only useful in classifying them subjectively. The proposed methods in all researches were not completely reliable and they were robust too as they did not provide any objective measurement of the features. They were mainly useful in analysis of the specific features on the retina, but do not provide a system as a whole for the automatic detection of different stages of DR.
The investigations done so far and algorithms developed are unable to detect early stage of retinopathy (NPDR) accurately. Here, a new classifier technique would analyze retinal images in which possibility of DR detection is achieved accurately. Early screening is a best method and used for the process of identifying every individual who are at sufficiently high risk of a specific problem to warrant further investigation or direct action. Further, a prospective study is required to provide better understanding of the relationship between the undisclosed factors and the increased risk of diabetes retinopathy. This research part will definitely explore the possible insights on DR detection and expand the future visualization scope with emerging big data technologies.
This paper attempts to review and achieve the following objectives:
Undeviating evidence is possible through the screening of diabetes patients and will be beneficial for the following three considerations. 1. Epidemiological considerations 2. Health system considerations and 3. Economic considerations as far as Diabetes Retinopathy are concerned. The burden of diabetes is to a large extent the consequences of macro-vascular (coronary artery disease, peripheral vascular disease, and atherosclerosis) and micro-vascular (like retinopathy, neuropathy, and nephropathy) complications of the disease. Glycated Haemoglobin (HbA1c) levels also predict cardiovascular risk in non- diabetic as well as diabetic individuals. There are lots of literatures cited related with Diabetes Retinopathy detection using data mining techniques. Fleming, et al. [3] have shown the role of micro- aneurysm and hemorrhage in automatic grading of diabetic retinopathy. Due to a large number of patients, the available ophthalmologists are not sufficient in handling all the patients, especially in rural areas. Automated micro-aneur ysms detection can also help the ophthalmologists in investigating and treating the disease more efficiently.
Hipwell, et al. [4] adapted a technique originally developed for fluorescein angiograms, and applied it to micro-aneurysm detection in digitally acquired red-free retinal images. The system was tested on a large sample of previously unseen images designed to mimic a screening scenario. Sensitivity and specificity of 85% and 76% for detection of any retinopathy on a per patient basis was achieved.
Lee, et al. [5] used digitized color retinal images and aimed to detect hemorrhages, micro-aneurysms, exudates and cotton wool spots. They report high levels of agreement between their system and human graders on a lesion by lesion basis, but do not report overall sensitivity and specificity on a per patient basis.
A Recursive Region Growing Segmentation (RRGS) technique was applied to segment vessels, microaneurysms and hemorrhages. The vessels were detected using a neural network method. The remaining objects after vessels had been removed were labeled as microaneurysms and hemorrhages Sinthanayothin, et al. [6]. A Method proposed by Niemeijer, et al. [7] can detect candidate red lesions (micro-aneur ysms and hemorrhages) using a pixel classification technique. Then the detected red lesion candidates were classified using a number of features and a k-nearest neighbor classifier.
Usher, et al. [8] used a neural network approach for feature extraction. Haemorrhages/micro-aneurysms were removed and obtained using recursive region growing and the adaptive intensity thresholding in conjunction with a “moat operator”, edge enhancement image operator. Sensitivity of retinal images was 95.10% and specificity was 46.30% achieved.
Huiqi Li, and Opas Chutatape [9] proposed a modelbased approach for automated feature extraction in fundus images. Goh, et al. [10] has developed a model named ADRIS: an Automatic Diabetic Retinal Image Screening system. Ege, et al. [11] used a median filter to remove noise in the image. Bright lesions and dark lesions are separated by threshold. A region growing algorithm is used to locate exudates. Bayesian, Mahalanobis, and KNearest Neighbor classifier were tested and shown to yield the best results.
Kande, et al. [12, 13] proposed a detection method for micro-aneurysms in early, based on the pixel by classification. Morphological operation was used as a preprocessing step which is used to improve the retinal image for additional processing. Red lesion candidates were identified by using the matched filter and the morphological top-hat transformation method. SVM is used to categorize red lesion areas and non-red lesion areas with 89 retinal images. They selected images randomly from the databases namely, STARE[14], DIARETDB1 [15].
Tang, et al. [16] proposed the frequently used classification technique based on k-NN classifier. Initially splat was produced and for that the features were extracted based on the pixel based approach and splatwise features. The method was trained by using the STARE [14] and MESSIDOR [17] databases.
Zang, et al. [18] proposed a new approach which was based on Multi-Scale Correlation Filtering (MSCF) and dynamic thresholding. It consists of two levels. Microaneurysm candidate detection is called as coarse level and true micro-aneurysm classification is called as fine level. The images were obtained from two public datasets namely, ROC (Retinopathy Online Challenge) [19] and DIARETDB1 [15] database for processing.
Akara Sopharak, et al. [20] proposed a series of experiments on feature selection and exudates classification using Naïve-bayes and Support Vector Machine (SVM) Classifiers. At first, they used naive bayes model to a training set consisting of 15 features extracted from positive and negative examples of exudates pixels. For each combination of features, they carried out a grid search to find the best combination of hyper parameters like tolerance for training error and radial basis function width. Sanchez, et al. [21] proposed a method on Retinal Image Analysis to Detect and Quantify Lesions Associated with Diabetic Retinopathy.
To reveal and ascertain the latest potentials on Machine Learning paradigms in the line of biomedical research, Sabibullah, et al. [22-26] have developed various classification models for the prediction of diabetic patient's risks, heart attack prediction and stroke risk analysis using Soft computing model, Stacked-ANN model, Support Vector Classification models, prediction through Fuzzy Inference System (FIS) and Neural prognostic models, results achieved through different Machine Learning Techniques.
Support Vector Machine (SVM) classifiers have demonstrated excellent performance in a variety of pattern recognition problems. It is a machine learning method as the classification technique for diagnosis of NPDR with high level of performance. It focuses on classification of diabetes disease from high dimensional medical dataset. The SVM searches for a hyper-plane as a decision surface which separates positive and negative examples from each other with the maximum margin. This involves separating hyperplane to be perpendicular to the shortest line, separating the convex hulls of the training data for each class, and locating it midway along this line. A model diagram of NPDR – images classification task is depicted in Figure 1 and overall execution of experiment is shown as a pseudo code, briefed in Section 4.2.
Figure 1. Model Diagram of NPDR – Images Classification Task
Pseudocode is explained along with total number of input and output images used in this experimentation.
Input Images : 1. jpg, 2. jpg, 3. jpg, 4. jpg, 5. jpg, 6. jpg, 7. jpg, 8. jpg, 9. jpg, 10. jpg, 11. jpg, 12. jpg, 13. jpg, 14. jpg, 15. jpg, 16. jpg, 17. jpg and 18. jpg
Output Images: Person has severe DR, Person has most possible DR, Person has possible DR, Person has mild possible DR.
Step 1: Start the process
Step 2: Get the input data (Images).
Step 3:Process the data to find out the stages of DM-R using SVM classifier.
Step 4: Get the output as various retinal image stages.
Step 5: End the process.
It is an essential process to obtain the retina image, which is to be noise free and contrast enhanced. To achieve this, it includes the following steps:
Image formation using sensor and other image acquisition equipment denote the brightness or intensity of the light of an image. Image involving only intensity are called “Grayscale images”. Gray levels represent the interval number of quantization in grayscale image processing. At present, the most commonly used storage method is 8-bit storage. There are 256 gray levels in an 8 bit grayscale image, and the intensity of each pixel can have from 0 to 255, with 0 being black and 255 being white. Another commonly used storage method is 1-bit storage. There are two gray levels, with 0 being black and 1 being white in a binary image, which, is frequently used in medical images, is being referred to as “Binary image”. As binary images are easy to operate, other storage format images are often converted into binary images when they are used for enhancement or edge detection. Figures 2 and 3 show an original retinal image and typical grayscale image respectively.
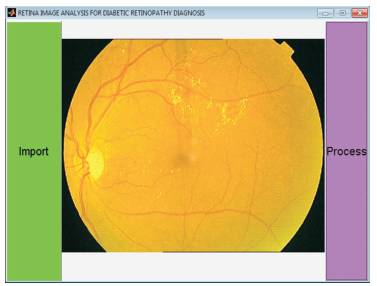
Figure 2. Original Retinal Image
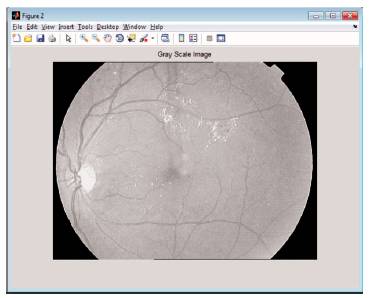
Figure 3. Grayscale Image
The segmentation algorithm relies on a 3-D extension of mathematical morphology, with many application areas in image processing. It includes generation of mappings for each pixel according to the pixel's local neighborhood. Many researchers have used this technique to segment eye images. Segmenting the colon from the eye data set consists of three steps:
Each pixel in the segmented image (Figure 4), ROI is coded in a lossless manner, while the rest is lossly compressed. In Histogram thresholding, histogram obtained for a particular pre-processed image, a threshold point is selected. This threshold value will segment the image in order to obtain the required contour (Region on Interest [ROI] - Figure 5).
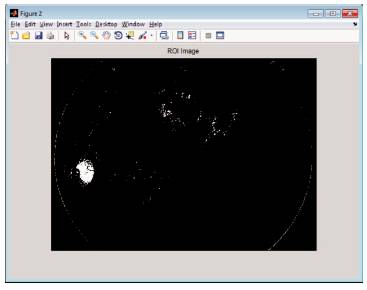
Figure 4. Segmented Image Portion
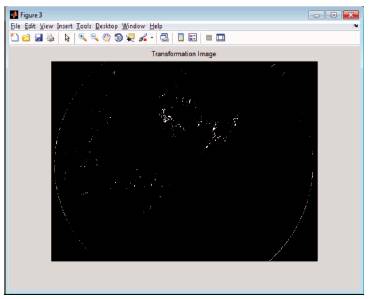
Figure 5. Region on Interest (ROI)
The Hough transformation for detecting circle with unknown radius is time and space consuming because it requires calculating elements in three dimensional parameter space (x, y, r) of radius of circle r in addition to x, y coordinates. The Circular Hough transform detects only the center of the circle with unknown radius on twodimensional parameter space (xc , yc ). The gradient is calculated from the facial image by Sobel filter, and draws a line segment to gradient direction from each edge point in the images. The gradient strength of starting point is voted along the line segment in 2-D parameter space (xc , yc ). Drawing the line segment to gradient direction generates projection of Hough space (xc , yc , r) to its marginal space (xc , yc ). The circle with higher contrast such as iris in white part of the eye contributes more in locating the center by voting the gradient strength of starting point. Figure 6 is an example image of a parameter space of the Circular Hough Transform of the input image.
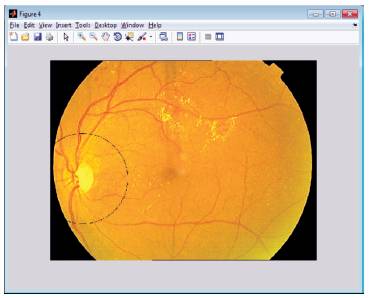
Figure 6. Circular Hough Transformation
It is a process where in various features of the segmented images are executed. Then the formation of feature vectors required to input to the particular classifier is entertained. In order to capture the spatial dependence of grayscale values, a 2-D dependence matrix called a Gray-Level Co-occurrence Matrix (GLCM) is extensively used. The following are the features which are extracted from segmented images.
It corresponds to the mean-squared value of the image typically measured with respect to the global mean value. Energy of an image returns the sum of squared elements in the GLCM.
It is a function that enhances the contrast of an Image. Contrast of an image returns a measure of the intensity contrast between a pixel and its neighbor over the whole image.
It is an operation closely related to convolution. Here, the value of an output pixel is also computed as a weighted sum of neighbouring pixels. The difference is the matrix of weights, called Correlation Kernel. Correlation operation returns a measure of how correlated pixel neighbor over the whole image.
It reflects the uniformity of several pixels in an image and expresses how similar all of them are. Homogeneity of image returns a value that measures the closeness of the distribution of elements in the GLCM to the GLCM diagonal.
It is a feature which measures the randomness of graylevel distribution.
The input retinal images of diabetic patients are presented to the classifing by screening the 18 retinal images (Data set – Table 1) and classifing into four risk predicted stages of result (ie., Person has severe DR, Person has most possible DR, Person has possible DR and Person has mild possible DR). If the image doesn't fall on the detection of these stages, it comes under the stage of “Normal Eye”. The approach is experimented with MATLAB – SVM classifier. The results of the experiment found significant outcomes in the classification of DM-DR images risk level. Classified results with respect to input samples of retinal images are shown in Table 2. Moreover, gender-wise total samples and its classification stage results of images are also depicted in Table 3.
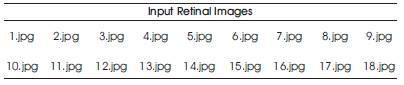
Table 1. Data set – Retinal Images
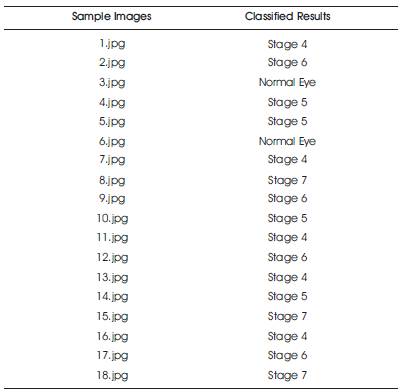
Table 2. Sample Images and Classified Results
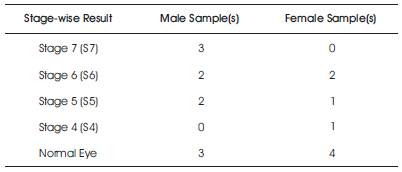
Table 3. Gender-wise Samples and Result Category
The extracted features are fed to the classifier so as to classify the images in the NPDR- stage of diabetes patients.
Total No. of Sample Images: 18
No. of Male Sample Images: 10
No. of Female Sample Images: 08
Figures 7 and 8 show the results of predicted risk of stages (i.e., Stage 6: Person has possible Diabetic Retinopathy and Stage 4: Person has mild possible Diabetic Retinopathy). Simulation screen of MATLAB is also shown in Figure 9.
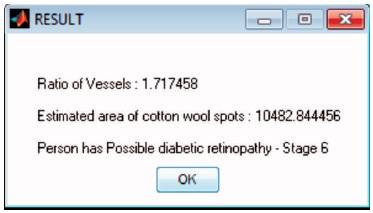
Figure 7. Retinal Image of Eye in Stage 6 (ie., Person has Possible DR)
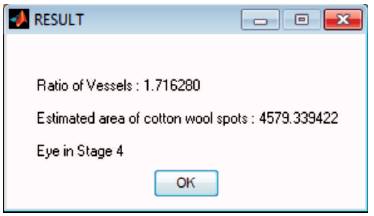
Figure 8. Retinal Image of Eye in Stage 4 (ie., Person has Mild Possible DR)
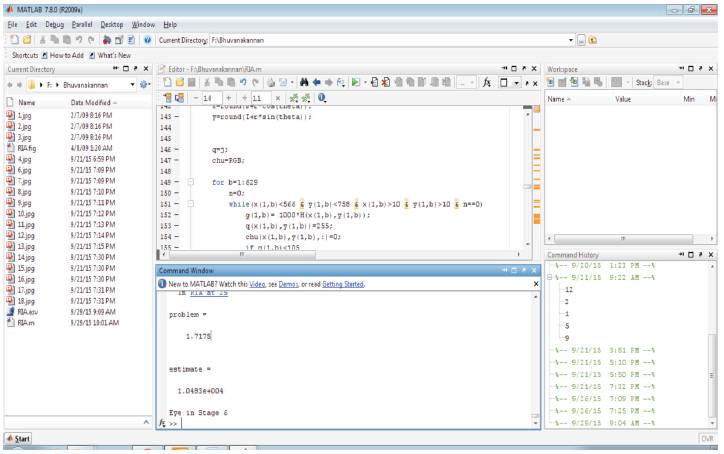
Figure 9. MATLAB Simulation Screen
Technological advancements like Machine Learning – Classification, can provide better access to proper screening and treatment and thereby prevent needless blindness in the line of Health application in DR. This investigation would certainly focus on importance of understanding the motivation behind the diabetes retinopathy - vision system of early intervention, its niceties, and role of classifier and to address these in a large scale, Big Data (Hadoop), a new paradigm having potential to handle with high predictions (contributions).
The classification technique applied in this study for early detection of NPDR only, which has shown the better results and this task would certainly prevent diabetes groups from its early stage of getting eye risk. Since, diabetes is being considered as one of the top priorities in medical science and health care management. This research attempt helps in determining the various stages of NPDR in its early stage and preventing the diabetes patients from getting vision loss.