Table 1. Univariate ANOVAs on Total Discharges, Deaths, Mortality, Code Calls and ICU Admissions by Group (Before RRT and After RRT)
One of the most startling US healthcare statistics is that somewhere between 44,000 and 98,000 hospital in-patient deaths each year are considered to be the result of medical error or oversight and thus, are arguably avoidable mortalities ( Byrne, Delarose, et al. 2007). The purpose of this study was to explore the effects of a Rapid Response Team (RRT) implementation on rates of patient mortality, in-hospital cardiac arrests, ICU admissions, length of patient stay, code calls, and overall cost-effectiveness of a 300 bed, non-metropolitan hospital. The discharge rate was significantly higher post RRT, the mortality rate was significantly lower post RRT, and the number of deaths were significantly lower post RRT. The data also demonstrated that for each unit of RRT implementation, patient stay increased by 0.43 days and an average increase of 23 dollars of hospital cost per patient, per day. The evidence that the RRT implementation and integration had a significant impact on death, mortality rate, and discharge from the hospital is a potential argument in favor of RRT implementation.
This purpose of this study was to explore the effects of a Rapid Response Team (RRT) implementation on rates of patient mortality, in-hospital cardiac arrests, ICU admissions, length of patient stay, code calls and overall cost-effectiveness in a large non-metropolitan hospital serving a predominantly rural population. The goal of this project is to contribute to the much-needed and growing body of evidence demonstrating the long-term impact of RRT on these critical patient and hospital indicators. Despite maintaining one of the costliest systems of health care in the world, the U.S. reports an alarmingly high rate of in-patient deaths ( Aiken, et al., 2002 ; Burns, et al., 2006; Byrne, et al., 2007; Health Grades Quality Study . . .,2007; Sharek, et al. 2007) and the number of patients who are committed to expensive critical care units take a significant toll on expenses as well as increasingly limited hospital resources ( Christensen, et al., 2000; Fourth Annual Patient Safety. . . , 2007 ; Li & Nolan, 2004).
Many of the recent literature on RRTs has been compelling in its implication that these teams can substantially improve patient care and reduce mortality rates ( Dacey, et al., 2007 ; Jones, et al., 2007; Sharek, et al., 2007) while also reducing the staggering high costs associated with critical care services and interventions prior to inpatient mortalities ( Becker, 2005; Duncan, 2005; Jamieson, et al., 2008; Saver, 2006; Thomas, et al., 2007). While some researchers have observed that hospital costs are fixed and thus cannot be reduced through the implementation of RRTs or other improvement innovations, RRTs arguably improve quality, thereby reducing lengths of patient stay that allows for greater bed turnover and therefore the opportunity to produce greater revenue. So although cost savings may not be directly attributable to RRT implementation, improvement on the bottom line associated with significantly improved revenue may be ascribed to the work the RRT performs in the hospital environment ( Ward, 2006, p. 18 ). However, RRT has its detractors who don't so much question the potential improvements RRT may bring to patient care but rather caution that there has not been sufficient empirical evidence to support a wholesale embrace of RRT ( Forster, et al., 2005; Hillman, et al., 2005; McCabe, 2007; Pickoff, 2006). Other researchers have noted in conclusive evidence emerging from the relatively small number of randomized, controlled trials of RRTs ( Aneman & Parr, 2006; Chen, et al., 2008; Saver, 2006). This research was designed to address some of these concerns regarding the statistical significance or validity of findings seen in previous RRT studies through a quantitative and longitudinal assessment of an RRT's impact in a case study acute care environment.
Two general research questions guide the design of this study: The first asks whether a relationship exists between RRT implementation and patient outcome.The second asks whether an RRT implementation impacts hospital costs and patient length of stay. A third question followed on these two in that the research sought to identify whether other factors might also impact patient outcomes. In order to explore the first question, this study examined such factors as code call and severity rates, patient turnover, and mortality rates. In an effort to address concerns that have appeared elsewhere in the literature ( DeVita, et al., 2006 ; Jones & Bellomo, 2006; Merryman, 2005) regarding previous RRT studies, this research intended to capture RRT impact over a long period of time between July 2003 and June 2008, five years, worth of data encompassing both pre-and post-intervention statistics. For these 60 months of data collection, approximately 45% or 27 months- worth of the statistics represented the pre-RRT intervention condition and the remaining 55% of the data covered the 33-month period following the RRT's implementation in October 2005. Data on monthly hospital costs were also collected and assessed in terms of pre- and post-intervention effects.
Three research questions were posed in this study:
To examine question 1, a multivariate analysis of variance•
(MANOVA) was conducted to assess if mean differences exist on patient outcomes (discharges, deaths, mortality rate, number of code calls and ICU admissions) by group (implementation of RRT: September 2005 and before vs. October 2005 and after). The assumption of normality was assessed through the conduction of ten Kolmogorov Smirnov (KS) tests.
To examine question 2, two linear regressions were conducted to assess whether or not the establishment of RRT impacted annual patient length of stay and annual hospital cost. In preliminary analysis, the assumptions of normality, linearity and homoscedasticity were evaluated through examination of the residual scatter plot. Outliers were removed prior to analysis. The assumption of normality was assessed with the KS test. The scores were not normally distributed; However, when the degrees of freedom are greater than 25, violation of the assumption has little consequence ( Leech, Barrett, & Morgan, 2005).
To examine question 3, for the RRT participants, five multiple regressions were conducted to assess which of the reasons (nurse worry, change in respiration, change in blood pressure, change in heart rate, change in O2 saturation, change in LOC) predict patient outcome (discharges, deaths, mortality rate, number of code calls and ICU admissions). One multiple regression was conducted for each of the patient outcomes: discharges, deaths, mortality rate, number of code calls and number of ICU admissions. The assumptions of linearity and homoscedasticity as well as the absence of multicollinearity, were met. There were no outliers in the data set.
(Research Question 1) The results of the KS test were significant; total discharges before implementation of RRT and for the number of code calls and admissions to ICU after implementation of RRT, where scores were not normally distributed. However, According to (Stevens, 2002), data that is not normally distributed has only a slight affect on the rate of Type I errors. The F statistic is robust with regard to normality assumptions, even when distributions are highly skewed. The Levene's test was not significant for all the dependent variables and homogeneity of variance could be assumed. The Pillai's Trace statistic was used for interpretation.
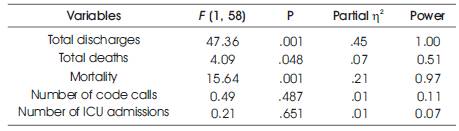
The results of the MANOVA were significant, F (5, 45) = 10.39, p< .001, suggesting simultaneous differences exist among the dependent variables between groups (the months prior to RRT implementation vs. the months after RRT implementation). Table 1 presents the univariate ANOVAs where significant differences are revealed on the number of total discharges, total deaths and mortality rate.
Table 1. Univariate ANOVAs on Total Discharges, Deaths, Mortality, Code Calls and ICU Admissions by Group (Before RRT and After RRT)
The means and standard deviations for these variables before and after the implementation of the RRT are presented in Table 2. As indicated, for total discharges, the after RRT implementation mean number is statistically greater than the mean number before RRT implementation (M = 843.56, SD = 92.69). For the total number of deaths, the after RRT implementation mean number is statistically smaller (M = 15.42, SD = 4.72) than the mean number before RRT implementation (M = 18.11, SD = 5.58). For mortality rate, the after RRT implementation mean number is statistically smaller (M = 1.58, SD = 0.46) than the mean number before RRT implementation (M = 2.17, SD = 0.69). Differences were not found on the number of code calls and the admissions to ICU.
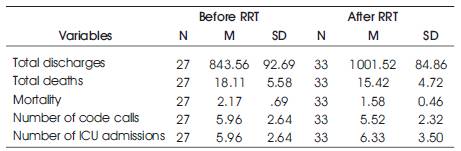
Table 2. Means and Standard Deviations on Total Discharges, Deaths, Mortality, Code Calls and ICU Admissions by Group (Before RRT and After RRT)
The first regression investigated whether the establishment of RRT impacted annual patient length of stay. The results of the regression were significant, F (1, 58) = 362.32, p< .001, R2 = .862, suggesting that the establishment of RRT predicts annual patient length of stay. The results for the regression are also summarized in table 3 and suggest that for every one unit increase in establishment of RRT (from 1=no to 2 = yes), annual patient length of stay will increase by 0.43 units. Therefore with the establishment of RRT, annual patient length of stay increased by .43 days.
The second regression investigated whether the establishment of RRT impacted annual hospital cost. The results of the regression were significant, F (1, 58) = 72.58, p< .001, R2 = .556, suggesting that the establishment of RRT predicts annual hospital cost. The results for this regression are also summarized in Table 3 and suggest that for every one unit increase in establishment of RRT (from 1=no to 2 = yes), annual hospital cost will increase by 22.97 units. Therefore, with the establishment of RRT, annual hospital costs increased by nearly 23 dollars. The cost per patient day is adjusted yearly for inflation.
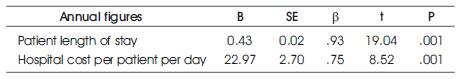
Table 3. Linear Regressions with Establishment of RRT Predicting Annual Patient Length of Stay and Annual Hospital Cost
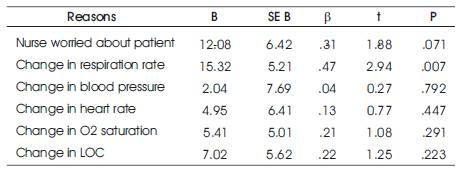
Table 4. Multiple Regression on Reasons (ICU Admission, Nurse Worry, Change in Respiration, Change in Blood Pressure, Change in Heart Rate, Change in O2 Saturation, Change in LOC) Predicting Number of Discharges
The results of reasons (nurse worry, change in respiration, change in blood pressure, change in heart rate, change in O2 saturation, and change in LOC) predicting the number of discharges were significant, F (6, 26) = 4.22, p = .004, indicating that the model of six predictors was effective in predicting the number of discharges, R2 = .493. Of the reasons why the number of discharges can vary, the predictors accounted for 49% of those reasons. Table 4 presents the beta coefficients, where a significant finding was found; for every one unit increase in the number for respiration rate (meaning the number of times the change in respiration rate was recorded) the number of discharges increased by 15.32. Of all the variables in this model, change in respiration rate was the only significant predictor of the number of discharges.
The results of the reasons (nurse worry, change in respiration, change in blood pressure, change in heart rate, change in O2 saturation, and change in LOC) predicting the number of deaths were not significant, F (6, 26) = 0.874, p = .528, indicating that the model of six predictors was not effective in predicting the number of deaths, R2 = .168. Of the reasons why the number of deaths can vary, the predictors accounted for 16.8% of those reasons. Table 5 presents the beta coefficients, where the findings show that none of the predictors were significant predictors of the number of deaths.
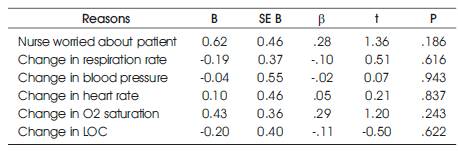
Table 5. Multiple Regression on Reasons (ICU Admission, Nurse Worry, Change in Respiration, Change in Blood Pressure, Change in Heart Rate, Change in O2 Saturation, Change in LOC) Predicting Number of Deaths
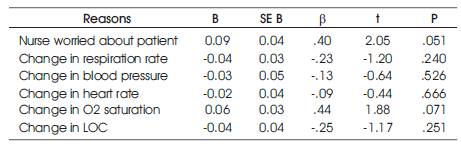
Table 6. Multiple Regression on Reasons (ICU Admission, Nurse Worry, Change in Respiration, Change in Blood Pressure, Change in Heart Rate, Change in O2 Saturation, Change in LOC) Predicting Mortality Rate
The results of the reasons (nurse worry, change in respiration, change in blood pressure, change in heart rate, change in O2 saturation, and change in LOC) predicting the mortality rate were not significant, F (6, 26) = 1.460, p = .231, indicating that the model of six predictors was not effective in predicting the mortality rate, R2 = .252. Of the reasons why the mortality rate can vary, the predictors accounted for 25.2% of those reasons. Table 6 presents the beta coefficients, where the findings show that none of the predictors were significant predictors of mortality rate.
The results of the reasons (nurse worry, change in respiration, change in blood pressure, change in heart rate, change in O2 saturation, and change in LOC) predicting the number of code calls were not significant, F (6, 26) = 0.683, p = .665, indicating that the model of six predictors was not effective in predicting number of code calls, R2 = .136. Of the reasons why the number of code calls can vary, the predictors accounted for 13.6% of those reasons. Table 7 presents the beta coefficients, where the findings show that none of the predictors were significant predictors of number of code calls.
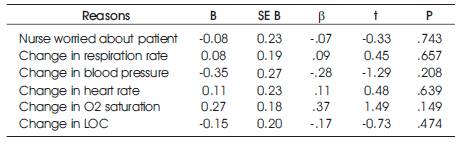
Table 7. Multiple Regression on Reasons (ICU Admission, Nurse Worry, Change in Respiration, Change in Blood Pressure, Change in Heart Rate, Change in O2 Saturation, Change in LOC) Predicting Number of Code Calls
The results of the reasons (nurse worry, change in respiration, change in blood pressure, change in heart rate, change in O2 saturation, and change in LOC) predicting the number of ICU admissions were not significant, F (6, 26) = 2.46 p = .051, indicating that the model of six predictors was not effective in predicting number of code calls, R2 = .362. Of the reasons why the number of code calls can vary, the predictors accounted for 36.2% of those reasons. Table 8 presents the beta coefficients, where the findings show that none of the predictors were significant predictors of number of ICU admissions.
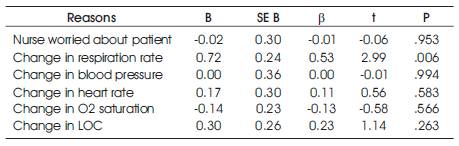
Table 8. Multiple Regression on Reasons (ICU Admission, Nurse Worry, Change in Respiration, Change in Blood Pressure, Change in Heart Rate, Change in O2 Saturation, Change in LOC) Predicting Number of ICU admissions
The data from monthly information collected for the period July 2003 through June 2008, which included pre-RRT and post RRT aggregate datawere used to determine whether RRTs are effective in addressing the problem of preventable patient mortality and injury. This study's results were significant demonstrating simultaneous differences among patient outcomes(discharges, deaths, mortality rate) by group (before RRT vs after RRT implementation). The discharge mean number was statistically greater after RRT implementation vs before. The deaths mean number and mortality rate were statistically smaller after RRT implementation vs before. The study also revealed that RRT implementation impacted the hospital's length of stay and annual hospital cost, showing an increase of 0.43 days and 23 days respectfully. The only significant predictor of the number of discharges was the change in respiratory rate.
The problem of preventable patient mortality and injury continue to plague the American health care system. The question then becomes whether RRTs are effective in addressing the problem.
The patient discharge rate was significantly higher for the patients served in the post-RRT hospital condition than for those seen during the pre-RRT intervention period. The mortality rate after RRT implementation was statistically smaller and the number of patient deaths was significantly lower post-RRT intervention. However, the data analysis did not produce significant evidence of RRT impact on the number of code calls or the number of admissions to ICU; these figures remained essentially consistent for both the pre-RRT and post-RRT periods at the hospital. Substantial reductions in mortality rates associated with RRTs have been reported in a number of recent studies ( Aneman & Parr, 2006 ; Dahlen & Benz, 2006; Jones, et al., 2007; Sharek, et al., 2007 ). However, as with ( Hillman, et al.'s 2005) study, there was no compelling evidence that RRT implementation had an impact on ICU admission rates or on cardiac code calls ( see also, Jones & Bellomo, 2006). Other studies have similarly suggested that RRTs decrease the number of code calls (Building rapid response teams, n.d.; Harraden & Rutherford, 2004; Jamieson, et al., 2008 ;Pursuing perfection. . . , n.d.; Walker, 2005).
The data demonstrated that for each patient episode of RRT implementation, patient stay increased by 0.43 days and at an average increase of $23 dollars of hospital cost per patient, per day. These were both statistically significant findings and run counter to much of the evidence that has been reported in prior studies of RRT intervention. This study indicates that RRT implementation impacted patient's length of stay and hospital costs, however not in the direction that has been typically seen in RRT intervention research.
The third research question considers the potential effect of other factors, other than RRT intervention, that might impact patient outcomes. Greater effect was identified for change in O2 saturation, change in LOC, and change in respiration and these, along with change in blood pressure and change in heart rate were considered along with the variable of nurse worry in an effort to gauge these factors impact on the salient patient outcomes.
Of these various factors, change in respiration had a significant effect on rates of discharge on increase in respiration as a predictor of the number of discharges (for every unit increase in respiration change, the number of discharges increased). While the change of respiration reason predicted the patient outcome of discharge, it did not predict outcomes on any other indicator (deaths, mortality rate, number of code calls, and ICU admissions). Additionally, none of the other reasons considered (nurse worry, change in blood pressure, change in heart rate, change in O2 saturation, or change in LOC) had any significant impact on any of the patient outcomes.
While there has been a wealth of promising research indicating the benefits of RRT implementation in acute care facilities, the field of study has been dogged by challenges that there has not been sufficient empirical evidence produced on which to definitively claim that RRTs represent a comprehensive enhancement of hospital care, improving patient outcomes. This study sought to identify other factors and physiological parameters that might impact patient outcome beyond RRT intervention and to achieve all analyses through a quantitative design that is replicable and would facilitate future testing of its findings.
This findings regards RRTs impact on hospital costs are somewhat provocative, given the nature of the RRT discussion and the findings that have previously been reported in other implementation studies. ( Ward, 2006) objected to the argument that RRTs can result in cost reductions for hospitals, noting that virtually all hospital costs are fixed. He employed the example of the ICU nurse who must be paid, regardless of whether or not patients are occupying ICU beds and noted that the objective therefore, is not so much cost-reduction as it is revenueincrease. Ward proposed that RRTs might well realize revenue increases for hospitals by producing higher rates of discharge and reducing the average length of stay, thereby allowing hospitals to increase the number of patients they serve. The findings of this study suggest one facet of Ward's construction was realized through the RRT implementation in that the number of patient discharges increased. However, the data also was significant in establishing that average length of patient stay actually increased by 0.43, producing a net increase cost of $23 per patient/per day over pre-RRT implementation patient costs.
This finding conflicts with various reports of cost-savings associated with RRT implementation in some of the literature. ( Jamieson, et al. 2008) reported a $600,000 cost saving over two-and-a-half years for one hospital that had implemented an RRT. The finding that the RRT tracked with an actual increase of 0.43 days suggests a trend for this hospital in the opposite direction. Taken separately, these findings may appear significant but without a greater context for consideration, considering whether hospital admission increase in relation to RRT implementation and whether admissions generate revenue that offsets costs. What does seem clear from the evidence gathered over the five-year period of study is that the RRT had a meaningful and positive impact in reducing patient deaths and lowering the hospital's mortality rate while also increasing the number of patient discharges, as compared to the pre-RRT intervention condition. It is critical, in this day and age when health care reform and health expenditures are at the forefront of virtually all domestic political, economic, and social policy considerations, to take into account the cost effectiveness of enhancement measures employed in acute care and other health institutions. However, the evidence that the RRT implementation and integration had a significant impact on such essential patient outcomes as death, mortality rate and discharge from hospital is a potent argument in favor of RRT implementation. If the first goal of the hospital is to save any patient who can be saved and to discharge the patient back into his or her life, then the RRT would appear to have substantially enhanced the facility's ability to meet that goal.