The present work investigates the corrosion behaviour of SS 304 and SS 316L used for beverage containers, boat propellers, and bio-implants. Electrochemical Impedance Spectroscopy and Potentiodynamic Polarization Measurement test were performed to determine the corrosion behaviour of substrates at room temperature. X-Ray Diffraction (XRD) and Scanning Electron Microscopy (SEM) analysis were used to investigate the characterization and morphology of the substrates. The electrochemical study showed that the order of corrosion resistance of 304 SS and 316L in different electrolytes was Ringer solution > Wine > Beer > 3.5% NaCl solution and Ringer solution > Beer > Wine > 3.5% NaCl, respectively. After electrochemical corrosion testing, substrates were examined by XRD and SEM to reveal their crystallite size and pits quantity.
Stainless steel is one of the most widely used materials in food, paper and chemical industries. It is also used for manufacturing medical devices, heat exchangers, drilling rigs for oil extraction, household's items and also due to its low cost, availability, ease of fabrication and welding as compared to other materials. The world consumption of stainless steel increases 6% per annum. Containers made of stainless steel are preferably used for alcoholic fermentation in comparison to plastics and wood because of ease of cleaning, comparative chemical inertness that prevents addition of flavours or contaminants and enhanced control of the fermentation process (Alar et al., 2016). Stainless steel 304 and 316L are the most suitable candidates for various marine applications like work boat propellers, pump components, valves, shaft components, hull fittings, fasteners, and oceanographic instruments due to their excellent corrosion resistance, especially for pitting and crevice corrosion (Kumar et al., 2015). In present days, stainless steel, titanium and its alloys and some other materials were put into use as a bio-implant material to improve the life quality of millions of people. Austenitic stainless steel, especially 316L and 304 stainless steels possess reasonable corrosion resistance, tensile strength, fatigue resistance, and suitable density for load bearing purposes thus making this material a preferable one for biomedical applications. In chloride environment, corrosion resistance originates from a chromium rich oxide layer, which works as a barrier against ion diffusion between the alloy and the ambient phase (Avstenitnih, 2014). The passive film stability and the corrosion resistance of stainless steel increases with increasing chrome content in the alloy (Kumar et al., 2014). Stainless steel also has addition of nickel, molybdenum, and manganese to enhance or improve corrosion resistance. Stainless steel is normally used in industries where both the properties of steel such as strength and resistance to corrosion are required.
Corrosion remains as one of the most severe limitations for the use of various steels in marine environment, food and medical device manufacturing industries. Corrosion is known commonly known as rust, an undesirable phenomena which destroys the luster and beauty of objects and shortens their life. There are different forms of corrosion, such as intergranular, pitting, sulphide stress cracking, chloride stress cracking, and stress corrosion cracking (Iliyasu et al., 2012). Corrosion rate is dependent on both corrosion potential and concentration of ions present (Ningshen et al., 2011). Corrosion cannot be avoided, but it can be controlled and prevented by using suitable methods like cathodic protection, metallic coating, alloying and using inhibitors, etc., (Kumar et al., 2015).
The passivity of stainless steels is based on the presence of a thin chromium oxide film on the surface, which decreases the electrochemical reaction on the metal and protects it from corrosion attack. The passive film has a thickness of 1-3 nm on stainless steel. Chromium content higher than 13 wt% promoted the formation of a passive layer of chromium oxide/hydroxide on the surface that reduces the corrosion rate of stainless steel in aqueous media (Farias & Lins, 2011). The passive film formed on stainless steel exhibits a duplex structure consisting of an inner chromium-rich oxide layer in contact with substrate and an outer iron-rich oxide and hydroxide at the film-electrolyte interface (Zheng et al., 2014). Other elements present in the passive film are nickel, found in the inner layer of the passive film, and molybdenum found in the outer layer. The dissolution of surface oxide film also due to low concentration of dissolved oxygen, inorganic ions, proteins, and cells can accelerate the metal ion release (Singh et al., 2014).
Many authors have tried to describe the literature review concerned with corrosion behaviour of different stainless steels grades used for diverse applications.
Alar et al. (2016) investigated the corrosion behavior of SS 304, SS 316, and SS 316 Ti in White Wine, Red Wine and Beer. The cyclic potentiodynamic polarization method and gravemetric method was used to determine the corrosion rate of the samples. The surface morphology of the SS was observed with SEM. The result revealed that the largest loss of mass was exhibited by sample AISI 304, after it was exposed to beer. The strongest deviation in terms of roughness was measured in sample AISI 316, after it was exposed to red wine. The highest susceptibility towards pitting corrosion is exhibited by the steel in the AISI 316Ti sample, after it was exposed to beer. SEM results show the dissolution of metallic ions from the surface.
Avstenitnih (2014) investigated and compared the corrosion resistance of austenitic AISI 316L SS in seawater and in pure 3.5% NaCl using Potentiodynamic measurements and EIS. The measurements of the potentiodynamic tests compares four potentiodynamic curves, which represent four different immersion times: two in 3.5% NaCl and two in real seawater (after 1 hour of stabilization at the open-circuit potential in the solution and after 100 hour in the solution). The results obtained that a slight decrease in the chromium oxide content close to the oxide/solution interface at 100 hours exposure in sea water. The EIS show that long-time exposure of the stainless steel AISI 316L differ significantly and should be considered when testing with "artificial" seawater. These differences in the electrochemistry measurement results are probably due to bio-fouling on the surface.
Kumar et al. (2015) examined the corrosion behavior of SS 316L in presence of Sodium hydroxide, Hank's solution, Ringer solution, and seawater. The electrochemical potentiodynamic polarization method was used to investigate the corrosion behavior of samples. The result revealed that the Linear Polar Resistance (LPR) values are increasing and ICorr values are decreasing from 5% hydroxide solution to ringer solution. The order of corrosion resistance of SS 316L in different medium was Ringer solution > seawater > Hank's solution > sodium hydroxide.
Farias and Lins (2011) investigated the corrosion resistance of stainless steel as well as unalloyed and alloyed carbon-manganese steels like (T11, T22, AISI 444, 1020, L80 13Cr, L80 T1, A 423) in neutral and acid sugar cane juice electrolytes. The corrosion resistance is evaluated by using autoclaving tests, Tafel analysis, linear polarization technique, and Electro chemical Impedance Spectroscopy (EIS). The results of linear polarization, tafel analysis and EIS tests proved that in acid sugarcane juice, T11 steel exhibited the highest corrosion resistance among the alloyed carbon steels and the result of autoclave testing at pH 7 indicated the good corrosion behaviour among the alloyed carbon steels for T22 followed by A423 and T22 steel.
Iliyasu et al. (2012) investigated the susceptibility and resistance of type 304 austenitic stainless steel exposed to sulphuric acids (H2SO4) with different concentrations (0.3M to 1M) at ambient temperatures (30 oC) and at higher temperatures (40 oC, 50 oC, 60 oC, 70 oC, and 80 oC). Weight loss method was used to examine the corrosion rate of the steel after immersion in the corrosive media. The Constant Extension Rate Tensile Test (CERT) was also performed with a tensometer to determine the susceptibility of the steel to stress corrosion cracking in the corrosive media after exposing for seven days and the percentage reduction in area of each test piece was recorded. The Stress Corrosion Cracking (SSC) behaviour of type 304 austenitic stainless steel expressed both the elongation percentage and reduction cross section decreased with increased exposure time and increased concentration. It is observed that the susceptibility of 304 SS to stress corrosion cracking in the corrosive media and its high resistance to uniform corrosion of below 0.1mm/yr.
Lins et al. (2016) investigated the corrosion resistance of SS 304 and SS 444 used in the food industry using sanitizing electrolytes: calcium hypochlorite and divosan (aqueous solution of 0.25% v/v peracetic acid, 0.25% v/v acetic acid, 0.25% v/v hydrogen peroxide) employed in the Clean-in-Place (CIP) procedure, and using electrochemical techniques such as potentiodynamic anodic polarization and electrochemical impedance spectroscopy. The results revealed that the austenitic AISI 304 steel showed the highest corrosion resistance than SS 444 in sanitizing electrolytes used in the Clean-in-Place (CIP) process of the food industry due to higher contents of nitrogen and nickel in SS 304.
Lv et al. (2015) investigated the atmospheric corrosion behaviour and mechanism of 304 stainless steel subjected to a simulated marine atmosphere (0.5% NaCl), including the initiation and development of pits, the composition evolution of corrosion products, and the protective ability of corrosion products and the protective ability of corrosion product. The methods used to performed corrosion behaviour were potentiodynamic polarization and EIS. The pits morphologies were observed using SEM and elemental composition of corroded specimen was analyze by EDX. The result reveals that the pit depth of corrosion products formed on specimen's surface increased with time. Morphology result shows the small pits formed on the surface and EDX indicates the composition of corrosion products around the pit was alloy elements, such as Fe, Cr, Ni, and Mn and in the pit includes S with alloy element.
Kumar et al. (2014) studied the corrosion resistance of austenitic stainless grade 316 in one mole hydrochloric acid solution. The electrochemical potentiostatic polarization method was used to perform the corrosion behaviour of 316 SS samples. The electrochemical behaviour of type 316 austenitic stainless steel in acidic solution depends considerably on the concentration of hydrochloric acid environment. The presence of acid concentration produces enhancement of metal corrosion through the passive layer, and decreases the passivity breakdown potential. The more active corrosion reactions in presence of chloride ion result in pitting corrosion observed on the metal surface.
Ningshen et al. (2011) investigated the corrosion behaviour of AISI type 304L SS in different concentrations of nitric acid media (0.01 M, 1 M, and 5 M) in the presence of oxidizing ions at different temperatures (room temperature, 50 oC and 70 oC). The potentiodynamic polarization and electrochemical impedance spectroscopy measurement were conducted to investigate the corrosion behaviour of 304L SS specimens. Laser Raman Spectroscopy (LSR) measurement were performed to study the passive film concentration on samples developed with passive film formed by potential sweep in the anodic direction to passive region and by holding potentiostatically at passive region for 1 h. The LRS result revealed the presence of NO3-, CrO4-, and Cr2O72- in passive film in addition to Cr2O3 and Fe2O3. The presence of these oxidized species accelerated the corrosion processes. The potentiodynamic anodic polarization results revealed no significant change in corrosion potential even with increase in temperature and nitric acid concentration in presence of oxidizing ions because any effect on corrosion potential due to generation of large amount of oxidizing nitrate ions is swamped by ions. The metal surface dissolution was observed with increase in temperature and at higher concentrations. The passive film stability is measured by EIS revealed faster passive film dissolution as indicated by low film polarization resistance, with increase in nitric acid concentration and temperature.
Singh et al. (2013) have conducted potentiodynamic polarization tests to investigate the electrochemical corrosion behavior of the uncoated, HA, HA + 10 wt% SiO2 and HA + 20 wt% SiO2 plasma coated AISI 304 specimens in Ringer solution. The electrochemical study showed the corrosion resistance of the AISI 304 increased after deposition of plasma sprayed HA + 20 wt% SiO2 compared to uncoated, plasma sprayed HA + 10 wt% SiO2 and HA coatings on AISI 304. The coatings were characterized by XRD and SEM / Energy Dispersive X-ray Spectroscopy (EDS). The results suggest that with increase in the percentage of SiO2 in coating, corrosion resistance of coated samples increase. The XRD analysis of the samples revealed that after corrosion testing, crystalline size of HA and HA-SiO2 coatings increase and SEM micrographs showed that HA coating retains its morphology, where as morphology of HA-SiO2 coating changes to flattened particles of irregular shape and take a form of small grain boundaries, which make the coating less porous and more corrosion resistant.
Singh et al. (2014) studied the effect of contents of Calcium Phosphate (CaP) on corrosion behaviour of hydroxyapatite (HA) coatings in simulated body fluid (Ringer's solution). Three types of coatings, i.e., HA + 20 wt% CaP (type 1), HA + 10 wt% CaP (type 2), HA (type 3), were laid on 316L SS using plasma-spraying technique. Electrochemical potentiodynamic tests were conducted to determine the corrosion resistance of uncoated and coated samples. The characterization techniques XRD, SEM, and EDX were used to investigate the crystalline size, microstructure, and morphology samples. The electrochemical study showed that the deposition of plasma sprayed type 3 coating on 316L SS increases the corrosion resistance compared to uncoated, type 1 and type 2 plasma-sprayed coating on 316L SS in Ringer's solution. The SEM micrographs showed that HA coating retains its morphology, whereas the morphology of HA + 20 wt% CaP and HA + 10 wt% CaP coatings changes to flattened particles before and after corrosion testing in Ringer's solution and XRD analysis showed plasmasprayed type 2 and 3 coatings are more crystalline than type 1 coating on 316L SS.
Zheng et al. (2014) investigated the fine microstructure of the passive films on Nano Crystalline (NC) and Coarse Crystalline (CC) 304 stainless steels in 0.5 M H2SO4. The passive film formed on SS exhibits a duplex structure consisting of an inner chromium-rich oxide layer in contact with the metallic substrate, and an outer layer of iron-rich oxide and hydroxide at the film–electrolyte interface, with a total film thickness of a few nanometers. The potentiodynamic polarization curves, EIS, X-ray Photoelectron Spectroscopy (XPS), were and AFM used for investigation. The potentiodynamic polarization showed that the NC sample has more positive ECorr and ICorr than CC SS, indicating that the stability of the passive film, and subsequently the corrosion resistance of 304 SS in 0.5 M H2SO4 solution, is increased after nanocrystallization by Equal Channel Angular Pressing (ECAP). XPS results reveal that the passive films formed on both CC and NC 304 SSs in 0.5 M H2SO4 solution has similar composition and microstructure.
AISI 304 stainless steel with chemical composition (in wt% – C: 0.089; Cr: 19.4; Ni: 8.85; Mo:0.3; Si: 0.36; Mn: 1.26; P: 0.035; S: 0.019; and Fe: balance) and 316L SS with chemical composition (in wt% – C: 0.013; Cr: 17.4; Ni: 10.8; Mo: 2.18; Si: 0.55; Mn: 0.76; P: 0 025; Cu: 0.22; and Fe: balance) were used as substrates. The specimen (15 x 15 x 3 mm3) was prepared from strips of 304 SS and 316L SS. Before immersion in electrolyte the specimens were embedded in epoxy resin, leaving an exposed area of 1 cm2. The specimen were ground to 1000 grit silicon carbide emery and cleaned with acetone and then rinsed in distilled water to abrade surface and achieve uniform surface finishing. The SS 304 and SS 316L has 8.03 and 7.87 gm/cm3 density (ρ) and an equivalent weight (EW) of 24.36 and 25.01 gm/equivalent, respectively.
The simulated human body fluid, simulated sea water, wine and beer were used as electrolytes. Ringer solution's (Nice Chemical Pvt. Ltd. Cochin, India) with chemical composition (in g/L) as 9 NaCl, 0.24 CaCl2, 0.43 KCl, and 0.2 NaHCO3 at pH 7.2 was used as the electrolyte for simulating human body fluid conditions. NaCl in distilled water at pH 7.2 was used as simulated seawater. Wine (Good Drop Wine Cellars Pvt. Ltd. Maharashtra, India) and Beer (United Breweries Ltd. Punjab, India) has pH values 3.2 and 4, respectively.
The electrochemical corrosion behaviour of 304 SS and 316L SS were analysed at the Potentiostat/Galvanostat (Series G-750; Gamry instruments, Inc. USA), controlled by a personal computer at ambient temperature (23-25 oC) and atmospheric pressure (~1 atm). The instrument was supported with Gamry framework for the collection of the data and Echem Analyst was used for the analysis of data. Copper wire was used for providing electrical connection for the working of electrode. The reference electrode was a saturated calomel electrode (SCE, 0.242 V vs. SHE) and the counter electrode was graphite rod. Every specimen was stabilized by immersion in different electrolytes for 24 hours before conducting corrosion studies. Each experiment was performed in triplicate and fresh electrolyte and sample was used every time. There are two methods used in this work to determine the corrosion behaviour of specimens.
EIS technique measure and control the potential difference between a non-current carrying reference electrode and one of the two current carrying electrodes (working electrode). EIS experiments were performed using a Potentiostatic EIS technique at open circuit potential with AC amplitude of 5 mV over a frequency range of 100 KHz to 0.01 Hz. The EIS parameters such as Electrolyte Resistance (Rs), Polarization Resistance (Rp), and Constant Phase Element (CPE) that represent the behaviour of Double Layer Capacitance (Cdl), were obtained from the impedance spectra (Nyquist & Bode Plot) by using equivalent electrical circuit. CPE was used to obtain better fit (minimum ± error) and will characterize the generalized form of passive film Cdl. The impedance appearance of CPE is given by (Lins et al., 2016).
where w is the angular frequency (ω = 2πf), where f is the frequency in Hz, j2 = -1, 'Q' and 'n' are frequency independent fit parameters. The value of n is 0 ≤ n ≤ 1. When n = 1, then CPE is equivalent to pure capacitor (Q = C) and when n = 0 then CPE represents a pure resistor (Ningshen et al., 2011).
Potentiodynamic polarization tests were conducted to investigate the corrosion mechanism. Corrosion parameters, such as anodic tafel slope (βa), cathodic tafel slope (βc), corrosion potential (ECorr), and corrosion current density (ICorr) were obtained from the potentiodynamic curves by using tafel extrapolation technique. The potentiodynamic polarization curves were initiated at -250 mV to +250 mV relative to open circuit potential. The experiments were carried out at the scan rate 5 mV/s and polarization experiment was continuous till the breakdown of transpassive potential occurred. All electrode potential were considered against reference electrode (SCE). The corrosion rate (CR) was calculated by using the Equation,
The phase structure was investigated using Rigaku X-ray diffractometer, with Cobalt target (λ = 0.179 nm) and iron filter operating at 30 mA and under a voltage of 40 kV. The specimens were scanned over 2θ range of 20o - 50o with scanning speed 2o /min record the intensities. The Scherrer's equation was used to calculate the crystallite size from XRD data (Singh et al., 2013).
Where, T is the average crystallite size in nm, λ is the X-ray wavelength in nm, b is the line broadening in radian, θ is the Bragg angle in degree, and K is the constant that represent shape factor (K = 0.89 for spherical, 0.94 for cubic, and 0.9 for unknown size particles).
The surface morphology of the exposed samples was analysed using Scanning Electron Microscopy (SEM) (JEOL JSM-6610LV) with magnification range 40 KX. The micrographs were to identify the pits and micro-cracks after 24 hours immersion in different electrolytes.
The Nyquist plots of 304 SS in Ringer solution, Wine, Beer, and 3.5% NaCl solution are shown in Figure 1.
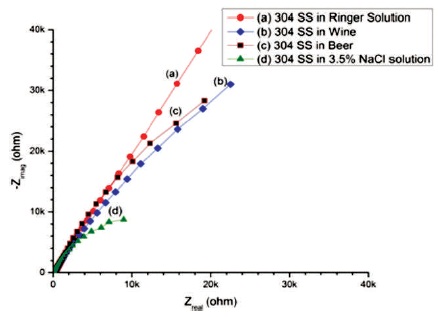
Figure 1. Nyquist Plots of 304 SS in (a) Ringer Solution (b) Wine (c) Beer (d) 3.5% NaCl Solution
In the Figure, the semi-circle starts near the origin at high frequency region and shows a value of Rs at intersecting point on real axis. The other intersecting point on real axis away from the origin at low frequency region represents sum of Rs and Rp. The rise of semi-circle to Y-axis shows the capacitive behaviour. The result were interpreted using an equivalent circuit Rs(Rp ǀǀ CPE). All measured parameters are given in Table 1.
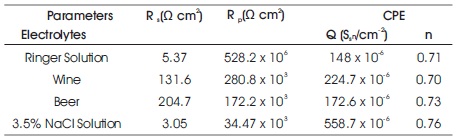
Table 1. Fitting Results of EIS Parameters for 304 SS
The results shows that polarization resistance (Rp = 528.2 x 10⁶Ω cm2) of 304 SS immersed in Ringer solution is higher than 304 SS in other electrolytes and represented by larger the diameter of unfinished semi-circle as shown in Figure 1(a). The increase in the semi-circle arc indicated an increase in the film stability on the specimen and decrease in the semi-circle diameter indicates decrease in the passive film resistance (Ningshen et al., 2011).
The decreasing arc of 304 SS in Wine than 304 SS in Ringer solution shown in Figure 1(b), is characterized by a formation of weak protective passivating layer, which indicates less corrosion resistance. The unfinished semicircle of 304 SS in Beer with polarization resistance (Rp= 172.2 x 10³Ωcm2) suggest that 304 SS in Beer is low corrosion resistance than Wine (Alar et al., 2016). The 3 2 polarization resistance (Rp = 34.47 x 10³Ωcm2) of 304 SS in 3.5% NaCl solution is lower than the Rp of 304 SS immersed in the other three electrolytes, which is represented by small and depressed semi-circle as shown in Figure 1(d). The depressed semi-circle is either due to the presence of pores on the surface of working electrode. The order of corrosion resistant of SS 304 in different electrolytes is Ringer solution > Wine > Beer > 3.5% NaCl solution.
Bode plot represent the three parameters, which are needed to characterize the impedance. Those three parameters are magnitude 'ǀZǀ', phase angle ‘Ø ', and frequency 'f'. In Bode plot, curves have three frequency regions, such as low, high, and intermediate regions.
In Figures 2(a), (b), (c), and (d), bode spectra are presented for different electrolytes, such as Ringer solution, Wine, Beer, and 3.5% NaCl, respectively. These consists of two curves on one graph, solid lines represent the impedance modulus and dash lines represent the phase angle.
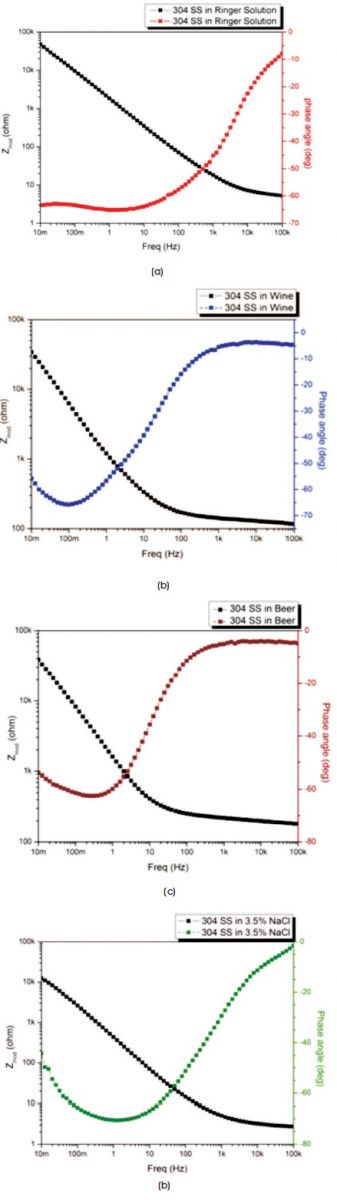
Figure 2. Bode Plots of 304 SS in (a) Ringer Solution (b) Wine (c) Beer (d) 3.5% NaCl Solution
In all figures, the progress of impedance modulus vs. frequency reveals a area of stability at high frequency region and phase angle close to 0 , which shows that circuit behaves as a resistor and illustrate the values of Rs shown in Table 1. At intermediate frequency region, capacitive behaviour of the circuit exist, so impedance curves dependent on the frequency and phase angle approaches to -90o. At low frequency region, area stability of the impedance curve confirm the Rs + Rp value, which shows that the circuit behaves as a resistor and phase angle approaches to 0o, but this frequency independent region of curve is exterior from the plots.
Figure 3 shows the potentiodynamic scan of 304 SS samples after 24 hours immersed in four different electrolytes, such as Ringer solution, Wine, Beer, and 3.5% NaCl solution.
All measured parameters of the potentiodynamic polarization measurement are given in Table 2. The results show that the corrosion current density of SS 304 specimen immersed in Ringer solution (ICorr = 0.20 μA and ECorr = -255 mV) is lower than SS 304 specimen immersed in other three electrolytes. So the polarization curve of 304 SS in Ringer solution is shifted towards left in comparison to other three electrolytes
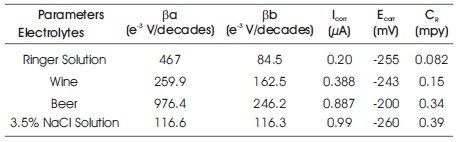
Table 2. Corrosion Parameters of 304 SS in (a) Ringer Solution (b) Wine (c) Beer (d) 3.5% NaCl Solution
These shift comparison clearly is shown in Figure 3 by curve (a). The polarization curve (d) of 304 SS in 3.5% NaCl solution shifted toward right in comparison to others as shown in Figure 3 shows the lower affinity of corrosion than others.
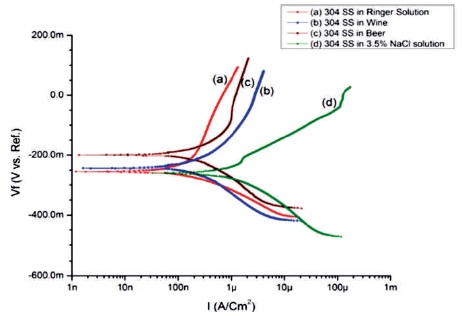
Figure 3. Potentiodynamic Curves of 304 SS Specimens in (a) Ringer Solution (b) Wine (c) Beer (d) 3.5% NaCl Solution
The polarization curves (b) of 304 SS in Wine shifted toward right than curve (a) indicate that 304 SS in Wine is low corrosion resistant than in Ringer solution. And the polarization curve © shifted toward left of curve (d) signify that 304 SS in Beer is more corrosion resistant than 304 SS in 3.5% NaCl solution, but lower than 304 SS in Wine and Ringer solution.
In addition, SS 304 in 3.5% NaCl solutions exhibit a higher corrosion rate (0.39 mpy). While Ringer solution exhibit a lower corrosion rate of (0.082 mpy). It is found that 304 SS reveals to enhance the corrosion resistance in Ringer solution than the Wine, Beer, and 3.5% NaCl solution. The order of corrosion resistant of SS 304 in different electrolytes is Ringer solution > Wine > Beer > 3.5% NaCl solution.
The XRD scan of 304 SS after immersing in Ringer solution for 24 hours to corrosion testing, indicate the crystallite structure as shown in Figure 4(a). According to Scherrer formula, crystallite size was 367.78 nm. Higher crystalline lead to longer life of stainless steel in Ringer solution (Singh et al., 2013) and signify the best corrosion resistant behaviour. While 304 SS remain amorphous after immersing in Wine, Beer and 3.5% NaCl solution and exhibits a broad with Full Width Half Maximum (FWHM) more than 5o as shown in Figure 4(b), (c), and (d), respectively.
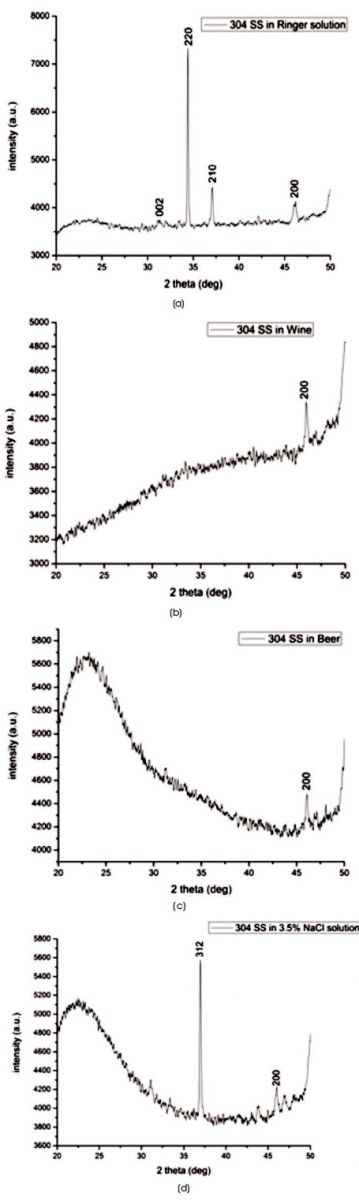
Figure 4. XRD Profile of 304 SS After Corrosion Testing in (a) Wine (b) Beer (c) 3.5% NaCl Solution
The surface morphology of 304 SS sample shows a tiny stain in Figure 5(a) during immersion in Ringer solution, which suggest that 304 SS has high corrosion resistant in Ringer solution. The small cracks on the surface of 304 SS were observed after immersion in Wine in Figure 5(b), where as the surface of 304 SS had formation of both cracks and pits after immersion in Beer in Figure 5(c) that advised the decline in corrosion resistance. The 304 SS subjected to simulated marine atmosphere has large volume of pits as shown in Figure 5(d) suggest for low corrosion resistant. The pit initiation due to dissolution of Manganese Sulphide (MnS) is present in 304 SS subjected to simulated marine atmosphere (Lv et al., 2015).
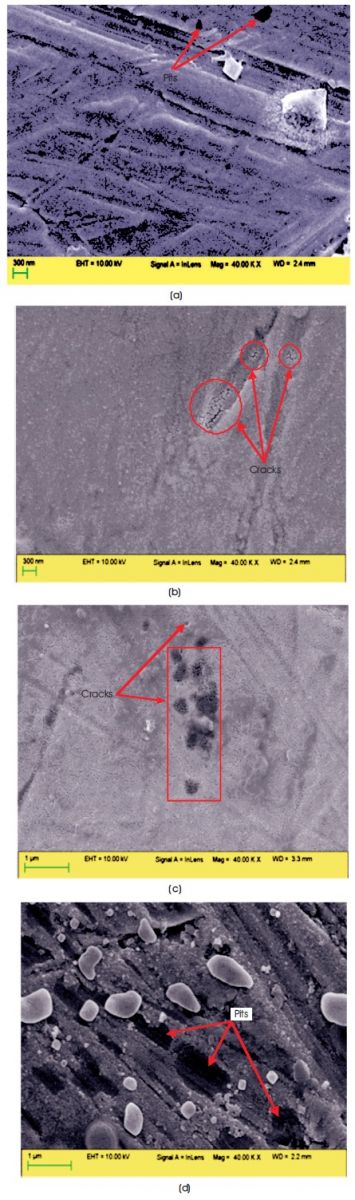
Figure 5. SEM Images of 304 SS samples After Corrosion Testing in (a) Ringer Solution (b) Wine (c) Beer (d) 3.5% NaCl Solution
The Nyquist plots of 316L SS in (a) Ringer solution, (b) Wine, (c) Beer, and (d) 3.5% NaCl solution are as shown in Figure 6. All measured parameters are given in Table 3.
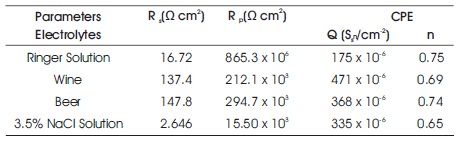
Table 3. Fitting Results of EIS Parameters for 316L SS
The results show that polarization resistance (Rp = 865.3 x 10⁶ Ω cm2) of 316L SS immersed in Ringer solution is higher than 316L SS in other electrolytes and larger the diameter of unfinished semi-circle as shown in Figure 6(a), which mean 316L SS in Ringer solution is more corrosion resistant than all others. The decreasing arc of 316L SS in Beer than in Ringer solution indicates the less corrosion resistant than in Ringer solution. The semi-circle arc of 316L SS in Wine is shifted toward down as compared to 316L SS in Ringer solution and Beer as shown in Figure 6(b) signify the lower corrosion resistant behaviour of 316L SS in Wine than Beer and Ringer solution. The depressed semi-circle of 316L SS in 3.5% NaCl solution as shown in Figure 6(d) is observed by localized corrosion attack on the surface of the specimen. The order of corrosion resistant of SS 316L in different electrolytes was Ringer solution > Beer > Wine > 3.5% NaCl solution.
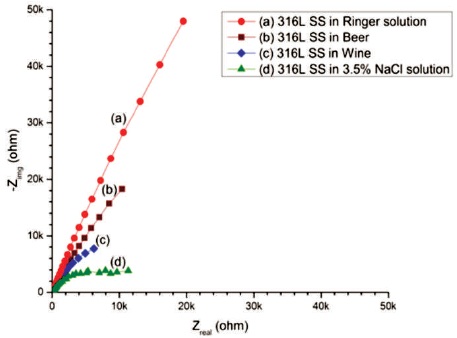
Figure 6. Nyquist Plots of 316L SS in (a) Ringer solution (b) Wine (c) Beer (d) 3.5% NaCl Solution
The Bode spectra of 316L SS after immersed in four different electrolytes, such as (a) Ringer solution, (b) Wine, (c) Beer, and (d) 3.5% NaCl solution are presented in Figure 7.
In Figures 7(a), (b), (c), and (d), the progress of impedance modulus vs. frequency reveals that area of stability at high frequency region and phase angle approach to 0o, which shows circuit behaves as a resistor and illustrate the values of Rs which is shown in Table 3. At intermediate frequency region due to capacitive component phase shift act and phase angle approaches to -90o and impedance varies with the inverse of the frequency and reach to high impedance as shown in all figures. The lift of solid curve at low frequency region in Figure 7(a) suggests for high impedance of 316L SS in Ringer solution.
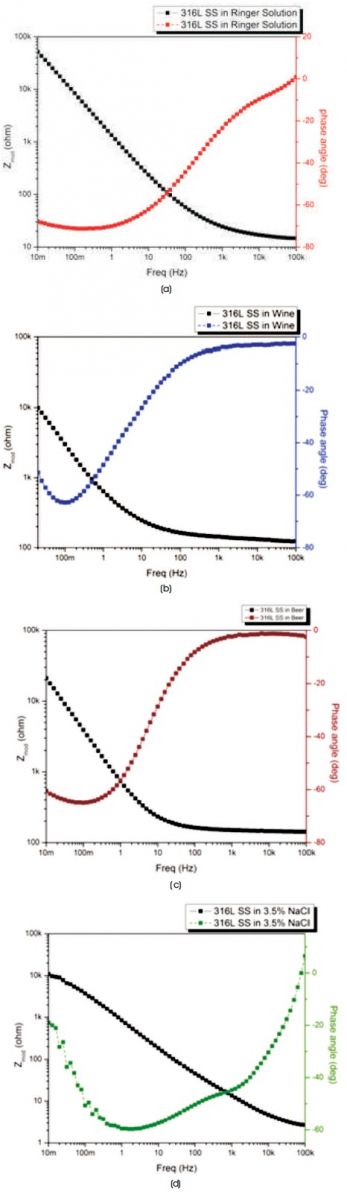
Figure 7. Bode Plots of 316L SS in (a) Ringer solution (b) Wine (c) Beer (d) 3.5% NaCl Solution
Figure 8 shows the potentiodynamic scan of 316L SS samples after 24 hours immersed in different electrolytes, such as Ringer solution, Wine, Beer, and 3.5% NaCl solution. The measured parameters of the potentiodynamic polarization measurement are given in Table 4.
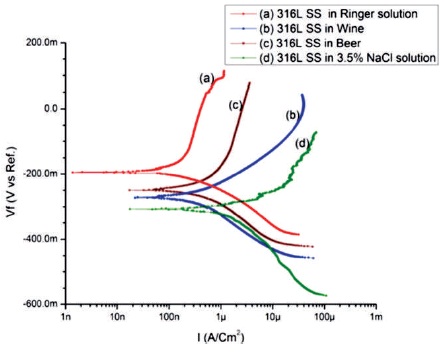
Figure 8. Potentiodynamic Curves of 316L SS Specimens in (a) Ringer solution (b) Wine (c) Beer (d) 3.5% NaCl Solution
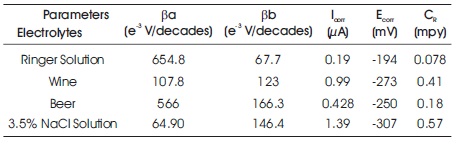
Table 4. Corrosion Parameters of 316L SS Specimens in (a) Ringer Solution (b) Wine (c) Beer (d) 3.5% NaCl Solution
The results show that the corrosion current density of SS 316L specimen immersed in Ringer solution (ICorr= 0.19 μA and ECorr = -194 mV) is lower than SS 316L specimen immersed in other three electrolytes. The polarization curve (a) of 316L SS in Ringer solution is shifted toward left in comparison to other three electrolytes as shown in Figure 8. The corrosion current density of SS 316L specimen immersed in 3.5% NaCl solution (ICorr = 1.39 μA and ECorr = - 307 mV) is higher than the SS 316L immersed in other three electrolytes with polarization curve (d) shifted toward right in comparison to others as shown in Figure 8, which shows the lower similarity of corrosion than others. The polarization curve (b) of 316L SS shifted toward left than curve (d) indicates the higher corrosion resistant in Wine than 3.5% NaCl solutions. And the polarization curve (c) shifted toward left than the curve (b) and (d) and toward right than curve (a) as shown in Figure 8, designate that in Beer, 316L SS is more corrosion resistant than in Wine and 3.5% NaCl solution but less than in Ringer solution.
In addition, 316L SS in Ringer solution exhibit a lower corrosion rate (0.078 mpy). While in 3.5% NaCl solution exhibit a higher corrosion rate (0.57 mpy). It is found that 316L SS disclose to improve the corrosion resistance in Ringer solution than the Beer, Wine, and 3.5% NaCl solution. The order of corrosion resistant of SS 316L in different electrolytes was Ringer solution > Beer > Wine > 3.5% NaCl solution.
The XRD scan of 316L SS after immersing in Ringer solution and Beer for 24 hours for corrosion testing signifies the crystallite structure as shown in Figures 9(a) and (b) with average crystallite size as 1653.84 nm and 64.83 nm, respectively, which signify the higher corrosion resistance of 316L SS in Ringer solution. While 316L SS remain amorphous after immersing in Wine and 3.5% NaCl solution and exhibit a broad with FWHM more than 5o as shown in Figure 9(c) and (d).
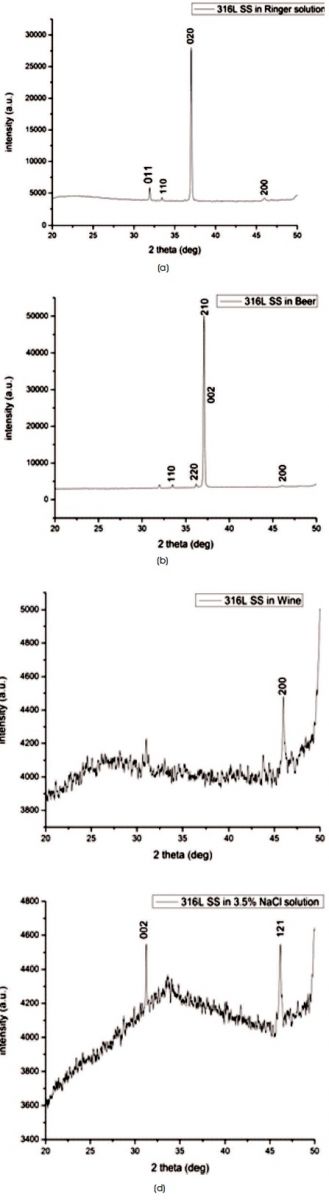
Figure 9. XRD Profile of 316L SS after Corrosion Testing in (a) Ringer Solution (b) Beer (c) Wine (d) 3.5% NaCl Solution
The SEM image of 316L SS sample after corrosion testing in Ringer solution shows the pits formation like stain on the surface as shown in Figure 10(a). The pits formation increase after corrosion testing in Beer and Wine as compared to Ringer solution as shown in Figures 10 (b) and (c), respectively. The large volume pits formed on 316L SS surface after corrosion testing in 3.5% NaCl solution as shown in Figures 10(d), which suggest for low corrosion resistance of 316L SS in 3.5% NaCl solution.
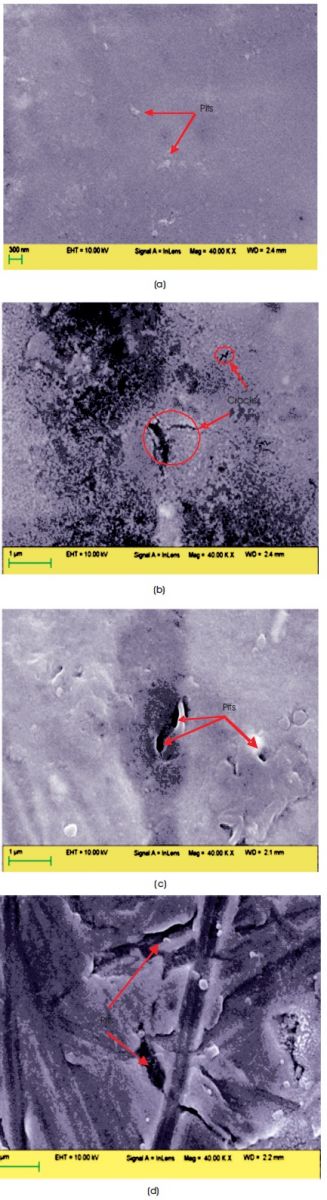
Figure 10. SEM Images of 316L SS Samples After Corrosion Testing in (a) Ringer Solution, (b) Wine (c) Beer (d) 3.5% NaCl Solution
The following conclusions have been drawn from present study,
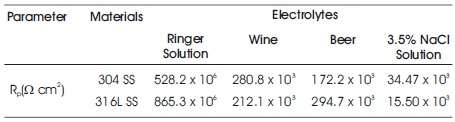
Table 5. Comparison Results of Corrosion Resistance for 304 SS and 316L SS