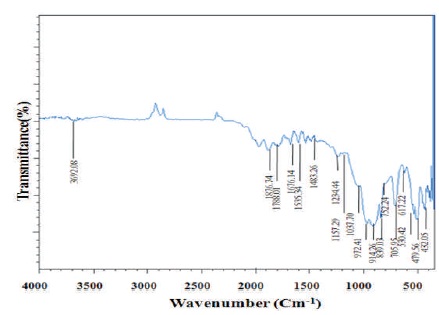
Figure 1. FTIR Spectra of Sr SiO :Dy phosphor
Sr2SiO4 :Dy3+ phosphors were prepared by a conventional solid-state reaction method. In this present study, thermoluminescence (TL) study of Dy3+ doped Sr2SiO4 phosphor is reported. The crystal structure of the prepared phosphor has an orthorhombic structure with space group Pnma and average crystalline sizes could be calculated as 34 nm. The Fourier-Transform Infrared spectroscopy (FTIR) confirms the present elements in Sr2SiO4 :Dy3+ phosphor and energy band gap were founded by optical absorption spectra. Thermoluminescence study was carried out for the phosphor which shows a single glow curve. The kinetic parameter has been calculated by using Chen's glow curve method.
Rare-earth doped luminescent materials have thought of applications in most devices for artificial light production (Jüstel, Nikol, & Ronda, 1998). The phosphors are composed of an inert host lattice and an optically excited activator, typically of 3d or 4f metal ions. Usually, inorganic luminescent materials square measure applied in displays such as TV tubes, PC monitor, oscilloscopes, radio detection and ranging screens and displays in electron microscopes (Feldmann, Jüstel, Ronda, & Schmidt, 2003).
Thermoluminescence (TL) glow curves sometimes contain a variety of peaks occurring at totally different temperatures. The accepted theory of TL considers charge carriers, that throughout excitation are captured in traps and luminescence centres within the forbidden gap of the material being used. The model may include either electron traps and hole centers or hole traps and electron centers. In the former case, during the heating stage, electrons are thermally raised into the conduction band and recombine with holes in luminescence centres, yielding an emission of luminescence. Within the latter, holes are thermally released from traps into the valence band and recombine with electrons in luminescence centers yielding the emission of TL. It has been shown that each sort of peaks might occur within the same material. Thus, a thermoluminesce material may yield separate sets of peaks, one due to thermally free electrons recombining with stationary holes in centres and another set thanks to thermally released holes recombining with electrons in alternative luminescence centers (Furetta, 2003; Zhang, Chen, Liang, & Xu, 2003; Ichikawa, Inoue, & Shibata, 1975).
A solid-state reaction technique is typically used to prepare Sr2SiO4:Dy3+ phosphors. In this technique, the reactants are mixed totally and the mixture is then heated or fired below an acceptable atmosphere. To make sure the right reactivity between the constituents of the phosphor, the reactants are usually granular with radii in the micrometer vary. Additional elements that facilitate the reaction and enhance the crystallinity of the luminescent materials are flux agents or melted salts. These agents are typically added to supply a more interactive medium for the reaction (Dutczak et al., 2012; Pan-Lai, Zhi-Ping, Zhi-Jun, & Qing-Lin 2008; Kim, Jeon, Choi, & Park, 2005). The employment of an interactive medium often leads to lower reaction temperatures and permits for the optimization of the grain size of the luminophores being synthesized (Yanmin, Zhang, Xiao, Yan, & Hai, 2009; Guo et al., 2010; Lee & Kim, 2009).
In the present paper, the authors report the synthesis of dysprosium doped Strontium Silicate (Sr2SiO4:Dy3+) phosphor by high-temperature solid-state reaction technique. This paper reports the structural characterization on the basis of X-Ray Diffraction (XRD), energy band gap and FTIR analysis and studies of optical properties on the basis of thermoluminescence (TL). The study of TL properties of ultraviolet radiation rays irradiated Sr2SiO4:Dy3+ phosphors.
Sr2SiO4:Dy3+ phosphor was prepared by the high-temperature solid state techniques. The raw materials are Strontium Nitrate 2[Sr(NO3)(99.99%)], Silica gel (99.99%)], and Dysprosium oxide [Dy2O3 (99.99%)], all of the analytical grade (AR), were employed in this experiment. Ammonium chloride (NH4Cl) was added as a flux. Initially, the raw materials were weighed according to the nominal compositions of Sr2SiO4:Dy3+ phosphor. Then the powders were mixed and milled thoroughly for 2 hours using mortar and pestle. The grinded sample was placed in an alumina crucible and subsequently fired at 1200 oC for 3 hours. Atlast the nominal compounds were obtained after the cooling down of the programmable furnace.
X-Ray Diffraction (XRD) is a famous and great procedure for the determination of crystal structure of crystalline materials. So precious phase formation and crystal structure of the phosphors were investigated utilizing an X-ray beam diffractometer (PAN Analytical X’pert Pro) working at 40 KV and 30 mA with CuKα radiation (λ=1.54056 Å) and information gathered over the 2θ territory 20-60o. FTIR spectra observed with the help of IR Prestige-21 by SHIMADZU and investigate the (400-4000 cm-1) the infrared region, the samples are mixed with potassium bromide (KBr, IR grade).TL setup (Nuclconix TL 10091) was used for recording TL.
All experiments performed in identical conditions and it is observed that the results are reproducible.
FTIR is a quantitative and qualitative analytical technique which is used to know polymeric, organic and inorganic substances. In FTIR infrared light is used to scan samples and examine chemical properties. FTIR is a powerful instrument for measuring the functional group and covalent bonding information. Figure 1 shows the FTIR spectra of Sr2SiO4:Dy3+ phosphor. In the observed IR spectrum, the absorption bands of the silicate group are clearly evident. An intense band centered at 972.41 cm-1 is assigned due to Si-O-Si asymmetric stretch, bands at 839.03 and 617.22 cm-1 to Si-O symmetric stretch. Bands at 530.42 and 479.56 cm-1 are assigned to Si-O-Si vibrational mode of bending. Furthermore, in keeping with the absorption bands, positioned at 1037.70, 914.26, 752.24 and 705.95 cm-1 respectively can be ascribed to the presence of SiO4 group (Buchholz, Liu, Marks, Zhang, & 4 Chang, 2009; Gou, Chang, & Zhai, 2005).
Figure 1. FTIR Spectra of Sr SiO :Dy phosphor
The asymmetric stretching of (NO2-) nitrites can be observed by the peaks at 1234.44, 1535.34, and 1676.14 cm-1. These bands are due to a slight nitrate of samples preparation [Sr(NO3)2 (raw material)]. The peak in the region of 1483.26 cm-1 is assigned due to Sr2+. When Dy3+ enters the lattice, it will replace the Sr2+ in the Sr2SiO4 host and occupy Sr2+ lattice sites causing distortion in the Sr2SiO4:Dy3+ host crystal lattice. The peak at 3692.08 cm-1 is assigned to water molecules that may be present due to absorption of moisture.
X-Ray Diffraction (XRD) analysis was used to characterize the synthesized phosphors. XRD data analysis of Sr2SiO4 a phase is commonly qualitative andthe bases ofrelative peakintensity. Strontium silicate exists in monoclinic (β- Sr2SiO4) phase at low temperatures and in orthorhombic (α'-Sr2SiO4 ) phase at high temperatures with a transition temperature of ~85 oC. It has been reported that the crystal structure of α'-Sr2SiO4 (orthorhombic), and β-Sr2SiO4 (monoclinic) are very similar (Catti, Gazzoni, & Ivaldi, 1983). The typical X-ray diffraction patterns for solid state technique synthesized of the pure and Dy3+ (0.1-0.4mol%) doped Sr2SiO4 phosphor are shown in Figure 2 from which it can be seen that all the diffraction peaks of every sample could be indexed to the orthorhombic phase of α'- Sr2SiO4 (Ref.code 98-003-5667). The XRD patterns for all the prepared samples are similar to each other and the peak positions are unchanged with a change in doping concentration. The crystal structure of pure and Dy3+ doped phosphors has not changed, because the Dy3+ ions occupy the Sr2+ sites within Sr2SiO4 phosphor, the region is the ionic radius of Sr (1.21Å) nearly same the Dy (1.03) ionic radius.
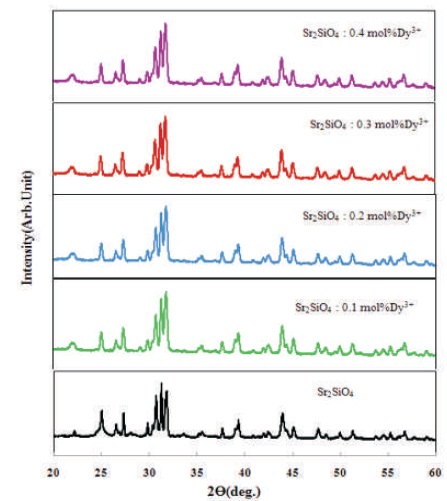
Figure 2. XRD Pattern of Sr2SiO4:Dy3+ Phosphors with Different Molar Concentration
XRD data were indexed on an orthorhombic system with space group Pnma having cell parameters a= 7.0900Å, b= 5.6820 Å, and c= 9.7730 Å. Calculatethe average crystalline size using Scherrer's formula (Stenberg & Hyde, 1986).

Where L is the crystallite size, λ is the wavelength (for Cu Kα, λ=1.5406 Å), β is the full width at half maximum (FWHM) and θ is the Bragg's angle. Table 1 shows XRD data Dy (0.1 mol%) doped Sr2SiO4 phosphor. The peaks in XRD patterns of different samples are similar to each other and are attributed to Sr2SiO4 orthorhombic phase, so for calculation, only one graph (0.1 mol %) is selected. The calculated crystallite size of Sr2SiO4:Dy3+ phosphors are around 34 nm.
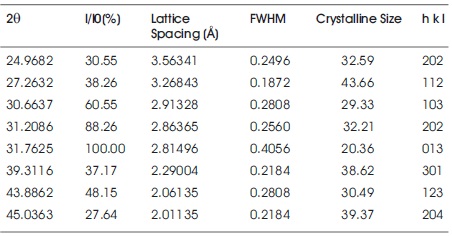
Table 1. XRD Data of Sr2SiO4:Dy3+ Doped Material
Thermoluminescence (TL) is one of the possible ways to elucidating the nature of trap states and the trapping process of materials.TL is the emission of light, which can be observed when it is heatedsuch as UV, x-ray, α, β or gamma radiation.
TL is observed under three important essential ingredients. Firstly, the material needs to be an insulator or a semiconductor. Secondly, the materials must have some state of absorbed energy during the exposure of radiation. Thirdly, the luminescence emission is caused by means of heating the materials (McKeever, 1988).
However, if the ionizing radiation is incident on a material, maybe some of its energy absorbed, the material will store the energy with the release in the form of visible light when the material is heated. Furthermore, the TL material is not emitting light again by simply cooling with reheating, but it must first be exposed to ionizing radiation (Bos, 2006).
Figure 3 shows the TL glow curve of Sr2SiO4:Dy3+ phosphors for different UV exposure and it is shown that the thermoluminescence signal increases with increasing UV exposure. Thermoluminescence signal is observed for a maximum of 25 minutes of UV exposure, after that it starts to decrease. The charge carrier density may have been increasing with increasing UV exposure, but after 25 minutes of UV exposure, trap level may have started to destroy resulting in the decrease in thermoluminescence signals.
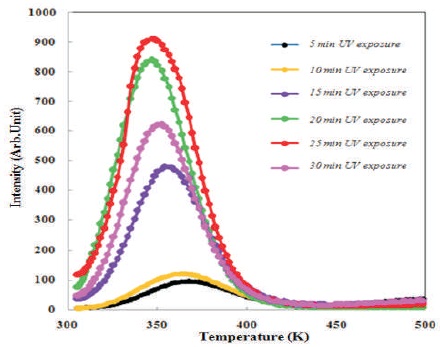
Figure 3. Variation in TL Peak Intensity with Increasing Delay Time of ( Sr2SiO4:Dy3+)
2.3.1 Calculation of Kinetic Parameters
Any phosphors show the TL peaks when charge carriers were released. TL emission peaks of phosphors depend on the kinetic parameters such as trap depth or activation energy (E), the order of kinetic (b) and frequency factor (s). The peak shape method is suitable for calculating the kinetic parameters (Chen, 1969a; Gökçe, Oğuz, Karali, & Prokic, 2009; Yuan, Chang, Mao & Ying, 2004; Pagonis, Kitis, & Furetta, 2006).
2.3.2 Order of Kinetics (b)
Order of the kinetic parameter, depends on the TL peak shape method and recombination of de-trapped charge carriers with their counterparts are called the order + of kinetics (b). Kinetic order for glow peak of Sr2SiO4:Dy3+ phosphor can be determined by a geometrical factor (μo). The equation is,
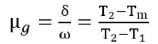
Here, Tm is the temperature of high peak intensity
T1 is the ascending part of glow peak, and
T2 is the descending part of the peak
The TL glow peak divided between first and second order of kinetics of geometric factor defined, first-order kinetics (μg) = 0.39-0.42, (μg) = 0.49-0.52 is the second order kinetics and (μg) = 0.43-0.48 is the mixed order of kinetics (Sahu, Bisen, & Brahme, 2014).
2.3.3 The Activation Energy (E)
The activation energy is calculated by the general formula, which is valid for any kinetics. It is given by,
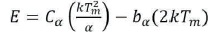
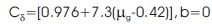
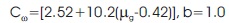
For general order kinetics cα and bα ( α = τ, δ, ω) are calculated by the following expression,

2.3.4 Frequency Factor (s)
Frequency factor is a probability of the escape of electrons from the traps, after exposure to ionizing radiation. After obtaining the kinetics order (b) and activation energy (E), then calculated frequency factor (s) from the following equation and substitute the values of band E
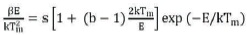
Here, β is the heating rate, k is Boltzmann constant.
Figure 4 shows the TL glow curve of pure and different concentration of Dy3+ doped Sr2SiO4 phosphor. An isolated single peak is observed due to only one type of luminescence centre is formed during irradiation (25 min) by UV-rays in each sample. Maximum peak intensity occurs around 348K for all doped samples. The TL results show the presence of doping ions Dy3+ changes the TL intensity either enhancing or quenching due to the crystal field perturbation, the different concentration of the doping element which supposedly replaces the (Sr2+) sites (Tamrakar, Bisen, Sahu, & Brahme, 2014). It is important to find maximum TL efficiency and improve sensitivity using appropriate doping concentration.

Figure 4. TL Glow Curve of Sr2SiO4:Dy3+ Phosphors with Different Concentration
Figure 5 has shown the variation of TL peak intensity. When the doping concentration of Dy3+ increases, TL peak intensity is also increasing and the highest peak intensity finds for 0.2 mol% doping concentration, after that the doping levels increasing TL output gradually decreases. This effect is called concentration quenching. It is stated that this behavior is characteristic of isolated activator centers. When one activator ion is located within a certain radius of another, the luminescence is quenched (McKeever, 1988).So it is essential to determine the critical transfer distance (Rc) of the activator and quenching site. Rc can be calculated from the following formula (Dexter, 1953).
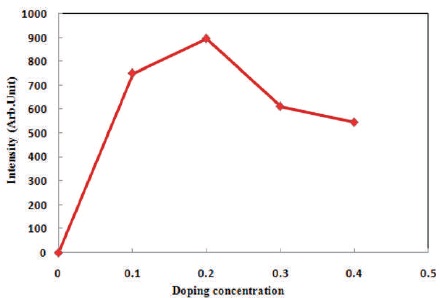
Figure 5. Variation of Peak TL Intensity with Different Concentration of Dy3+ Doped Sr2SiO4 Phosphors

In Sr2SiO4 material unit cell volume V is 393.71 Å3. In Orthorhombic structure of Sr2SiO4 materials in per unit cell number of host ions, N is 4 (Gökçe et al., 2009). The critical concentration Xc is 0.2 mol%, resulting from the maximum intensity of Sr2SiO4:Dy3+ at 0.2 mol%. According to the equation calculate the value of critical transfer distance (Rc) is 45.47 Å. The value of Rc is high and indicate the nonradiative concentration quenching takes place among two nearest doping element (Dexter, 1953).
Theoretically, the values of symmetry factor (μg) for first and second order kinetics are close to 0.42 and 0.52, respectively. The activation energy (Eα) or trap depth which is the thermal energy required to liberate the trapped electron and holes can be determined by Chen's equation (Chen, 1969b). Different parameters calculated from glow curves are presented in Table 2. The value of trap depth, which resembles the activation energy, is calculated to lie between 0.66 to 0.91eV. It is worth reporting that the shape factor, which range from 0.48 to 0.60, shows the second order kinetics that supports the probability of retrapping released charge carriers before recombination.
In this work Sr2SiO4:Dy3+ phosphor was prepared by solidstate reaction method which appears to be a more feasible method for production. XRD studies confirmed the formation of a single phase compound and find an average crystallite size of Sr2SiO4:Dy3+, phosphor is 34 nm. From TL glow curve, with increasing UV exposure time TL intensity increase and maximum intensity is observed for 25 minutes after that, it starts to decrease. Is due to the fact that when UV dose are increased, number of defects is created, so the TL intensity increases, but after a specific time of UV exposure thermoluminescence intensity decreases because the trap levels start to destroy. The TL glow curve for different concentration of Dy3+ doped Sr2SiO4 phosphors reveal the maximum intensity of 0.2 mol%, after that the doping levels increase and TL output gradually decreases. The calculation of shape factor reveals second order kinetics that supports the probability of retrapping released charge carriers before recombination. Acknowledgment The authors gratefully acknowledge the kind support of the Department of Metallurgical Engineering, NIT Raipur for help in the XRD and Scanning Electron Microscopy (SEM) analysis of samples.