Table 1. Sample Conditions for XPS Measurement
Gd-doped ceria (GDC) films were synthesized on Si substrates from (Ce, Gd)-EDTA solutions and atmospheric sintering. The (Ce, Gd)-EDTA solutions were coated onto silicon by a commercial spin coater and the coated samples were sintered in a furnace at 850oC for 1 h. For the composition of Ce: Gd=0.8:0.2 in the EDTA complex with sintering at 850oC only the crystalline phases of Ce0.8Gd0.2O1.9 were synthesised on the Si substrates. Microstructures of the Ce0.8Gd0.2O1.9 films had 78 3D-relative densities as revealed by ellipsometry. Furthermore, the oxidation degree of the Ce ion was equal in the obtained Ce0.8Gd0.2O films at various experimental conditions as confirmed by XPS analysis.
Gd-doped CeO2 (GDC) has attracted the attention of many researchers for its use in commercial applications, especially as an electrolyte in solid oxide fuel cells (SOFCs) (Ko, Myung, Lee, Hyun, & Chung, 2012; Jamale, Bhosale, & Jadhav, 2015). GDC has oxygen ion conductivity. The ion conductivity arises from lattice defects caused by Gd-doping of the CeO2 crystals, which have a fluorite structure with a cubic lattice. Such oxygen non-stoichiometry can be controlled by the addition of solid solution species. The solid solution species are materials such as rare earth metal oxides and transition metal oxides (Azad et al., 2005; Fu, Liu, Chan, Ge, & Pasciak, 2010). For example, the bulk oxygen ion conductivity for 15 at. % Gd-doped GDC, synthesised by oxalate coprecipitation, was maximised at temperatures lower than 400 oC. In contrast, 20 at. Gd-doped GDC has the highest conductivity at over 400 oC. GDC has a higher ion conductivity than yttria-stabilised zirconia (YSZ) at o 400–700 oC (Badwal et al., 2013). Furthermore, GDC is known as an inter-diffusion barrier layer because of its low reactivity with YSZ, strontium-doped lanthanum manganite (La1-x Srx MnO3-δ or LSM), and strontium-doped lanthanum ferrite (La Sr FeO or LSF) materials (Li, Mori, 1-x x 3-δ Auchterlonie, Zou, & Drennan, 2011). Hence, GDC has an important role in intermediate temperature SOFCs.
The synthesis of GDC films has been reported by various techniques. Dense GDC films with thicknesses ranging from 250- 500 nm were synthesized by physical vapor deposition (PVD) techniques such as sputtering (Jordan et al., 2008) and ion-assisted vapor deposition (IAD) (Gong et al., 2011). The advantage of these PVD techniques is that thinner GDC films can be obtained as compared to slurry coatings at a low temperature (<1000 oC). In addition, chemical vapor deposition (CVD) techniques such as aerosol-assisted CVD (AACVD), can also be used for fabrication of dense GDC films (Schlupp et al., 2013). Films with columnar structures in the vertical direction, relative to the substrates, tend to form by gas-phase deposition processes as found in PVD and CVD techniques. The grain boundary of the columnar structures provides an elemental diffusion path. In contrast, one liquid-phase deposition technique, chemical solution deposition (CSD), is used for fabrication of GDC films with porous, cracked microstructures (Ploncazk et al., 2011; Oh et al., 2014). The thicknesses of the GDC films range from 350 nm to 1 m. Porosity and cracking in GDC films, synthesised by CSD techniques, have been improved by using a drying control chemical additive (Oh et al., 2014). Protocols for the fabrication of dense and thinner GDC films can be applied to intermediate temperature SOFCs.
One of the stoichiometrically tuneable organic complexes is the complex between ethylenediaminetetraacetic acid (EDTA) and a metal. The EDTA forms a chelate complex with a metal ion in the metal: EDTA ratio of 1:1. The particles obtained by the spray-drying technique from EDTA-complex aqueous solutions have uniform stoichiometry designed in the fabrication of the metal-EDTA complex. The metal-EDTA complexes are decomposed and changed to metal oxides by firing in the atmosphere with an oxidation reaction. Spherical metal-oxide Y2O3 :Eu3+ (Saitoh, Kawahara, Ohshio, Nakamura, & Nambu, 2005) and Sr-Al-O:Eu2+(Komatsu et al., 2011) particles with accurate metal compositions have been realized by the metal-EDTA route. Furthermore, metal-oxide films with metal-EDTA complex powders were synthesized on SUS substrates by a commercial spray apparatus (Komatsu et al., 2014; Xin et al., 2017). These metal-EDTA route method is categorised in the pyrolysis of the complexes. The pyrolysis of the complex forms metal-oxide materials, with homogeneous elemental distribution, by decomposing the organic complex. Then, the solvent is dried instantly. One simple coating method is spin-coating. In the spin-coating method, the solvent is dried instantly on spinning substrates. Hence, the metal-EDTA solution would be used as a starting solution for the synthesis of metal-oxide films by spin-coating and atmospheric sintering. The instant drying and solidification processes are expected to be the same as in the spray-drying method. In this study, GDC films were synthesized on Si substrates by spin-coating (Ce, Gd)-EDTA solutions and atmospheric sintering. A commercial spin coater and furnace were used for the synthesis. Crystal structures, surface and cross-sectional morphologies, true densities, porosities, and stoichiometry of the deposited films were investigated.
Two kinds of metal-EDTA complexes, Ce- and Gd-EDTA, were used as raw materials to synthesize the (Ce, Gd)- EDTA solutions. First, Ce-EDTA and Gd-EDTA were dissolved with deionised water and mixed in the ratio 8:2 (Ce:Gd) in the EDTA complex. The concentration of the metal-EDTA complex solution was controlled at 15 wt % A 30 wt % (Ce, Gd)-EDTA solution was also prepared by heating concentration the 15 wt% (Ce, Gd)-EDTA solution. The 15 and 30 wt% (Ce, Gd)-EDTA solutions were used as aqueous solutions for spin coating. The 30 wt% was maximum concentration for metal ion in the EDTA solution.
GDC films were synthesised on Si substrates with a spin coater (ACT-300DⅡ : ACTIVE, Co. Ltd.) and an atmospheric furnace. First, Si (100) substrates (50×50×1 mm3) were set on a sample holder in the spin coater. Approximately 0.3 ml of the (Ce, Gd)-EDTA solution was dropped onto the substrates during rotation of the sample holder. The rotation speed of the coater was varied from 1000 to 7000 rpm. The rotation duration was constant at 20 s. Next, the coated samples were sintered at 850 oC for 1 h in the atmospheric furnace. In this study, these protocols were repeated one, three, five, and ten times. In addition, a different protocol was performed for obtaining thick GDC films with (Ce, Gd)-EDTA. The coated samples were pre-sintered at 300 oC on a hot plate for 15 min. We performed the metal-EDTA solution coating and pre-sintering five and ten times and sintering at 850 oC for 1 h.
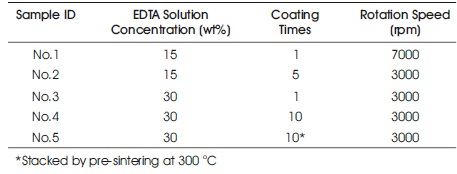
Crystal structure analysis of the obtained samples was conducted by X-ray diffraction (XRD, Ultima Ⅳ , Rigaku). Lattice constants of the samples were estimated from the obtained diffraction peaks. Surface and cross-sectional morphologies of the samples were observed by field emission scanning electron microscopy (FE-SEM, JSM6700F, JEOL). In addition, surface elemental analysis of the samples was conducted by X-ray photoelectron spectroscopy (XPS, JPS-9010TR, JEOL). MgKα radiation was used as the X-ray source. For XPS analysis, the authors have prepared samples according to the conditions outlined in Table 1. The Ce and Gd constants in the samples were estimated from the peak area ratio of the Ce4d and Gd4d peaks. Furthermore, the oxidation degree of the Ce ions in the samples was investigated by estimating the ratio of the Ce3+ and Ce4+ ions in the samples. The Ce4d peak was analyzed by a peak analysis software (Origin Light Stone).
Table 1. Sample Conditions for XPS Measurement
The refractive index, extinction coefficient, thickness, and 3D porosities of the samples were estimated by ellipsometry (HORIBA Jobin Yvou, UVISEL NIR). Measured data were analysed by the Levenberg-Marquardt algorithm. The Tauc-Lorentz fitting model was used for estimation of the refractive index, extinction coefficients, and thicknesses. In addition, Lorentz-Lorentz fitting was used to determine the 3D porosities. The true densities of the samples were estimated by X-ray reflectivity (XRR). XRR measurements were conducted by X-ray diffractometry (MAC Science MO3XHF).
The (Ce,Gd)-EDTA solution was dropped onto the substrates during rotation of the sample holder. Subsequently, the samples were sintered at 850 oC for 1 h in the atmospheric furnace. Figure 1 shows photographs of the samples on the Si substrates at various rotation speeds. After coating and sintering, brown films could be observed on the Si substrates at various rotation speeds. The colour of the films was that of the (Ce, Gd)-EDTA solution. Figure 2 shows XRD profiles for the samples with the (Ce, Gd)-EDTA solution deposited on the Si substrates at various rotation speeds. All XRD profiles were assigned to the Ce0.8Gd0.2O1.9 crystalline phase. At 1000 and 3000 rpm, the diffraction peaks of Ce0.8Gd0.2O1.9 correspond to the (111) and (220) crystalline planes, respectively. In addition, at 5000 and 7000 rpm, the diffraction peak corresponding to the (111) plane was assigned. In a previous report, solid solutions of GDC were synthesised by a EDTA-citrate complexation method such as this study (Anjaneya & Singh, 2017). In the synthesis of GDC, strain is created in the host lattice and the material is elastically deformed by increasing pH. The crystalline growth of GDC at low pH values was faster because the crystals that were formed were smaller when synthesised under acidic conditions (Lin, Duh, & Chiou, 2001). Hence, the GDC films were synthesised with (Ce,Gd)-EDTA solution by atmospheric sintering.
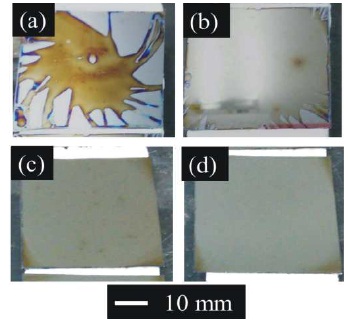
Figure 1. Photographs of Sample on Si Substrates at Various Rotation Speeds

Figure 2. XRD Profiles for the Samples with the (Ce, Gd)-EDTA Solution Deposited on Si Substrates at Various Rotation Speeds
Figure 3 shows surface SEM images of the samples with the (Ce, Gd)-EDTA solution deposited on the Si substrates. Cracks with 10–200 nm lengths were observed in the sample synthesised at 1000 rpm. At 3000 and 5000 rpm, cracks with 10–30 nm lengths were observed. In addition, few cracks were observed in the samples synthesised at 7000 rpm rotation speeds. In this study, a grain boundary in the samples was not observed by SEM at any of the rotation speeds. The grain size of the GDC particles on the Si substrates was very small. A dense microstructure of the GDC films with the (Ce, Gd)-EDTA solution was formed. Figure 4 shows cross-sectional SEM images for the samples with the (Ce, Gd)-EDTA solution deposited on Si substrates. The thickness of the samples increased by decreasing the rotation speeds. The thickness of the GDC films synthesised on Si substrates were 85, 50, 33, and 28 nm by increasing the rotation speeds. From Figures 3 and 4, it was observed that crack lengths were longer in the thicker GDC films. Upon completion of the spin-coating and drying processes, the green-state (Ce, Gd)-EDTA thin film was subjected to elevated temperature for sintering. The strain mismatch between the film and the substrate controls the densification and structural integrity of the GDC layer. The mismatch strain, which determines the mismatch stress, is exactly equal to the sintering shrinkage of the GDC layer against the non-sintering substrates such as in the previous CSD method (Oh et al., 2014). Hence, the obtained GDC films with the (Ce, Gd)-EDTA solution have a dense microstructure.

Figure 3. Surface SEM Images of the Samples with the (Ce, Gd)- EDTA Solution deposited on Si Substrates at Various Speeds
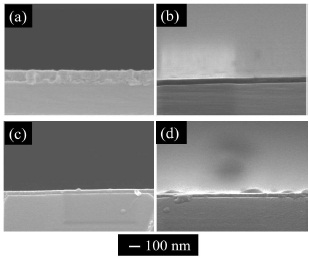
Figure 4. Cross-Sectional SEM Images of the Samples with the (Ce, Gd)-EDTA Solution deposited on Si Substrates at Various Speeds
Porosity was calculated from the refractive indices using a first-order rule of mixtures. The Maxwell-Garnett theory, which assumes spherical particles in a medium of refractive index equal to unity, was used to calculate the “porosity” of the Stöber sphere-based film (Taylor, Fleig, & Hietala, 1998; Heavens, 1965). The authors have conducted spectroscopic ellipsometry (SE) analysis for the obtained films. Table 2 shows refractive indices, extinction coefficients, thicknesses, and estimated 3D porosities as determined by the SE analysis. The fitting model used for the SE analysis was the Tauc-Lorentz model with a single layer. The refractive indices of the GDC films were 1.778, 1.867, 1.755, and 1.759 for increasing rotation speeds, while the extinction coefficients were 0 for all GDC films. The film thickness was 64.2, 35.1, 30.3, and 26.2 nm with increasing rotation speeds. Chi-square values, X2, of the fitting decreased with increasing rotation speeds. The estimated 3D porosities were 30.6, 25.0, 32.2, and 31.9% with increasing rotation speeds. The estimated 3D porosity of the GDC films with the (Ce,Gd)-EDTA solution was approximately 30% and did not depend on the rotation speed.
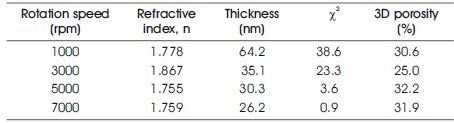
Table 2. SE Analysis Result of obtained Films at Various Rotation Speeds
Thin GDC films were synthesized on Si substrates with the (Ce, Gd)-EDTA solution. Next, thick GDC films were synthesized to investigate stoichiometry in the GDC films. The GDC films were synthesised by repeat coating of the o (Ce, Gd)-EDTA solution and sintering at 850 C for 1 h. All stacked samples were identified to contain Ce0.8Gd0.2O1.9 crystals as determined by the XRD method. Figure 5 shows photographs of the stacked GDC films on Si substrates at various stacking times. The colour of the samples changed from blue to ultraviolet by stacking. Figure 6 shows surface SEM images of the stacked GDC films at various stacking times. At ten times stacking, cracks with approximately 100-nm length existed. In contrast, at one, three, five and ten times, cracks with 100–300 nm length existed. Thus, the crack-length was shorter by stacking (coating and sintering) multiple times. Figure 7 shows cross-sectional SEM images of the stacked GDC films at one and ten times. An approximately 600-nm thick layer was formed on the Si substrate by stacking ten times. In addition, the existence of pores with a size of 100 nm was confirmed in the sample. In contrast, at one-time stacking, a layer with a thickness of 60 nm was formed on the substrate. Table 3 shows values of the refractive indices, extinction coefficients, thicknesses, and estimated 3D porosities for the stacked GDC films. The refractive indices of the GDC films were 1.754, 1.749, 1.696, 1.644 for increasing stacking times, while the extinction coefficient was 0 for all GDC films. Thicknesses were 82.3, 229, 405, and 848 nm with increasing stacking times. Chi-square values, X2, of the fitting increased by increasing the stacking times. The estimated 3D porosities were 32.2, 32.6, 36.3, and 40.0% with increasing rotation speed. The estimated 3D porosity increased by stacking. They conducted an additional experiment to investigate the effect of stacking on the 3D porosity. They also prepared a GDC film by repeated (ten times) coating and sintering at 300 oC (pre-sintering) and one-time sintering at 850 oC for 1 h. The 3D porosity was decreased compared to the samples that were stacked ten times. From XRR measurements, the 1X- and 10X-stacked GDC films have a true density of 5.63 and 5.74 g/cm3, respectively. The value of the pre-sintered GDC film had a true density of 4.00 g/cm3. The density of the GDC films synthesized by pre-sintering have a lower density than that of the films obtained by stacking. The ten-times sintered GDC film has a thickness of 600 nm and a true density of 5.74 g/cm3. In contrast, theoretically, the thickness of the GDC film by coating and sintering ten times is 700 nm and has the same true density. The existence of some pores and cracks were confirmed, by cross-sectional SEM, in the ten-time sintered sample. A crack in the under-layers of the GDC would produce the observed pores in the stacked GDC films.
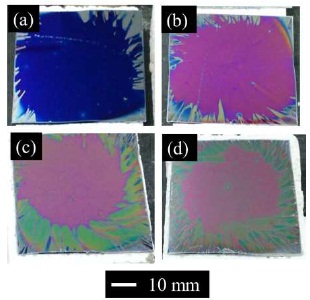
Figure 5. Photographs of the Stacked Films on Si Substrates with the (Ce, Gd)-EDTA Solution at Various Stacking Times
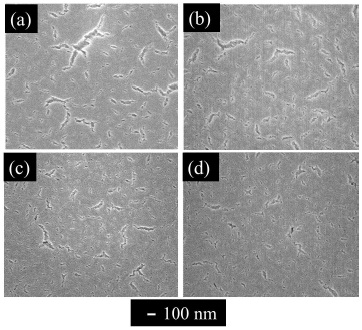
Figure 6. Surface SEM Images of Stacked films for Various Stacking Times
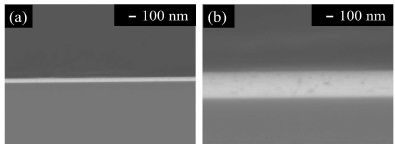
Figure 7. Cross-sectional SEM Images of Stacked Films at (a) One Time and (b) Ten Times

Table 3. SE Analysis Result of obtained Films at Coating Times
The metal-EDTA complexes were decomposed, and changed to metal oxides by firing in atmosphere with an oxidation reaction. Compositional analysis revealed the accurate metal composition of oxide phosphor from metal-EDTA solution formed by spray drying process. Surface elemental analysis of the obtained GDC films was conducted by XPS. Figure 8 shows wide-scan spectra for the synthesised GDC films. All wide-scan spectra showed Ce3d, Gd4d, O1s, C1s peaks. Figure 9 shows narrow-scan spectra of the Ce3d orbital for GDC films synthesized with the (Ce, Gd)-EDTA solution. All samples have Ce 3d5/2 peaks (U, U'', U''') and Ce 3d5/2 peaks (V, V'', V'''). The Ce 3d XPS spectra for fully oxidised CeO2 can be described by six peaks: v, v" and v"' peaks refer to 3d and u, u" and u"' peaks to 3d3/2 spin-orbit component (Zarkov et al., 2017; Grover et al., 2014; Mullins, Overbury, & Huntley, 1998). These six peaks originate from Ce4+ ions in the obtained GDC films. In contrast, the existence of Ce3+ ions was confirmed in the CeO2 crystal. So, the oxidation process of Ce2 ions in the obtained GDC films can be suggested. In this study, the Ce peaks in the obtained GDC films were 3d analyzed to estimate the ratio of the Ce3+ and Ce4+ ions in the samples (Lin et al., 2012; Orliukas et al., 2011; Zhang, Wang, Koberstein, Khalid, & Chan, 2004). Figure 10 shows the peak analysis results for the Ce3d peak of Sample 1. The green lines are the fitting results, indicating that the spectrum was decomposed into thirteen peaks. The spectrum was decomposed into peaks originating from Ce4+ ions (U, U'', U''', V, V'', V''') and Ce ions (U0, U', V'). The same analysis was conducted on Samples 2-5. Table 4 shows the results of the estimation of Ce3+ and Ce4+ ions from the Ce orbital in Samples 1–5. Contents of the Ce3+ 3d ions in Sample 1–5 were 27–30. The ratio of Ce3+ and Ce4+ ions in the samples was approximately Ce4+ :Ce3+ =3:7. The ratio was almost equal. Figure 11 shows narrow-scan spectra of the Gd4d orbital for GDC films synthesised with the (Ce, Gd)-EDTA solution. All samples have Gd 4d 5/2 peaks and Gd 4d peaks. Quantitative analysis for the GDC films was conducted from the ratio of the peak area intensities of the Gd4d and Ce3d peaks. Table 5 shows the results of quantitative analysis by XPS. The Gd content in the GDC films was 16–21 at. %. The quantitative accuracy of XPS is approximately 10–30. Hence, the variation of Gd content in the samples was within the error range. The ratio of the Ce and Gd atoms in the samples was approximately Ce:Gd=8:2. Thus, the composition deviation in GDC films synthesized from (Ce, Gd)-EDTA solutions would be little. Hence, GDC films with high stoichiometry accuracy were synthesized from (Ce, Gd)- EDTA solutions.
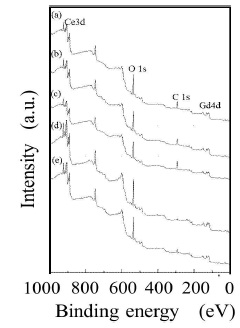
Figure 8. Wide-Scan Spectra for GDC Films Synthesiszed with the (Ce, Gd)-EDTA Solutions
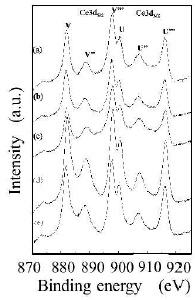
Figure 9. Narrow-Scan Spectra of Ce3d Orbital for GDC Films Synthesiszed with the (Ce, Gd)-EDTA Solutions
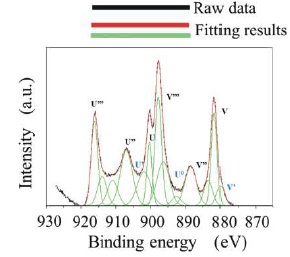
Figure 10. Peak Analysis Result for the Ce3d Peak of Sample 1
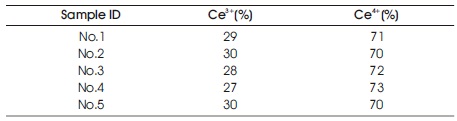
Table 4. XPS Analysis Results of obtained Films on Si Substrates
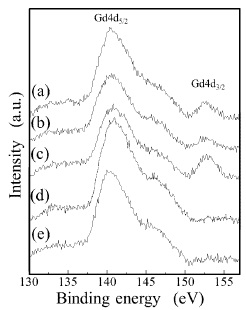
Figure 11. Narrow-scan spectra of Gd4d Orbital for GDC Films Synthesized with the (Ce, Gd)-EDTA Solutions

Table 5. Quantitative XPS Analysis Results of obtained Films on Si Substrates
GDC films were synthesized with (Ce,Gd)-EDTA complex solutions and atmospheric sintering. Molecularly mixed (Ce,Gd) )-EDTA complex was prepared as a raw material. The elemental ratio was Ce:Gd=8:2. Homogenous GDC crystalline phases were synthesised on Si substrates. Surface cracks and small pores were found to exist in the GDC films. These cracks and pores improved by the synthesis. The GDC films had a dense microstructure with 78 relative densities as determined from SEM observation and SE analysis. Furthermore, the stoichiometry of the obtained GDC films was confirmed from XPS analysis.