(1)
InxSe1-x (x=0.2 and x=0.6) crystals have been grown by Bridgman/Stockbarger method. The compositional, morphological and structural properties of InxSe1-x semiconductor crystals have been investigated using energy dispersive X-ray (EDX), scanning electron microscopy (SEM) and X-ray diffractometer (XRD) techniques. The freshly cleaved crystals acquired from ingot have mirror-like surface. The powder XRD results revealed that the grown sample was crystalline with a hexagonal structure. SEM image showed that InxSe1-x crystals have smooth, homogenous and layered surface. The crystalline developments in the InxSe1-x crystals have been investigated by X-ray peak broadening. The Williamson Hall (W-H) analysis and size strain plot methods are used to study the individual contributions of crystallite sizes and lattice strain on the peak broadening of the InxSe1-x crystals. The physical parameters such as strain, stress, and energy density values were evaluated more specifically for all the reflection peaks of XRD corresponding to the hexagonal phase of InxSe1-x crystals from the modified form of the W-H plot using uniform deformation model (UDM), uniform stress deformation model (USDM), uniform deformation energy density model (UDEDM) and by the size strain plot method (SSP). The results obtained showed that the mean crystallite size of the InxSe1-x crystals determined from the W-H analysis and the SSP methods are inter-correlated.
Indium Selenide (InSe) is an inter-layered semiconductor material of AIIIBVI family. The cleaved InSe yields high-quality surfaces and has been shown to belong to a new class of materials with characteristics prominent to solar energy conversion application. Due to the existence of abundant phases with reasonable hole mobility and good electrical conductivity, it is more significant to study the structure with stoichiometric and non stoichiometric ratios of InSe crystal (da Costa, Dandrea, Wallis, & Balkanski, 1993; Ates, Kundakci, Akaltun, Gurbulak, & Yildirim, 2007). The physical properties of InSe based bulk single crystal are primarily interesting because of existence of several different phases, depending upon the use of heat treatments (Yudasaka, Matsuoka, & Nakanishi, 1987), pressure effects (Ulrich et al., 2000), and presence of a capping layer (Groot & Moodera, 2001). InSe is among layered anisotropic semiconducting materials that are widely used in the fabrication of photosensitive heterostructures, current sources, and strain gages (Raranskii, Balazyuk, Kovalyuk, Mel'nik, & Gevik, 2011). Crystal morphology and particle size play vital roles in device applications hence it has motivated researchers to focus on the growth of InSe crystals in recent years. A crystal which is extended infinitely in all direction is an ideal crystal; consequently, due to their limited extension no crystals are perfect (Motevalizadeh, Heidary, & Abrishami, 2014). Hence the change in broadening of peaks is due to this deviation from ideal crystallinity. The two major properties evaluated using these broadenings are the crystallite size and lattice strain. Lattice strain is defined as the measure of the allotment of lattice constants occurring from crystal imperfections, such as lattice dislocations, grain boundary, triple junction, contact or sinter stress, stacking faults, and coherency (Zhang, Zhang, Xu, & Ji, 2006).
As described by Motevalizadeh et al. (2014), the size of comprehensibly diffracting domains defines the crystallite size. The size of the particles is not usually the same as the crystallite size due to the formation of polycrystalline aggregates (Zak, Majid, Abrishami, & Yousefi, 2011). The Bragg peak is persuaded in different ways by the lattice strain and particle size. Both these effects enhance the peak width and intensity and alter the 2θ peak position consequently. However, the peak width resulting from strain varies as tanθ, while crystallite size varies as 1/cosθ. This difference in behavior as a function of 2θ allows one to distinguish between the strain and size effects on peak broadening. The Bragg width contribution from crystallite size is inversely proportional to the crystallite size (Yogamalar, Srinivasan, Vinu, Ariga, & Bose, 2009). The size-induced and strain-induced broadening is determined by W-H analysis considering the peak width as a function of 2θ, which is a simplified integral breadth method (Suranarayana & Norton, 1998).
In present study, Bridgman/Stockbarger method has been used to grow InxSe1-x crystals. The chemical composition and morphology have been analyzed by using Energy Dispersive X-Ray (EDX) and Scanning Electron Microscopy (SEM). Additionally, a relative evaluation of the mean particle size of the InxSe1-x crystals obtained from powder XRD method is reported. The stress-strain relation and the strain (ε) as a function of energy density (u) associated with the InxSe1-x crystals were evaluated using different models related to W-H analysis, such as UDM (Uniform Deformation Model), USDM (Uniform Stress Deformation Model), UDEDM (Uniform Deformation Energy-Density Model), and SSP (Size-Strain Plot) method (Prabhu, Rao, Kumar, & Kumari, 2014).
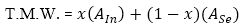
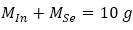
InxSe1-x crystals have been grown by using the Bridgman/Stockbarger method from non-stoichiometric mixture of highly pure Indium (Spectrochem Pvt. Ltd., Mumbai: 99.99%) and Selenium (Loba Chemie Pvt. Ltd., Mumbai: 99.99%). Mixture of Indium (2.7g) and Selenium (7.3 g) for InxSe1-x crystals where x=0.2 and mixture of Indium (6.9 g) and Selenium (3.1 g) for In Se crystals where x=0.6 have been kept into a cleaned quartz ampoules and ampoules were sealed under a vacuum of 10-6 mbar (Patel, Desai, Dhimmar, & Modi, 2016). This off-stoichiometric ratio necessary to fabricate 10 g InxSe1-x is calculated using the following relationships,
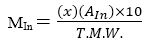
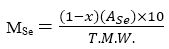
where T.M.W. is the total molecular weight, M is total mass, and A is atomic mass, respectively. The melting point of InSe compound was found to be about 660±5 °C determined using the phase diagram (Imai, Suzuki, Haga, Hasegawa, & Abe, 1981; Gürbulak, 2005). The vacuum sealed quartz ampoule was placed at the centre of a two zone furnace designed in the laboratory. The temperature of both the zones were increased simultaneously up to 850 °C and kept constant at this temperature for 12 hours. The temperature of both zones were reduced to 750 °C at the rate of 0.6 °C/min and was kept constant at that temperature for 15 hours. Temperature of lower zone was then reduced to 460 °C and the temperature of upper zone was reduced to 530 °C at the rate of 0.3 °C/min and stayed at that temperature for 50 hours. Both the zones were cooled to room temperature at the rate of 0.2 °C/min.
The grown single crystal ingots have natural mirror-like cleavage faces therefore cleaning and polishing of faces is not necessary and the faces are free from cracks or voids on the surface. They were cleaved into perpendicular planes of naturally cleaved faces. It is found that the grown samples have n-type conductivity using hot- probe technique. The quantitative compositional analysis and morphology of InxSe1-x crystals have been carried out by EDX and SEM, respectively. The structural properties of InxSe1-x crystals have been analyzed using data recorded by X-ray diffractometer (Rigaku, Japan).
The chemical composition investigations of InxSe1-x crystals have been confirmed by EDX attached with the SEM. EDX result showing the weight and atomic content of elements present in InxSe1-x crystals are listed in Tables 1 and 2, respectively. These results show that In Se crystals x 1-x has off-stoichiometric composition. From EDX spectra, the ratio of weight (%) and atomic (%) of Indium (In) and Selenium (Se) in InxSe1-x crystals (x=0.2) are 0.9 and 1.5 and the ratio of weight (%) and atomic (%) of Indium (In) and Selenium (Se) in InxSe1-x crystals (x=0.6) are 0.8 and 1.1, respectively.
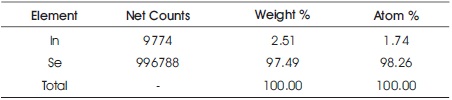
Table 1. The Atomic and Weight Content for InxSe1-x Crystals (x=0.2)
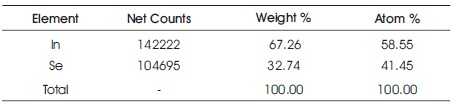
Table 2. The Atomic and Weight Content for InxSe1-x Crystals (x=0.6)
The scanning electron microscope image of InxSe1-x crystals for 1.5 K magnification is shown in Figures 1(a) and 1(b) respectively. The surface morphology image of the InxSe1-x crystals shows layered structure with smooth and homogeneous surface and the crystals were fairly uniform and compact. The SEM images of InxSe1-x crystals show no microscopic defects like voids, pinholes, peeling, or cracks on surface.
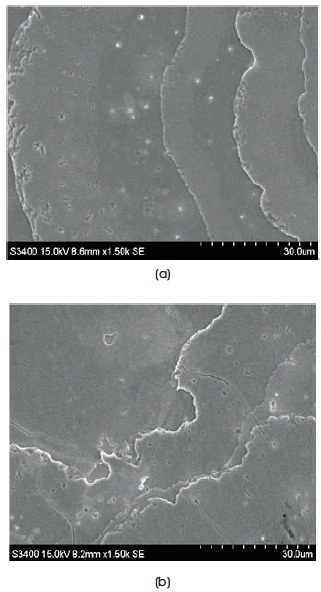
Figure 1(a) Morphological Image of InxSe1-x (x=0.2) Crystal (b) Morphological Image of InxSe1-x (x=0.6) Crystal
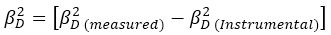
The powder XRD patterns of the prepared samples of InxSe1-x crystals are shown in Figures 2(a) and 2(b), respectively. The recorded diffraction peaks and planes are compared with standard JCPDS (Joint Committee on Powder Diffraction Standard) X-ray data file No. 20-0493 (x=0.2) and X-ray data file No. 34-1431(x=0.6), which indicates that both the samples InxSe1-x crystals has hexagonal structure. It was clearly seen that the reflection peaks became sharper with increasing Indium content. This indicates the enhancement of crystallinity. The lattice parameters of hexagonal InxSe1-x crystals such as the lattice constants a, b, and c and volumes of the unit cell are calculated from the lattice geometry equation as given below (Cullity, 1956). The lattice parameters of the powders of InxSe1-x crystals are reviewed in Table 3.
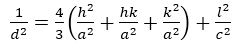

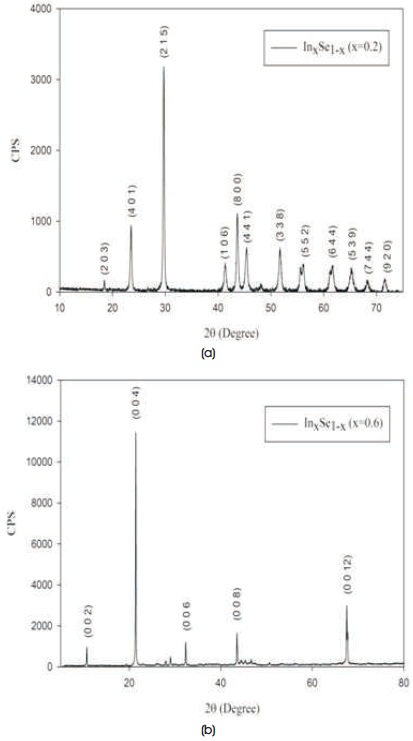
Figure 2 (a). Powder XRD Pattern of InxSe1-x (x=0.2) Crystal (b) Powder XRD Pattern of InxSe1-x (x=0.6) Crystal
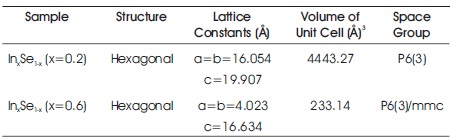
Table 3. The Structural Parameters of InxSe1-x Crystals from Powder XRD Data
Powder XRD data can be used to estimate peak broadening with crystallite size and lattice strain due to dislocation (Bindu & Thomas, 2014). Scherrer equation: D = (kλ/βD cosθ) (D = particle size in nanometers, λ = 1.5418 Å for CuKα radiation, k = 0.94, βD = peak width at half maximum intensity, and θ = peak position) (Zak et al., 2011) has been utilized to determine the particle size of InxSe1-x crystals by the X-ray line broadening method. The breadth of the Bragg peak is a combination of both instrumental as well as sample dependent effects and hence to determine the instrumental broadening, it is necessary to collect a diffraction pattern from the line broadening of a standard material such as silicon to decouple these contributions (Hosseinzadeh, Baedi, & Khorsand Zak, 2014). The equation given below gives the instrumental line broadening βD with respect to the diffraction peak (Venkateswarlu, Bose, & Rameshbabu, 2010).

The Scherrer's equation is utilized to determine the crystallite size of material only and not the strain present in the material. The crystallite size of InxSe1-x crystals has been determined using the Scherrer's equation.
2.5.1 Uniform Deformation Model (UDM)
A noteworthy property of Schrrer equation is its dependency on the diffraction angle θ. The W-H method does not depend upon 1/cosθ as in the Scherrer equation, but instead varies with tanθ. The fundamental difference allows for a separation of reflection broadening due to occurrence of both small crystallite size and micro-strain together (Christy, 2013). Hence W-H method is suitable for calculating the strain and crystallite size of InxSe1-x crystals. Strain-induced broadening βs occurring from crystal imperfections and distortion are given by the relation as follows (Venkateswarlu et al., 2010),
Rearranging equation (11) gives the following relation,
Equation (12) represents UDM (Uniform Deformation Model), where ε is the strain of the material which is assumed to be uniform in all the direction, thus taking into account crystals isotropic nature, where all the material properties are autonomous of the direction beside which they are measured (Kumar & Hymavathi, 2017). Plots were drawn between 4sinθ and βcosθ as shown in Figures 3(a) and 3(b), respectively. Consequently, the slope and yintercept gives the strain and crystallite size respectively. The plot shows negative slope leading to negative strain. This negative value may be due to the tensile strain in InxSe1-x crystals (Senthilkumar, Vickraman, Jayachandran, Sanjeeviraja, 2010).
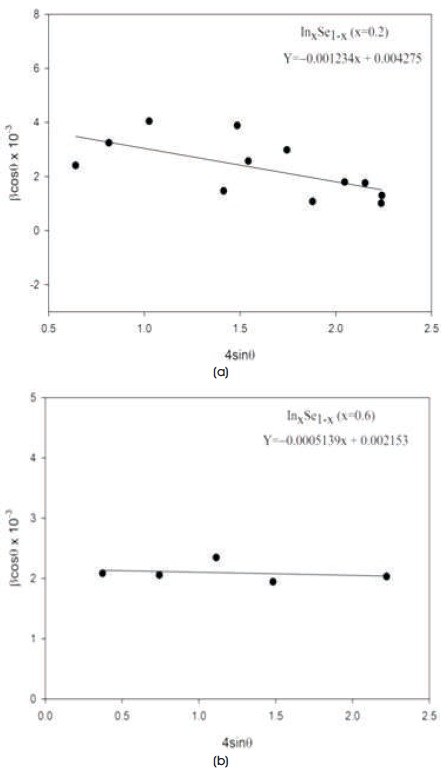
Figure 3 (a). The UDM Plot of InxSe1-x (x=0.2) Crystal (b) The UDM Plot of InxSe1-x (x=0.6) Crystal
2.5.2 Uniform Stress Deformation Model (USDM)
Hook's law states that there exists a linear proportionality relation between stress (σ) and strain (ε) respectively within the elastic limits given by following relation,

where E is the modulus of elasticity or Young's modulus. This equation is just an estimation that is valid for a considerably small strain. Assuming a small strain to be present in the InxSe1-x crystals and the lattice stress to be uniform, Hooke's law can be used here. With a further increase in strain, the particles deviate from this linear proportionality. Hence by assuming lattice stress to be uniform in the second term of equation (12) and replacing it by ε=σ/E, the modified equation is written as (Emil & Gürmen, 2018),
Young's modulus (Ehkl) for a hexagonal crystal is given by the following relation (Kalita & Kalita, 2017):
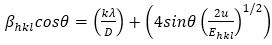
where S11, S13, S33, and S44 are the elastic compliances of InxSe1-x crystals with values of 0.948 x 10² (GPa)-1, –0.419 x 10² (GPa)-1, 2.742 x 10² (GPa)-1, 5.942 x 10² (GPa)-1, respectively (Prabhu et al., 2014). Young's modulus (Ehkl) for InxSe1-x (x=0.2) crystals is calculated as ~75 GPa and for InxSe1-x (x=0.6) crystals is calculated as ~36 GPa. USDM plots were drawn for InxSe1-x crystals as shown in Figures 4(a) and 4(b). The slope of the fitted line gives the stress of the crystals and the y-intercept estimates the crystallite size of the crystals.
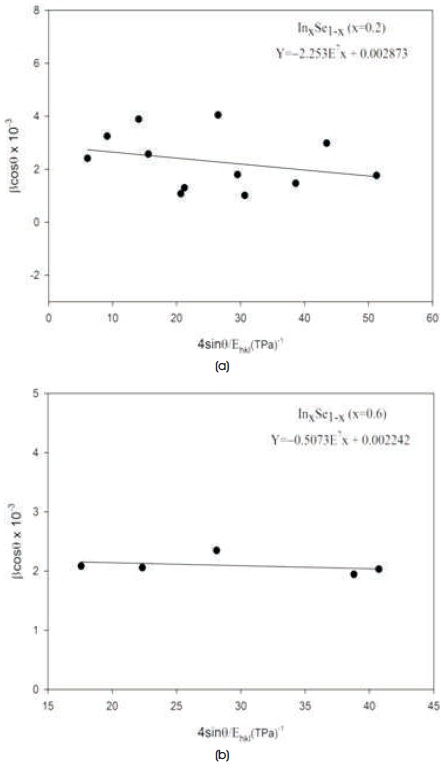
Figure 4 (a). The USDM Plot of InxSe1-x (x=0.2) Crystal (b) The USDM Plot of InxSe1-x (x=0.6) Crystal
2.5.3 Uniform Deformation Energy Density Model (UDEDM)
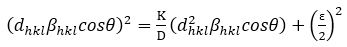
The anisotropic energy density (u), energy per unit volume, as a function of strain (ε) is u=ε2Ehkl/2 as per Hooke’s law. The anisotropic nature of the crystal is considered in UDEDM model (Mote, Purushotam, & Dole, 2012). However when u is considered, a constant of proportionality associated with the stress-strain relation is no longer independent. Therefore, equation (12) can be customized to the form (Irfan, Mohamed Racik, & Anand, 2018):
A plot is drawn between βhklcosθ versus 4sinθ (2/Ehkl)1/2 (Figures 5(a) and 5(b)) and the line was fitted to estimate the slope and the y-intercept. The slope gives the anisotropic energy density value and the y-intercept gives crystalline size of InxSe1-x crystals. The strain (ε) was estimated from the relation σ/Ehkl. The relation between anisotropic energy density (u) and stress (σ) is given by the relation u=σ2/(2Ehkl).
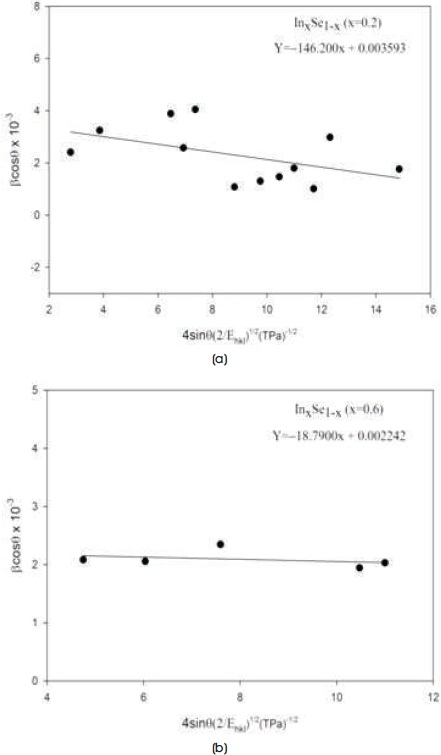
Figure 5 (a). The UDEDM Plot of InxSe1-x (x=0.2) Crystal (b) The Size-Strain Plot of InxSe1-x (x=0.6) Crystal
The line broadening is essentially isotropic corresponding to the W-H plots. This specifies that there was a micro-strain contribution and the diffracting domains are also isotropic. However, a better assessment of the size-strain parameters is obtained by considering an average Size- Strain Plot (SSP) in cases of isotropic line broadening, which has the advantage as less authority is given to data from reflections at high angles having lower precision. Size–strain plot method is suitable for the isotropic nature of the crystal structure (Zak, Majid, Abrishami, & Yosefi, 2012). In this approximation, it is assumed that the strain profile is described by a Gaussian function and the crystallite size profile is described by a Lorentzian function and is given as follows (Dadras & Davoudiniya, 2018),
where K is a constant depending upon the shape of the particles (for spherical particles it is given as 4/3). The plot of (dhklβhklcosθ)2 versus (d2hklβhklcosθ) was drawn as shown in Figures 6(a) and 6(b). The crystallite size is determined from the slope of the linearly fitted data and the root of the y-intercept gives the strain. The outcome obtained from the Scherrer's method, modified W-H methods (UDM, USDM, UDEDM), and SSP method are reported in Table 4.
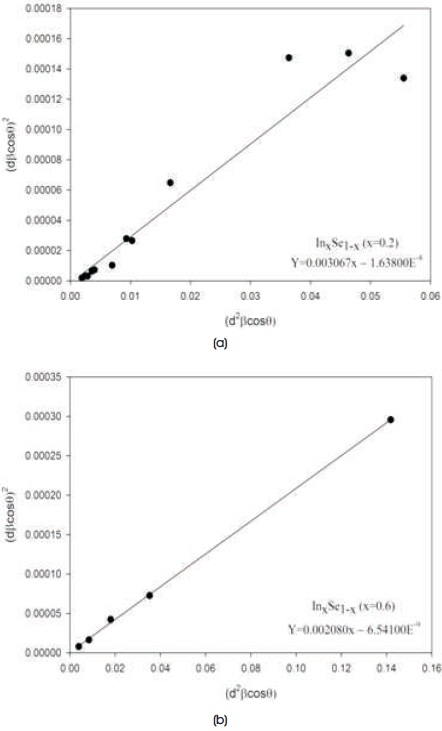
Figure 6 (a). The Size-Strain Plot of InxSe1-x (x=0.2) Crystal (b) The Size-Strain Plot of InxSe1-x (x=0.6) Crystal
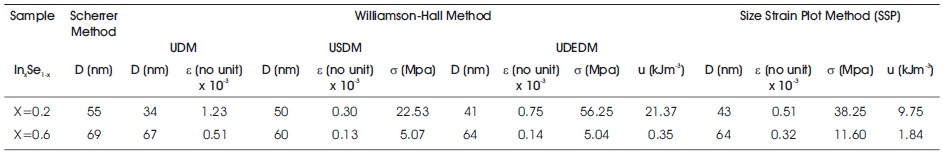
Table 4. Geometric Parameters of InxSe1-x Crystals
For all the Williamson-Hall methods, the slope value is negative for both samples of InxSe1-x crystals indicating the presence of tensile or lattice contraction. Strain value is small for InxSe1-x (x=0.6) crystal compared to InxSe1-x (x-0.2) crystal. The parameters obtained by SSP method are comparable to modified W-H methods for small strain in InxSe1-x crystals (Table 4). The results obtained showed that the mean crystallite size evaluated from the W-H methods are in good agreement with the values obtained from Scherrer's formula and size-strain plot method. Thus, it may be concluded that these models are more pragmatic in the present study.
InxSe1-x crystals have been grown by a Bridgman/Stock-barger method and characterized by powder XRD, EDX, and SEM. The powder XRD patterns of InxSe1-x crystals specify that the crystals have hexagonal structure. The powder XRD pattern of InxSe1-x crystals also indicates the enhancement of crystallinity with increase in Indium content. The line broadening of InxSe1-x crystals (x=0.2 and x=0.6) are due to the small crystallite size and lattice strain. The evaluation of broadening was done by the Scherrer formula, modified forms of W-H analysis and the size-strain plot method. It is concluded from the result that there is a decrease in the value of strain with increase in Indium content of InxSe1-x crystals. The SEM images of InxSe1-x crystals revealed that the crystals have layered structure and are free from microscopic defects like voids, pinholes, peeling, or cracks. The value of crystallite size evaluated using Scherrer's method is in good agreement with the values acquired by W-H and SSP methods.
The authors are thankful to Dr. K. D. Patel for fruitful discussions. The authors are also thankful to SVNIT, Surat for XRD, EDX, and SEM facilities. The authors would like to acknowledge the support by the management of C. B. Patel Computer College and J. N. M. Patel Science College.