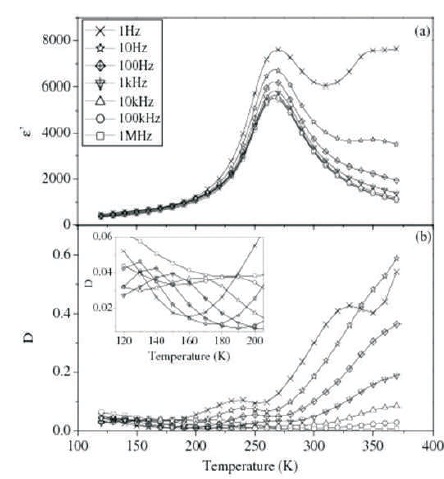
Figure 1. Variation of (a) ε' and (b) D with Temperature at different Frequencies for Ba(Ti0.84Co0.01Sn0.15)O3 (BTCS1) (Inset in Figure (b) shows Enlarged View of D vs. T Plots at Lower Temperature)
In the present paper, effect of cobalt (Co) substitution on dielectric behavior of Ba(Ti0.85 Sn0.15)O3 , which exhibits a broad maxima near room temperature in its ε' vs. T plots has been studied. Compositions with x = 0.01 and 0.03 in the system Ba(Ti0.85-x Cox Sn0.15)O3 were prepared by solid state ceramic method. Dielectric properties of the compositions were studied using Novocontrol α-S High Resolution dielectric analyzer as a function of temperature in the frequency range 1 Hz-1 MHz. Both the compositions (x = 0.01 and 0.03) exhibited a diffuse phase transition behavior similar to x = 0.00. Diffuseness of phase transition was determined by full width at half maxima (FWHM) in ε' vs. T plots. FWHM increases with increasing cobalt substitution. In hysteresis loop measurement, a decrease in coercivity and remanent polarization has been found with increasing Co concentration.
Due to its excellent dielectric (Li et al., 2004; Xu et al., 2009), piezoelectric (Sen et al., 2004) and ferroelectric (Wang et al., 2007; Spanier et al., 2006) properties, Barium titanate (BaTiO3) is the widely used material for electronic ceramics. For many practical applications, it is required to move the very large maxima into ambient temperature range. It is also desired to broaden and diffuse the sharp maxima. Such diffuse transitions are used in almost all practical Z5U and Y5V capacitor dielectrics (Cross, 1994).
With increasing BaSnO3 content, ferroelectric phase transition of Ba(Ti, Sn)O3 becomes diffused drastically (Uchino,1994). An interesting feature of the system Ba(Ti1-x Snx)O3 is that it exhibits normal ferroelectric behavior, i.e. temperature independent maxima at different frequencies for x < 0.08; as a relaxor ferroelectric for x > 0.20. For compositions within the range 0.08 < x < 0.20, it exhibits Diffuse Phase Transition (DPT). DPT behavior is different from both the normal ferroelectrics and relaxor ferroelectrics (Shvartsman et al., 2006). It is characterized by a broad maximum in ε' vs. T plots whose position is independent of frequency of measurement.
To improve temperature stability of Barium Titanate, Nb2O5 , CoO, NiO, MnO, and some rare earth oxides have been doped in it (Padilla-Campos et al., 2015; Mansuri & Mishra, o 2016). The sharp dielectric constant peak at 120 oC observed in BaTiO3, has broadened or diffused due to these additives (Stojanovic et al., 2003; Mazumder & Bhattacharyya, 2004; Tzing et al., 1999; Li et al., 2000; Zhang et al., 2000). Grain growth during sintering is inhibited and a so called “core-shell” structure inside the grain is formed to limit the movement of domain walls when CoO like dopant are doped (Chen et al., 2003). Oxygen vacancies are produced to preserve charge neutrality when Cobalt is doped in BaTiO3 (Cheng et al., 2005).Cheng et al. have reported influence of oxygen vacancies generated by Co doping in BaTiO3 , on its dielectric behavior.
The substitution of Sn and Co independently changes the properties of BaTiO3 significantly. So it was considered worthwhile to study the effect of their codoping on Ti site on the dielectric behavior of BaTiO3. For this purpose, the most technologically potential composition, Ba(Ti0.85 Sn0.15)O3 , having highest dielectric constant in the system Ba(Ti1-x Snx)O3 is chosen (Wang et al., 2003; Markovic et al., 2007). Results of these investigations have been reported in this paper.
Samples were prepared by solid state ceramic method (Singh, 2018). Air dried silver paint was applied on both the surfaces of polished cylindrical pellets, for dielectric and hysteresis loop measurements. Electroded pellets were cured at 373 K for 1 hour. Novocontrol α-S High Resolution dielectric analyzer was used to measure capacitance and dielectric loss in the frequency range 1 Hz to 1 MHz between 120 to 370 K. Stability of the temperature controller is 0.01 oC in the temperature range 120 to 370 K and the accuracy of dielectric analyzer in the frequency range 1 Hz to 1 MHz is 0.2%. Therefore, the data reported are all within the experimental error. Modified Sawyer Tower Circuit was used for measurements of hysteresis loop at room temperature.
Plots of ε' and dielectric loss (D) vs. T for BTCS1 and BTCS3 at different frequencies are shown in Figures 1 and 2, respectively.
Figure 1. Variation of (a) ε' and (b) D with Temperature at different Frequencies for Ba(Ti0.84Co0.01Sn0.15)O3 (BTCS1) (Inset in Figure (b) shows Enlarged View of D vs. T Plots at Lower Temperature)
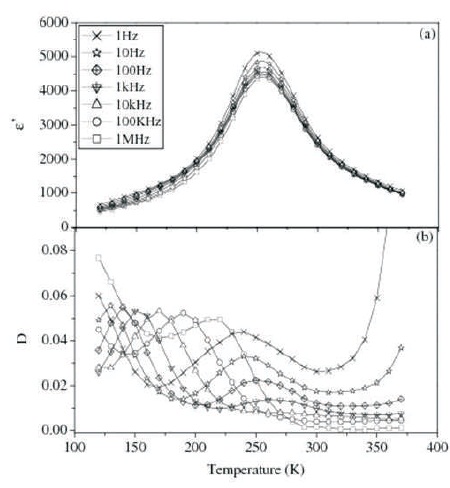
Figure 2. Variation of (a) ε' and (b) D with Temperature at different Frequencies for Ba(Ti0.82Co0.03Sn0.15 )O3 (BTCS3)
ε' vs. T plots for both the compositions show that value of ε' increases gradually to a maximum value (ε'm ) with increase in temperature upto a particular temperature, Tm and then decreases smoothly. There is no detectable shift in the value of Tm with frequency. In all the compositions, the dispersion in dielectric constant is maximum around Tm . Two peaks are observed in D vs. T plots of BTCS1 and BTCS3 as shown in Figures 1(b) and 2(b), respectively.
First peak is found near Tm while the second peak is at a temperature lower than Tm . The peak near Tm is attributed to diffuse phase transition. Second peak in BTCS1 and BTCS3 is due to another dielectric relaxation process.
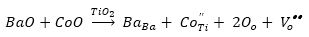

Substitution of cobalt at Ti site will lead to generation of oxygen vacancies according to equations (1) and (2). These positively charged oxygen vacancies, Vo.. will form dipole with negatively charged Co''Ti /CoTi' sites. These dipoles can rotate about CoO6 octahedra by jumping of oxygen ions, O2- into oxygen vacancies leading to change in orientation of dipoles (Jaffe et al., 1971; Nowick et al., 1994). Such dipole relaxation has been observed in Fe, Ni, Co, and Mn doped KTaO3 crystal. Nowick et al. have observed two or three Debye peaks for acceptor doped KTaO3 , which also has perovskite structure.
Relaxation time, τ is calculated from the relaxation frequency of lower temperature peak by the relation τ= 1/2πf, where f is the frequency in Hz. Plots of logτ vs. 1000/T are shown in Figure 3.
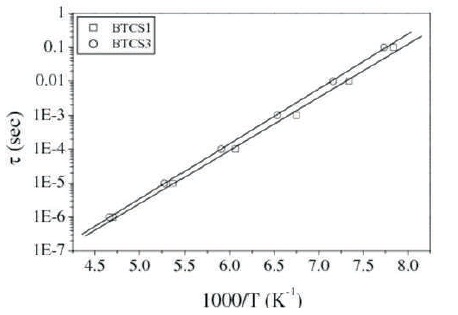
Figure 3. Plot of τ vs. 1000/T for Samples BTCS1 and BTCS3 respectively
These are linear, obeying Arrhenius relationship τ= τoexpEa/kT, where Ea is activation energy for dipole reorientation (Figure 4). Activation energy obtained is 0.31 eV and 0.32 eV for BTCS1 and BTCS3, respectively. These values are similar to those reported earlier for doped KTaO3 as mentioned above (Nowick et al., 1994). Therefore, the peak at lower temperature is due to dipole reorientation. This is supported by the fact that peak at lower temperature in ε'ʹ vs. T or D vs. T does not appear in BTS because it is not expected to have oxygen vacancies in its stoichiometric composition (Singh et al., 2010). Comparison of various dielectic parameters for various compositions are given in Table 1.
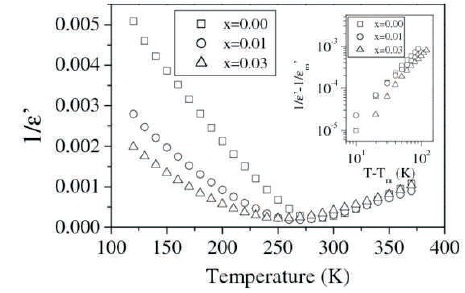
Figure 4. Variation of 1/ ε' with Temperature at 100 kHz for x = 0.00, 0.01, and 0.03 in the System Ba(Ti0.85-x Cox Sn0.15 )O3 (Inset shows Variation of (1/ʹ-1/ʹm) with T- Tm on Logarithmic m Scale at 100 kHz for above Compositions)
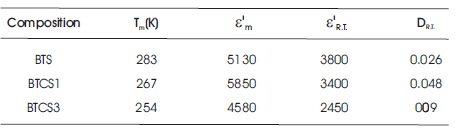
Table 1. Tm , ε'm , Dielectric Constant ( ε'R.T ) and Dielectric Loss (DR.T ) at Room Temperature (300 K) at 1 kHz for Samples in the System Ba(Ti0.85-x Cox Sn0.15 )O3
Tm shifts toward lower temperature with Co doping in BTS (Singh et al., 2010). Co doping on Ti site gives rise to random breaking of Ti-O-Ti linking, which are active links for ferroelectricity. This will decrease Tm . Value of dielectric loss for BTCS1 is larger as compared to BTS while it is very much less in the case of BTCS3 at room temperature. Presence of oxygen vacancies restricts domain wall motion. This may be the reason for decrease in dielectric loss (Newnham, 1983).
FWHM is a measure of diffuseness of phase transition. It is 64 K and 81 K for BTCS1 and BTCS3, respectively at 100 kHz. FWHM has increased by Cobalt doping in BTS (55 K). Increase in diffuseness of transition as compared to BTS may be due to chemical microheterogeneties. The microheterogeneties are present in these materials because of slow nature of diffusion controlled thermochemical method used for their preparation. Different microregions having different chemical compositions will have different Tm . Overall dielectric behavior is enveloped of these different regions. This leads to diffuseness of phase transition (Smolensky, 1970).
It is known that the dielectric constant of a normal ferroelectric follows Curie-Weiss law above their Curie temperature.
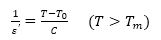
where To is Curie-Weiss temperature and C is a constant. Plots 0 of 1/ ε' vs. T for BTS, BTCS1, and BTCS3 were shown in Figure 4.
Values of Curie-Weiss Temperature for BTS, BTCS1, and BTCS3 are found to be 281K, 262 K, and 251K, respectively. A modified Curie-Weiss law has been proposed to describe the diffuseness of a transition (Martirena & Burfoot, 1974; Uchino & Nomura, 1982).
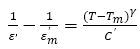
where γ and C' are assumed to be constants. The parameter gives information about the character of the transition. Normal Curie-Weiss law is obeyed for γ= 1. γ= 2 corresponds to relaxor ferroelectric behavior and 1 <γ< 2 to diffuse phase transition. Plots of (1/ε'-1/ε'm ) vs. (T-Tm ) on logarithmic scale for BTS, BTCS1, and BTCS3 are shown in the inset of Figure 4. Value of γ lies between 1 and 2 and Tm remains independent of frequency. This shows that these materials show DPT behavior (Cross, 1994; Jona & Shirane, 1993).
Bobade et al. have plotted normalized dielectric constant against normalized temperature which facilitates an analysis of all the compositions simultaneously (Bobade et al., 2005). Figure 5 shows variation of the normalized dielectric constant with normalized temperature. The shape of the plot in Figure 5 leads us to the same conclusion that the diffuseness increases with increase in amount of doping. This is supported by similar variation of FWHM with amount of doping.
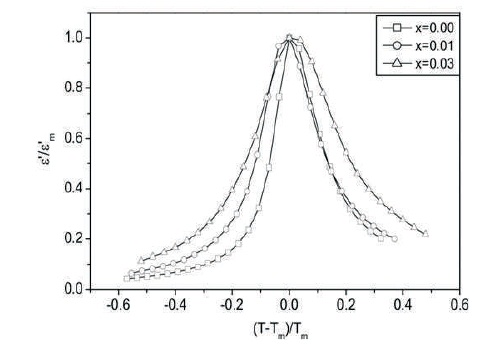
Figure 5. Plots of Normalized Dielectric Constant against The Reduced Temperature (T-Tm )/Tm at 100 kHz
Hysteresis loops for BTS, BTCS1, and BTCS3 at room temperature are shown in Figure 6.
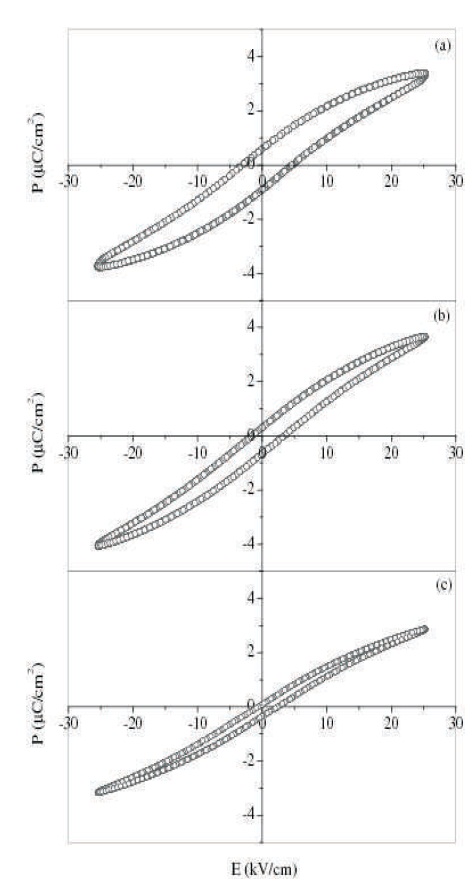
Figure 6. The Polarization (P) vs Electric Field (E) for (a) x= 0.00 and (b) for x = 0.01 and (c) for x = 0.03 at Room Temperature in the System Ba(Ti0.85-xCox Sn0.15)O3
The loops are not symmetrical about origin. Flow of asymmetric current in acceptor doped BaTiO3 and lead zirconate titanate (PZT) has been reported (Lambeck & Jonker, 1978; Jonker & Lambeck, 1978; Takahashi, 1982). Oxygen vacancies are created to maintain electrical charge neutrality on acceptor doping. Oxygen ion vacancy carries an effective positive charge of two. Acceptor dopants on the Ti site carries effective negative charge. This leads to attraction between acceptor ions and oxygen vacancies. These dipoles arrange themselves parallel to the direction of spontaneous polarization, giving rise to internal bias. The internal bias leads to asymmetric flow of current and hence asymmetric hysteresis loop. The remanent polarization and coercivity for these compositions are tabulated in Table 2.
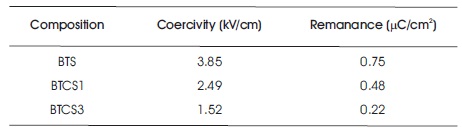
Table 2. Coercivity and Remanance at Room Temperature for BTS, BTCS1, and BTCS3
It can be seen from the table that due to Co doping, remanent polarization as well as coercivity both decrease. Presence of hysteresis loop at room temperature confirms that polar regions are present well above Tm. Decrease in coercivity will reduce the hysteresis loss and make these materials more useful under alternating field as compared to BTS.
ε' vs. T plots exhibit diffused maxima for all the samples and diffuseness of maxima increases with increase in amount of Cobalt doping. So these compositions will be suitable as thermally stable capacitor application. A dielectric relaxation due to orientation polarization is observed in x = 0.01 and 0.03 at low temperatures. Remanent polarization as well as coercivity both decrease with Co doping.
Author is thankful to Prof. Om Parkash and Prof. Devendra Kumar IIT BHU Varanasi, for extending their laboratory facility. Author is also thankful to Prof. K. Funke of Institute of Physical Chemistry, Munster, Germany for providing facilities for dielectric measurements. Acknowledgements are due to Dr Prabhakar Singh, Dr. Om Prakash Thakur, and Ms. Christine Biermann for their help in various measurement.