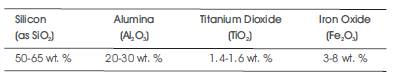
Table 1. Chemical Composition of Cenosphere Shells [3,5,7,8]
Thermal conductivity of a material is a physical property of significant importance in the field of engineering. In the present study, the thermal conductivity of cenospheres have been experimentally determined for particle diameter size ranges of < 105 μm, 105 μm to 180 μm, and > 180 μm using concentric spheres method. The experimentally estimated thermal conductivity of cenosphere has been found to be in the range of 0.128 - 0.365 W/mK which is comparable with literature.
Fly ash Cenospheres are lightweight, inert, hollow spheres filled with inert air or gas, generally produced as a byproduct of coal combustion at thermal power plants [1,2,3]. They are also referred as microspheres, hollow spheres, micro-balloons or glass beads. Cenospheres are hollow microscopic spherical structures and free flowing powders by nature, comprising of silica-aluminum and other minor ceramic elements. They are hard and rigid as well as light, waterproof and insulative. Fly ash is produced on a very large scale and a large fraction remains unutilized due to large buildup of unused material [5] , which would further stronghold its utilization considerably, considering the properties possessed by fly ash cenospheres.
The formation of cenospheres occurs due to the thermochemical and phase transformations of mineral coal. The chemical and phase-mineral compositions of the cenospheres depend on the type and composition of the coal used, the type of furnace utilized for the process and the physical conditions used for cooling melt droplets from the furnace, etc. The content of cenospheres in fly ash varies over a wide range from 0.01-4.80 wt. % and in many other cases range from 0.3-1.5 wt. % [1,2,4]. Cenospheres have a size range from 5–500 μm and an average compressive strength of above 3000 psi. The color may range from white to dark grey. They can also be easily separated by gravitational methods in the form of a concentrate in aqueous media [6]. The typical composition of cenospheres is given in Table 1.
Table 1. Chemical Composition of Cenosphere Shells [3,5,7,8]
Cenospheres have been found out to be extremely resistant to heat and have a melting point temperature in the range of 1600-1800oC [1,2,9]. Cenospheres, due to their alumino-silicate shell are particularly resistant to acidic environments, but like most glasses comprising of similar chemical compositions, they are not resistant to strong alkalis [7].
Cenospheres have distinguishable properties including lightweight and a good packing factor. Due to its size and morphology, Cenospheres also display enhanced insulation properties, reduced shrinkage, low water absorption and have an excellent mechanical strength [8,10]. Good thermal resistance, a high grade of chemical inertness and good electrical properties are some of its other notable traits [8].
The present study deals with the assessment, if there are noticeable changes in the thermal conductivity of Cenospheres as the particle size differs, as well as to utilize the obtained information of applications for commercial and industrial usability.
Fly ash Cenospheres were obtained from Vipra Ferro Alloy Pvt. Ltd., Nagpur. It was sieved for a period of 3 minutes for every 200 gm of the material using B.S.S. rated sieve sets. The size differentiated material was separated using sieves, rated 85 mesh B.S.S. and 150 mesh B.S.S. for the corresponding sizes of 180 μm and 105 μm, respectively.
The experimental setup consists of concentric copper spheres with an inner radius of 0.05 m and an outer radius of 0.1 m. Heating apparatus, in the form of a nichrome coil, is fitted at the inner surface of the inner sphere. A set of eight Chromel-Alumel thermocouples are used to measure the temperature at various points near the inner and outer vicinities of the surfaces of the spheres. The thermocouples at the outer surface are positioned in a manner that the sensing junction is near the outer periphery of the material layer. A dimmer stat is used to adjust the voltage and current, for various power input. A digital display was used for temperature, voltage and current readings (Figure 1).
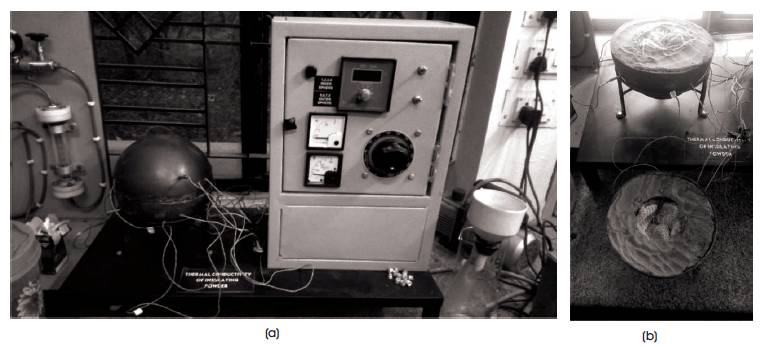
Figure 1 (a) Completed Concentric Sphere Apparatus along with Voltage and Current Control Setting and (b) Region between the Spheres filled with Cenospheres of a Particular Particle Size Range
Cenosphere of a given particle size diameter was packed into the region between the spheres by using 20 ml of water per 150 gm of material, ensuring that minimum air gaps are present, which would serve as a source of error. The material was then left to dry under heated conditions, for a period of approximately two days.
The heat input was adjusted using the dimmer stat, starting from zero to the desired setting by noting the readings on the ammeter and voltmeter. It was ensured that the power input during the experimental analysis remains constant throughout.
The temperature readings at time intervals of 15 minutes between each reading were noted and correspondingly, the final steady state temperatures were measured. The steady state temperatures were the readings obtained when the temperatures measured using the thermocouples remain constant with respect to time. Here, it was assumed that steady state conditions were achieved when the readings were found to be constant for a period of 45 minutes or more.
The thermal conductivity of the specific material was determined using Fourier's law of heat conduction for spheres. This gives the thermal conductivity for a particular size range under the preceding conditions.
Thermal conductivity is a critical property of a material in heat transfer and other allied studies. There is always a need to find out newer materials that can be used in various industries and equipment for their better functioning and usability, as well as for better efficiency of any process.
When heat is applied to a portion of a material, that heat will move through the material. This movement of heat through a material is called thermal current. Depending on the composition of the atoms of that material, the heat may move very slowly, or it may move very quickly. This dependence is quantified by the 'Coefficient of Thermal Conductivity'. Each material has a unique coefficient of thermal conductivity. A high coefficient implies that heat is transported across the material very quickly; subsequently, a low coefficient would signify that heat moves very slowly [15,16].
It is known that the particle size of the powder and the amount of heat supplied plays an important role in the actual value of thermal conductivity[11,12,13]. Voltage and air gaps present between the spherical particles also affect the obtained experimental values of thermal conductivity. As the air gaps increase due to higher voltage, the effective thermal conductivity will vary correspondingly.
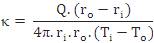
In the present study, the method of concentric spheres was used to determine the thermal conductivity of Fly ash Cenospheres. The transfer of heat occurs by heat conduction through the inner wall of the hollow sphere, along the layer of insulating powder packed between the two copper shells. Using Fourier's Law of Heat Conduction for spherical surfaces, the expression can be given [15,16,17]:
Where,
Q-Heat energy supplied to the system (in watt, W)
ri -inner radius of sphere (in meter)
ro -outer radius of sphere (in meter)
Ti -average temperature of the inner surface (near periphery
of the material) (in oC)
To -average temperature of the outer surface (near the
border of the material) (in oC)
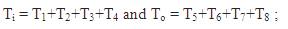
T1 , T2 , T3 , T4 are the temperatures noted by the thermocouples at the inner surface, and T5 , T6 , T7 , T8 are the temperatures noted by the thermocouples present at the outer surface of the material.
The thermal conductivity of the insulating powder, Cenosphere has been found out for three different sizes (<105 μm, 105-180 μm and >180 μm) for conditions of variable amounts of heat supplied at a given ambient temperature of the surroundings. These results are tabulated in Table 2.
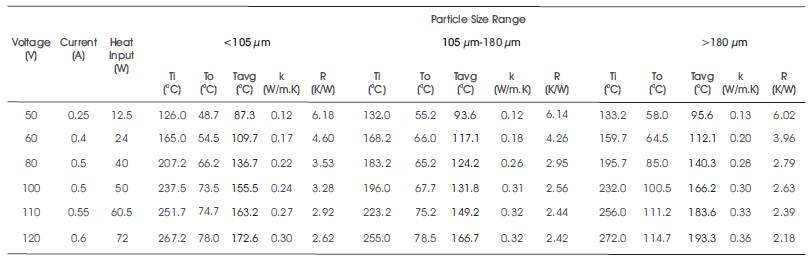
Table 2. Experimentally Obtained Values of Thermal Conductivity with Change in Particle Diameter
For the size range of <105 μm, the thermal conductivity was found to be in the range of 0.12-0.30 W/m.K. Similarly, for the size range of 105-180 μm, the thermal conductivity was found to be in the range of 0.12-0.32 W/m.K and for >180 μm, in the range of 0.13-0.36 W/m.K. These values correspond with the experimental readings obtained by Rohatgi, et al., which is approximately in the range of 0.06- 0.35 W/m.K, as given in Table 3. Thermal resistance also exhibits a decreasing trend, regardless of particle size range.
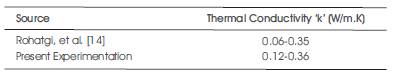
Table 3. Comparison of Thermal Conductivity Values
It is noted that for a given value of heat input, the thermal conductivity is usually found to increase as the particle diameter increases, as seen in Figure 2. This may be due to the presence of air voids between the surrounding particles that serve as a source of decrease of thermal resistance. This would allow the transfer of heat through the material layers with relative ease, as compared to those systems with a higher packing ratio. These findings are also consistent with those found in several literature based on thermal conductivity of powders. Also, for thermal conductivity compared to the average temperature of the system, a positive correlation is noted, as observed in Figure 3.
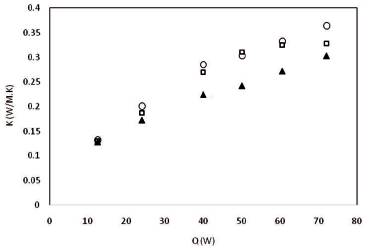
Figure 2. Variation of Thermal Conductivity as a function of Heat Input for different Particle Size Ranges selected
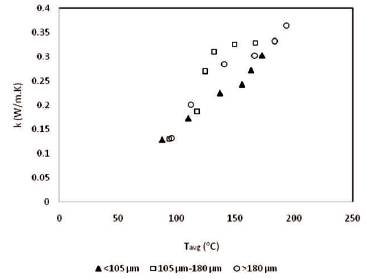
Figure 3. Variation of Thermal Conductivity with Average Temperature of the System
The variation of thermal conductivity of fly ash cenospheres has been investigated for variable particle size ranges considering different heat input values. The thermal conductivity was found to increase with temperature difference which would eventually attain a constant value. Thermal conductivity has been found to be in the ranges of 0.12-0.30 W/m.K for <105 μm diameter of particles; 0.12- 0.32 W/m.K for the size range of 105-180 μm and 0.13-0.36 W/m.K for the size range of >180 μm. These comply with the values obtained by other independent researchers.
The thermal conductivity obtained in the present study is well comparable with literature. Hence, it can be used for various heat transfer applications. These applications range from usage as fillers, insulating materials to composite materials incorporating Cenospheres, where insulating properties are desired.
Further, studies can also be conducted by changing the type of material from which the spheres are fabricated, while also utilizing a higher number of thermocouples for greater accuracy in measuring the average inner and outer surface temperatures, respectively. A larger radius for the outer sphere can be utilized, as well, which would imply a greater time period required to attain steady state although more standard readings could be obtained due to uniform distribution of temperature over time.
The authors acknowledge TEQIP-II, VNIT Nagpur for providing financial support to this work.