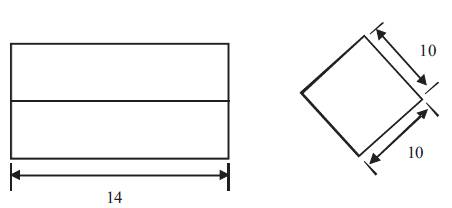
Figure 1. Dimensions (in mm) of sample used for Wear Testing
Austempered Ductile Iron (ADI) in the recent past has established itself as a versatile material for engineering applications with its wide range of tensile strength, yield strength ranging from 850 MPa to 1600 MPa and elongation ranging from 1 – 10 %. The wear performance of ADI is achieved through the special heat treating process on a commercially produced ductile iron with high Manganese (Mn) content which is a characteristic of the ductile iron produced in commercial Indian foundries. The present work shows the ability of ADI produced from commercial grade ductile iron with Mn content as high as 0.22 %, to be used as wear resistant material and the effect of austempering time and temperature on wear behavior of ADI is studied. Wear tests were performed on a pin on disc wear, friction monitoring machine at loads of 20 Newtons (N), 60 N and 80 N for a fixed interval of time (120 min). For better comparison, different grades of ADI are produced by austempered the samples at four different scales of temperatures 250oC, 300oC, 350oC and 400oC for different periods of time 30 minutes (min), 60 min, 90 min corresponding to each temperature respectively. In this paper, attempt has been made to correlate the wear properties of ADI with wear load and heat treatment conditions. Final part of the research work aims at studying the effect of austempering temperature and time on the wear characteristics of ADI. Wear loss (mg) decreases with increase in austempering time, because at the higher austempering time retained, austenite content is higher and as the temperature is increased, wear loss from the sample increases due to decrease in hardness. Wear loss (mg) at higher load (N) is more due to increase in normal reaction, thus friction.
Austempered Ductile Iron (ADI) in the recent past has established itself as a versatile material for engineering applications with its wide range of tensile strengths ranging from 850 MPa to 1600 MPa and elongation ranging from 1 – 10 %. As it belongs to a family of ductile cast iron, which is not known for such high strengths and elongation combinations, it emerges as a sustainable engineering solution, as a material for strategic applications. Recently, ADI has found a new area of application as wear resistant material. ADI emerged as a material of highest interest because of its good combination of properties. Keough & Hayrynen [1] shows that, the relative weight per unit yield strength of ADI is very less as compared to cast aluminium, forged aluminium, cast steel, ductile iron, forged steel and heat treated steel. Same is the case when the relative cost per unit yield strength of various materials are compared and yield strength of ADI lies in the range of 830 – 1500 MPa whereas, that of forged steel and pearlitic ductile iron is in the range of 520 MPa and 480 MPa respectively.
Keough [2] shows that the ADI having fracture toughness of the range 55-70 MPa is required in the case where the structure failed either by brittle fracture or by fatigue, especially in present of crack like defect, and also stated that, ADI with 42-46 HRC has replaced 60 HRC carburized and hardened 8620 steel. Zammit et al. [3] investigated the tribological behavior of shot peened Cu-Ni ADI and they have found that there is no improvement regarding the sliding wear resistance. This result was attributed to the fact that there has been potential advantages in relation to strain induced transformation. Baba zadeh et al. [4] has investigated the wear characteristics of ADI and had used pin on disc machine to calculate the relative wear resistance. They have concluded that, the role of strain induced transformation is more prominent as compared to bulk hardness of the material. Yang et al. [5] investigated the effect of microstructure on abrasion wear behavior of ADI by producing different grades of ADI and stated that the two step austempering process has resulted in significant improvement in high volume fraction of austenite. It also results in significant improvement in abrasion resistance in ADI. Zhang et al. [6] investigated wear and friction behavior of ADI as railway wheel material and, had conducted rolling-sliding wear test. They concluded that increase in subsurface hardness is due to work hardening and strain hardening transformation of retained austenite to martensite. Yang et al. [7] investigated the influence of two step austempering process on the strain hardening behavior of ADI and they have observed a remarkable increase in hardness, tensile strength and yield strength. Putatunda et al. [8] studied the development of ADI by producing different grades of ADI and concluded that, ADI sample austempered at 260oC and subsequently tempered at 484oC gives better mechanical properties as compared to samples austempered at 316oC and 385oC. Chang et al. [9] studied the effect of heat treatment on erosion behavior of ADI by conducting number of tests at different levels of temperature for both austenitization and austempering process. They concluded that, higher austempering temperature tends to be more erosion resistant. Dundar [10] analyzed the rolling and sliding behavior of ADI used for making railway wheels as when compared to steel and also stated that, ADI exhibits three times higher damping capacity and promises a decrease in travelling noise. Also having 10% lower density (because of graphite nodules as compared to steels) allows lower weight components. By var ying heat treatment parameters, austempering time and temperature, a specific set of properties can be achieved. The next section highlights the experimental work.
In this section, the procedure used for sample preparation has been explained along with the details of testing method. Various tests has been conducted such as wear test, hardness test, and micro hardness test.
The liquid iron is produced in the induction furnace. The melting of the charge includes ductile iron, grey cast iron returns, pig iron and mild steel punching were also melted. The charged iron is heated upto 1500oC. Calcium carbide (1.9 % by weight basis) is added in order to reduce the sulphur in iron. The standard sandwich treatment method is used to get ductile iron castings. The Molten metal is poured into the sand moulds. The composition of cast ductile iron includes C = 3.48 %, Si = 2.02 %, Mn < 0.22 %, Mg = 0.02 %, Cu = 0.6 %, Ni = 0.02 %, Mo = 0.3 % and the rest is iron.
A total of 39 samples of ductile iron is prepared, of the size 10x10x14 mm, as shown in Figure 1, were machined from block castings. These samples were ground and polished.
Figure 1. Dimensions (in mm) of sample used for Wear Testing
The sample of size 10x10x14 mm was heat treated in a muffle furnace. In order to achieve complete and homogeneous austenitization, the furnace was optimized before using for heat treatment. The alloyed samples were packed in a bed of cast iron chips and wood charcoal, and soaked in the muffle furnace at austenitization temperature (Tγ) of 900oC for 60 min. The maximum temperature achieved in muffle furnace is 1500oC .
After austenitization of the samples at the 900oC in the muffle furnace for 60 minutes, the samples were placed in a salt bath furnace. The contents of salt bath furnace are sodium nitrate and potassium nitrate. The contents of salt bath are properly chosen according to the operating temperature range. In the research part, the operating range is from minimum 250oC to maximum 400oC as shown in Figure 2. Most of the heat extracted during salt quenching is through convection, at uniform rate, so it causes less distortion and more uniform and consistent hardness.
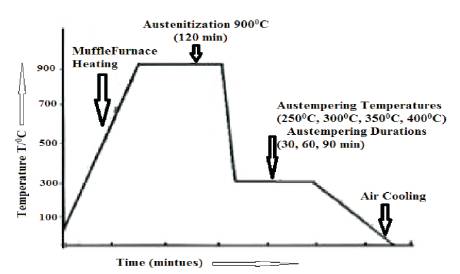
Figure 2. Representation of the Three Step Heat Treatment Process
They were immediately quenched and soaked for three different scales of austempering time for 30 min, 60 min and 90 min at four different scales of austempering temperature (Tα ) 250oC, 300oC, 350oC and 400oC. For austempering, a cylindrical steel pot of 10 liters capacity was used as a salt bath in a box type resistance furnace with top door and well-insulated walls. The salts used in this process were potassium nitrate and sodium nitrate in equal quantity. The bath was continuously stirred. The bath temperature was controlled at ± 5oC. All the samples were quenched in water immediately after being austempered. Details of the conditions of the specimen are shown in Table 1.
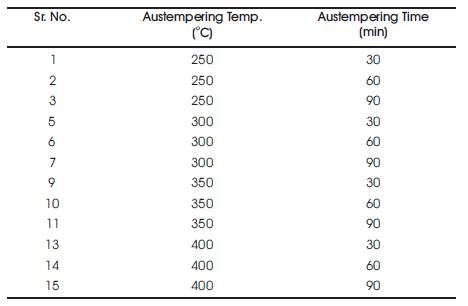
Table 1. List of Austenitization and Austempering Temperature, Time for all Samples
For the microstructural analysis, the samples were cleaned by emery papers of different grades. The average grit size used in this study ranges from 150, 320, 400, 600 to 800 to remove the scaling and scratches. After removing all the scratches, samples were then polished with the help of fine polishing machine in order to produce mirror like finish. After that, etching of the samples was done by using 5% Nital solution. The standard optical microscope is used for microstructure evaluation of all the heat treated samples. Microstructure study has been done to see the variation in the microstructure of samples according to austempering temperature and time using optical microscopy and Scanning Electron Microscope (SEM).
Hardness is the property of a material that enables it to resist plastic deformation, usually by penetration. However, the term hardness may also refer to resistance to bending, scratching, abrasion or cutting. For this testing, Rockwell hardness tester is used and a diamond indenter was pressed against the surface for a dwell time of 10 seconds and a given load. The test cycle is fully automatic. The accurate load is applied on a diamond penetrator (CScale) by means of a lever and weight. After a specific lapse of time, the load is removed automatically. Appendix A highlights the basic principle of Rockwell hardness testing.
Three same grades of ADI corresponding to each treatment are prepared by austempering heat treatment, further wear testing is performed at different wear loads. The loading data for the wear testing of samples is specified in Table 2. There are totally 39 samples out of which 36 are austempered samples and 3 are of ductile iron. The samples are wear tested in order to get the relative wear loss. Wear friction and monitoring machine were used for the wear testing of the samples. The machine was a pin-ondisk type. The two body abrasion test was conducted on 120 meshes alumina abrasive disk in accordance with ASTM standard. Load of the pin against the disk is applied by weights on a pan hanging on a fine steel cable over a pulley and hooked to the arm. The RPM of the disk was constantly kept in order to have heat rejection from both the surfaces at a constant rate. The heat loss from both the pin and disc is by natural convection which means as we increase the RPM of the disc, the rate at which the heat is lost to the surroundings increases, so temperature during the wear testing is taken as constant because of the RPM of the disc. The parameters affecting the wear loss from a given sample under different wear loads are given in Table 3.
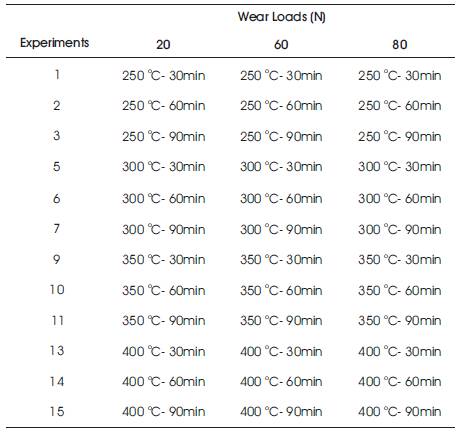
Table 2. Loading Data of all Samples
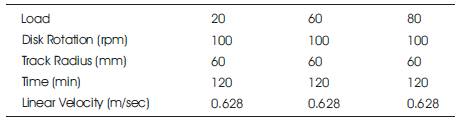
Table 3. Wear Test Parameters
The readings taken were used to compare the wear loss of ADI with changing austempering temperature. The weight loss was calculated by subtracting the initial weight of each sample from its final weight. The units taken for weight loss were milligrams. The weight loss of each sample is compared with its wear loss to study the effect of austempering and austenitization parameters and thus the relative wear loss is plotted against different varying parameters like different wear load and heat treatment conditions.
Same as above, wear testing is conducted for three ductile iron samples of the same size at different loads (20N, 60N, 80 N) in order to predict the change in wear loss, thus relative wear loss is calculated.
After performing the wear operation on a pin on disc machine, measuring the wear loss over the wear surface is analyzed to study the wear tracks. Optical microscopy is used to get the microstructures in order to predict the cause of variation of wear loss with varying heat treatment parameters (Temperature, Time). As soon as the wear testing is completed, the images were taken using optical microscope by cleaning the samples with methanol in order to avoid any corrosion action on surfaces.
After performing wear testing, micro-hardness testing of all the samples is done in order to predict the variation of hardness from surface to the bulk by taking the hardness values at different points from the surface. Samples are prepared by using a vertical milling machine in order to cut down the samples. After cutting down the samples, each sample is polished by using emery papers of different scales to remove the scaling and scratches. After removing all the scratches, samples were then polished with the help of fine polishing machine in order to produce mirror like finish. The reading was taken at a few distance (mm) from the surface towards bulk. Vickers or Knoop hardness is used for testing the worn out samples. It can also be used for metallographic microscope to observe the structure of the material. The dwell time is taken at 10 seconds and the load applied is 100gf. Appendix B highlights the basic principle of microvicker hardness testing.
This section highlights the results obtained from different tests performed. The results have been discussed and compared throughout this section.
Microstructure of as cast-samples, Ductile Iron before and after etching has been shown in Figures 3 (a) and (b) respectively. Microstructure of ADI samples austenitized at 900oC for 1 hour and austempered at 300oC for (a) 30 minutes, (b) 90 minutes is shown in Figure 4. Microstructure of ADI samples austenitized at 900oC for 1 hour and austempered at 400oC for (a) 30 min, (b) for 90 min has been shown in Figure 5.
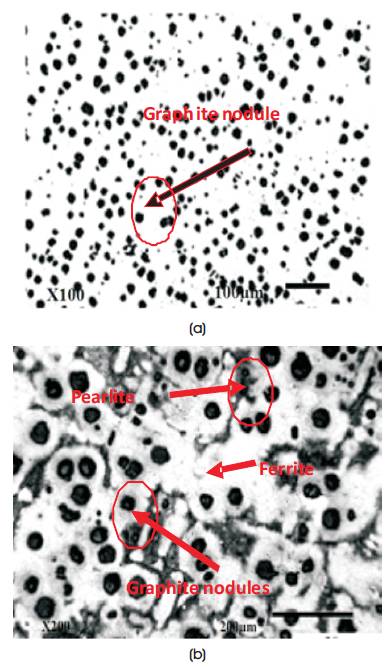
Figure 3. Microstructure of as cast-samples, Ductile Iron (a) Before etching_100X (b) After etching_100X
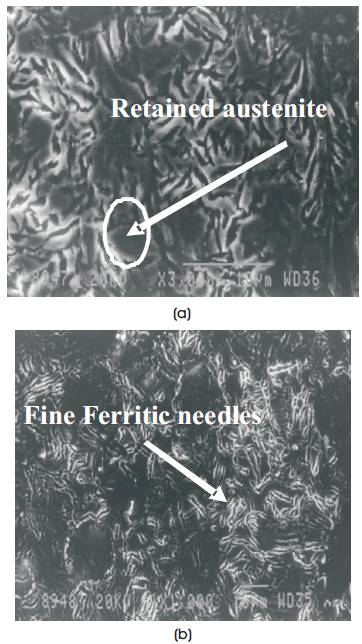
Figure 4. Microstructure of ADI samples austenitized at 900oC for 1 hour and austempered at 300oC for (a) 30 minutes (b) 90 minutes
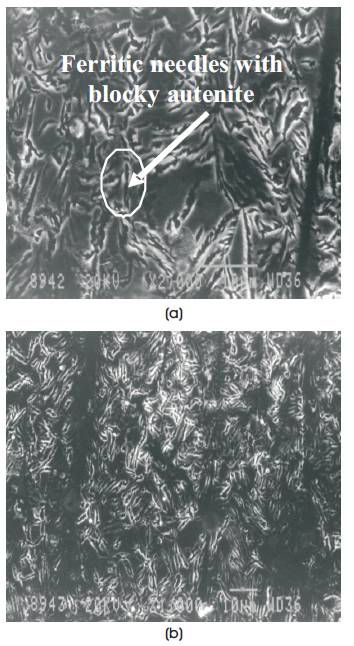
Figure 5. Microstructure of ADI Samples austenitized at 900oC for 1 hour and austempered at 400oC for (a) 30 minutes (b) for 90 minutes
Figure 4 shows the ADI microstructure of ADI at 300oC temperature, the ferritic needles are fine and film surrounding the needle is of high carbon austenite as compared to Figure 5. ADI microstructure at 400oC, having ferritic needles are with blocky austenite. Baba zadeh [11] stated that, with a decrease in austempering temperature, the fineness of the microstructure is clearly seen, the shortening and thickening of bainitic ferrite plates due to increasing austempering temperature results from an increasing ratio of growth rate to the nucleation rate of bainitic ferrite. As the austempering temperature increases, the hardness decreases because at higher temperature (400oC), the committee does not precipitate within the ferritic lathe but in austenite at the lathe boundaries, because of high diffusivity of carbon. But at lower temperature (300oC), the finer plates of carbide formed inside the bainitic ferrite plates will have low angle boundaries and higher dislocation density than earlier case, so it is hard as compared to ADI at 400oC and as the austempering time is increased, the baintic growth also increases. The needle size almost remains the same and retained austenite content also increases with increase in austempering time.
The wear loss for all the samples were calculated after performing the wear test on pin and disc apparatus. The wear loss is measured in terms of weight loss obtained from initial and final weights. Variation in weight loss of ADI is calculated and graphical analysis in done. Figure 6 shows the comparison of wear loss of samples tested at wear loads of 20N, 60N, 80N austenitized at 900oC for 1 hour and austempered at (a) 250oC (b) 300oC (c) 350oC and (d) 400oC, at designated times.
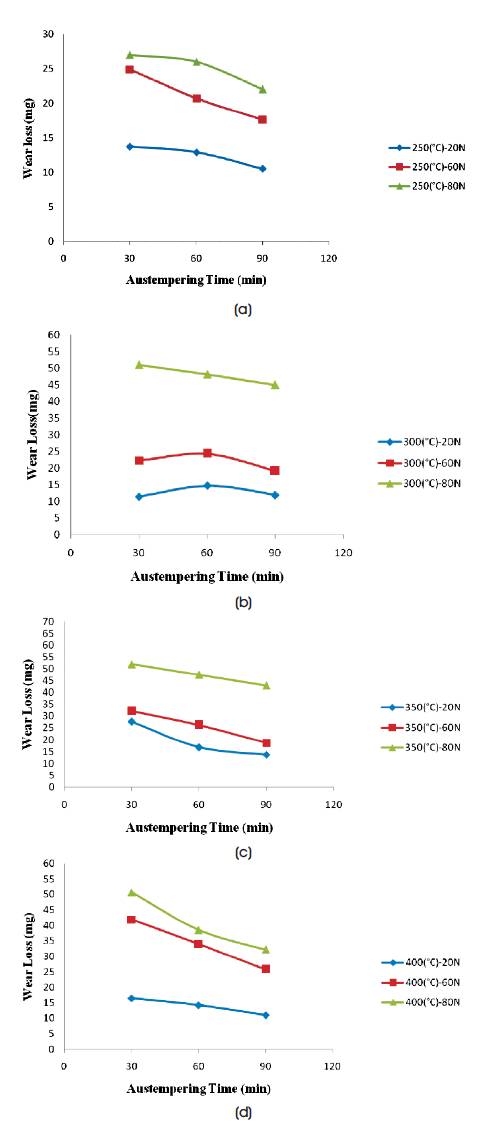
Figure 6. Comparison of Wear Loss of Samples tested at Wear Loads of 20N, 60N, 80N austenitized at 900oC for 1 hour and austempered at (a) 250oC (b) 300oC (c) 350oC (d) 400oC, at designated times.
As the austemepering temperature is increased, the hardness decreases, as a result, wear loss of the sample goes on increasing. The maximum wear loss (mg) of ADI sample austempered at 250oC for 30 min is 27 mg whereas the maximum wear loss in case of sample austempered at 400oC for 30 min is 50.7 mg. Wear loss at lower austempering temperature is lesser as compared to higher austempering temperature due to the presence of fine bainitic structure and lower volume of retained austenite. As the austempering time is increased, the wear loss of the sample goes on decreasing because at higher austempering time, the content of retained austenite is high and, for a given content of retained austenite, higher transformation to martensite is possible at a given load.
Wear Loss is more in the case of higher load, i.e. at 80N for all austempering temperatures and time. The maximum wear loss from sample austempered at 300oC wear tested at 80N is 51 mg, but in case of 20N is 14.7 mg. The increase in load increases the normal reaction, hence the friction, which in turn increases the wear of the sample.
The relation for calculating the wear loss is mentioned below:
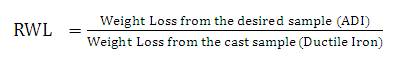
Figure 7 shows the comparison of relative wear loss of ductile iron and ADI samples.
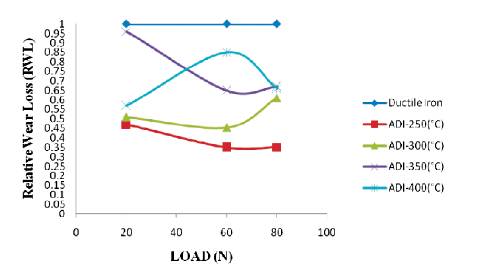
Figure 7. Comparison of Relative Wear Loss of Ductile Iron and ADI Samples
Hardness analysis before wear testing is shown in Figure 8 and gradient hardness after wear testing from the worn surface at 250oC and 400oC is shown in Figures 9 (a) and (b) respectively. From Figure 9 (a), it is evident from the value (620 HV) that, the retained austenite has transformed to martensite, thus shows the presence of transforming layer near from the surface. The retained austenite presence present near by the surface undergoes strain induced transformation due to plastic deformation in the surface layers. Hardness in this transformed region lies in the range of 600 - 800 HV, hardness of the martensite. After a few micron distance from the surface, the hardness value goes on decreasing to bulk hardness of 320 VH and in between, the two deformed regions is present. As the distance from the surface goes on increasing, the hardness value further decreases and reaches the value of hardness in the bulk. At a higher austempering temperature, more is the amount of retained austenite present in the microstructure of ADI and as the load is increased for a given amount of retained austenite, higher is the transformation of retained austenite to un-tempered martensite. At lower temperature (250oC), the retained austenite content is less as compared to higher temperature (400oC) so the transformation at a given amount of retained austenite is very less in this case as shown in Figure 9 (b).
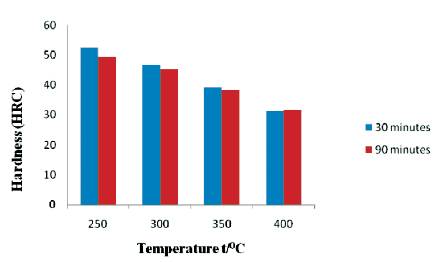
Figure 8. Hardness Testing before Wear Testing
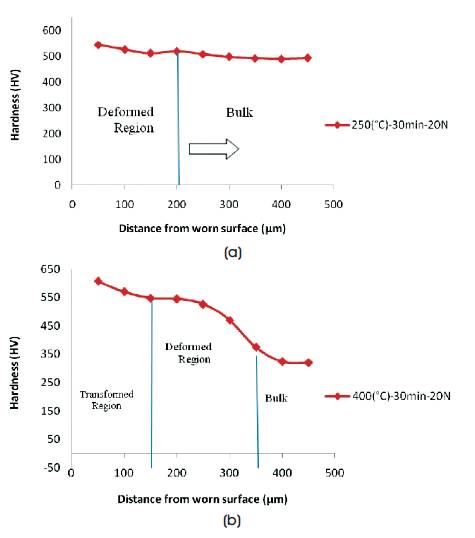
Figure 9. Gradient Hardness after Wear Testing from the worn surface at (a) 250oC -30min-20N (b) 400oC -30min-20N
There is no transformed region (600 – 800 HV), as hardness value lies in the range of 545 VH called as deformed region, and hardness value goes on decreasing as the distance from the surface is increased and attained the value of bulk 490 VH.
Deep scars and widen grooves are noticed in the sample at a higher austempering temperature and an increase in load also increases the size of the scar and its depth. The wear tracks leads to the ejection of graphite nodules from the surface, leaving the pits on wear surface. It also shows that from where graphite pull out have happened, there are tiny pits over the surface. The flow of material into these pits results in formation of wear particles. This is caused by surface adhesion and deformation. The mode of wear is seen to be delamination.
Figures 10 (a) and (b) shows that, at lower temperature, scratches are present all over the whole surface and because of high wear resistance, gauzing action is not possible. At lesser temperature, these grooves are hard in abrasive wear test. Figure 11 (a) shows that, at higher temperature, pits and scars are present and gauging action is clearly seen at 400oC.
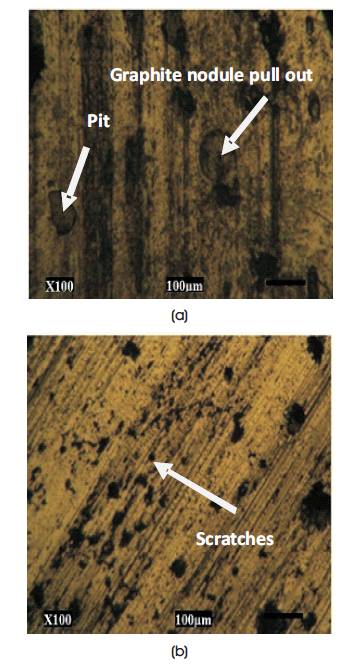
Figure 10. Wear Track of the Sample austempered at 250oC for (a) 30 min (b) 60 min, tested at wear load of 60N
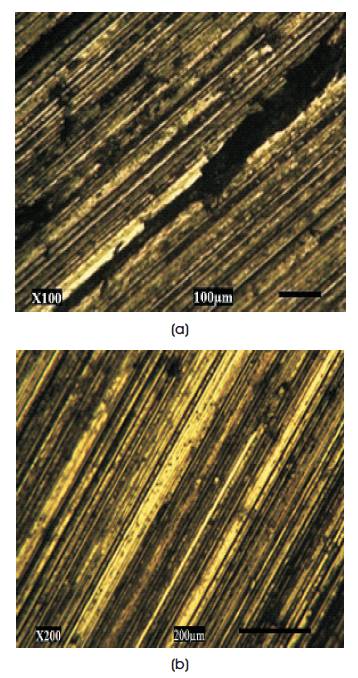
Figure 11. Wear Track of the Sample austempered at (a) 400 C o for 30 min at 80N (b) 300 C for 30 min at 80N
In this work, austempering was done at 250oC, 300oC, 350oC and 400oC for the time interval of 30 min, 60 min and 90 min at all temperatures. Wear properties were measured using a pin on the disk type wear and friction monitor at different wear loads (20N,60N, 80N). From the experimental procedure, it can be concluded that, increase in austempering temperature leads to decrease in hardness. By increasing the austempering temperature (T ) from 250oC to 400oC, hardness values decrease from a 52.46 to 31.32 HRC at 30 min of austempering time. Increase in fineness of bainitic structure and less amount of retained austenite in lower austempering temperature results in less wear loss as compared to higher temperature. The higher is the temperature, more is the content of retained austenite and for a given load, more is the transformation of retained austenite into martensite thus less wear loss (mg). Coarsening of needle size occurs at higher temperatures.
ADI developed at a higher austempering time has more amount of retained austenite. This high carbon austenite undergoes stress induced martensitic transformation. The increase in hardness in wear samples is attributed to the strain induced transformation of retained austenite to martensite. The needle size almost remains the same at higher austempering times. An increase in load increases the normal reaction, hence the friction, which in turn increases the wear loss from the sample. So, the wear volume at higher normal reaction is high. Increase in load also results in increasing the size of scars and their depth and the microstructural observation concludes that, the mode of wear is delamination of the surface.
The Rockwell hardness test method consists of indenting the test material with a diamond cone or hardened steel ball indenter. The indenter is forced into the test material under a preliminary minor load F0, (Figure A.1(a)), usually 10 kgf. When equilibrium has been reached, an indicating device, which follows the movements of the indenter and so responds to changes in depth of penetration of the indenter is set to a datum position. While the preliminary minor load is still applied, an additional major load is applied with resulting increase in penetration, (Figure A.1 (b)). When equilibrium has again been reached, the additional major load is removed, but the preliminary minor load is still maintained. Removal of the additional major load allows a partial recovery, so reducing the depth of penetration, (Figure A.1 (c)). The permanent increase in depth of penetration, resulting from the application and removal of the additional major load is used to calculate the Rockwell hardness number.
HR = E - e
where,
F0 = preliminary minor load in kgf
F1 = additional major load in kgf
F = total load in kgf
E = permanent increase in depth of penetration due to major load F1 measured in units of 0.002 mm
E = a constant depending on the form of indenter: 100 units for diamond indenter, 130 units for steel ball indenter.
HR = Rockwell hardness number
D = diameter of steel ball
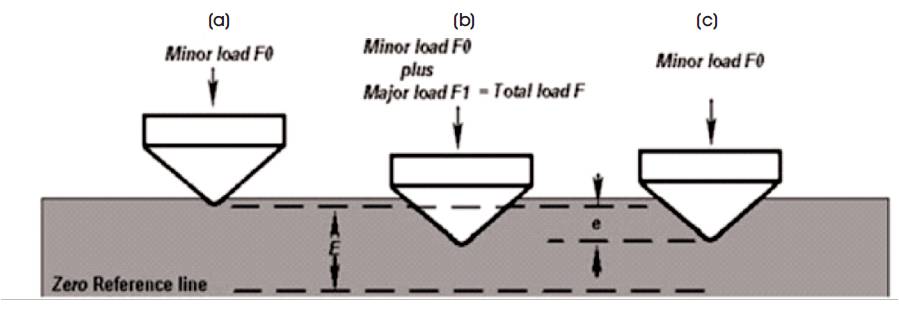
Figure A.1 Rockwell Principle [12]
The diamond pyramid indenter penetrates into the surface of the specimen tested under certain test forces which shall be removed after retained for a certain period of time. After measuring the length of the diagonal lines of the indentation, the hardness value is calculated by the formula. The formula for calculation of hardness varies according to the shape of the indenter, note that the dwell time is taken at 10 seconds and the load applied is 100gf.
In case of micro-Vicker hardness tester, the indenter should be a rectangular pyramid as shown in Figure B.1 whose two diagonals are 136o and the formula is:
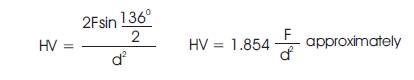
where,
HV- Symbol of micro-vicker hardness (Kgf/mm )
θ= Included angle of the pyramid surface of a diamond conic 136o ,
F - Test force applied to the specimen (Kgf) and
d- Length of the diagonal line of indentation.
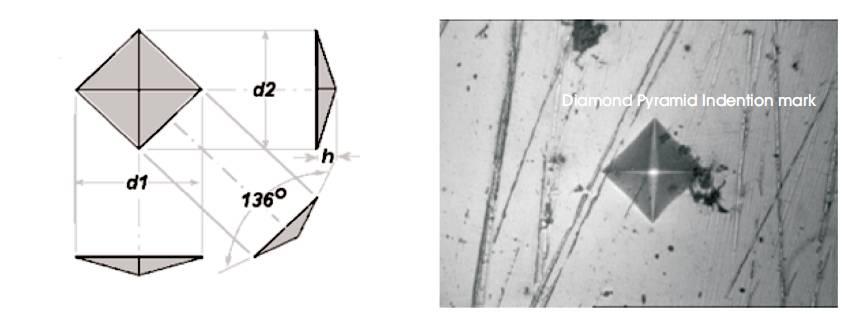
Figure B.1 Mark of indentation on the ADI sample (PEC Courtesy)