(1)
Phosphate glasses with composition 50P2O5-30CaO-(20-x) Li2O-xCeO2 with x varying from 0-2.0 mol % were prepared using the conventional melt quench technique. The amorphous nature of prepared glasses was confirmed from the XRD(X-Ray Diffraction) spectra. The density and Molar volume of the glasses was found using the Archimedes principle. The value of the density lies in the range of 3.58-3.71 g/cm3 . The density of the prepared glasses was found to increase with the concentration of CeO2 . This was explained as the molecular weight of CeO2 is more as compared to the molecular weight of Li2O. The Raman spectra was obtained for the prepared glass samples and it was found that no new peaks are formed with the doping of CeO2 , and only there is a change in the intensity of peaks and the peaks are red shifted. The bandgap energy is found to decrease with CeO2 doping due to the formation of more NBOs.
In recent years, extensive work has been done on rare earth doped phosphate glasses due to the wide range of applications offered by them such as solid state laser hosts, glass to metal seals, optical glasses, bioactive glasses and many more[1-7]. Phosphate glasses are known to possess low melting temperature (as compared to silicate glasses), low glass transition temperature and high thermal expansion coefficient. In addition, phosphate glasses can also exist as ultra, meta, pyro and ortho structural units which facilitate the tailoring of new materials for specific technological applications [8-10]. Rare earth ions are important as they can be used to probe the local structural variations in the host glass matrix due to their 4f electronic configuration. Among rare earths, cerium oxide is known as good UV absorber and it also possesses the radiation damage resistance properties from X rays and gamma rays. Cerium exists as Cerous (Ce3+) and Ceric (Ce4+) states in oxide glasses. In the radiation resistance mechanism, Ce4+ acts as electron traps and Ce3+ acts as hole traps, which avoids the formation of colour centers when the samples are irradiated [11-14]. The solubility of rare earth ions in oxide glasses changes drastically from one glass form to the other. Phosphate glasses can accommodate large amounts of RE (Rare Earth) ions as compared to silicate and borate glasses. RE ions with concentration > 1 mol% are found to form clusters in the silicate glasses. It is proposed that, phosphorus- oxygen polyhedral serves as the solvation shells around the RE ions which helps them to accommodate large concentration of RE ions without phase separation [15-16]. It has been found that 16 times more cerium oxide can be doped in phosphate glasses as compared to the silicate glasses while maintaining the same colour and ability to absorb ultraviolet radiation. In the present research paper, we have synthesised the glass with composition 50 P2O -30 CaO- (20-x) Li2 O-x CeO2 with x varying from 0-2.0 mol %. The glasses are then characterised with UV - Visible and Raman spectroscopy for their optical and structural properties.
The glasses having composition 50 P2O5 -30 CaO- (20-x) Li2O-x CeO2 with x varying from 0 -2.0 mol % were prepared using the conventional melt quench technique. All the chemicals were weighed and mixed in a ball mill to form a homogeneous mixture. This batch was then melted in an electric furnace at 11000C for 1 hour. The melt was then poured onto preheated steel plates to obtain bubble free transparent glasses.
XRD studies of the prepared glass samples were carried out using CuKα radiation with XRD -7000 Shimadzu X Ray Diffractometer at scanning rate of 50 per minute in the range of 200 - 800 .
Density of the prepared glass samples was calculated using the Archimedes Principle with Xylene as the immersion liquid. The density of the samples was calculated using the formula
Where Wa is the weight of glass in air, Wi is the weight of glass in liquid and ρi is the density of immersion liquid. The molar volume of the glasses was found as
The optical absorption spectra of polished glass samples having thickness in the range of 1-2 mm were recorded using double beam spectrophotometer Shimadzu 1601 in the range of 200-1100 nm. These spectra were used to calculate the bandgap energy of glasses.
Raman spectra of polished glass samples were recorded using 488 He-Ne Laser in 400-1500 cm-1 range.
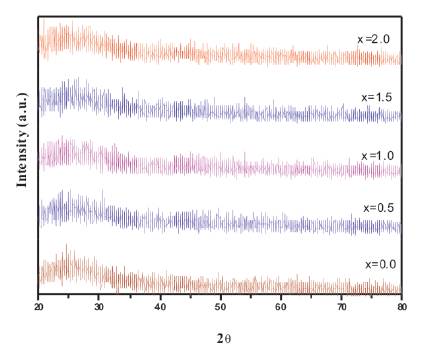
Figure 1. XRD Spectra of 50 P2O5 -30 CaO- (20-x) Li2O-x CeO2
Figure. 1 shows the XRD spectra of powdered glass samples. Absence of any sharp peak in the spectra confirms the amorphous nature of prepared glasses.
Figure. 2 shows the density and molar volume as concentration of Cerium oxide. The density of glass samples is found in the range of 3.58-3.71 g/cm3. The density of phosphate glasses is largely affected by the packing fraction of structural units present. The density of phosphate glasses was found to increase with the CeO2 concentration as the molecular weight of CeO2 is more than that of Li2O. This also shows that with CeO2 addition, the cross linkages between NBOs increase which makes the glass structure more dense. Also, with increase in the concentration of CeO2, the molar volume is found to increase.
Figure.3 shows the UV-Visible optical absorption spectra of prepared glasses in 300- 800 nm range. The characteristic curve for all glasses exhibit the same behavior except the onset value of absorption edge. The absorption edge was found to be red shifted with CeO2 doping. This is attributed to the presence of more NBOs due to CeO2 .
The absorption coefficient α for oxide glasses is related to Eoptical by Davis and Mott [17-18] power law given as
Where B is a constant and n is a parameter having value 2 for glasses. Hence a plot of (αhν)1/2 vs hν gives a curve and if the straight line is extrapolated to x axis, it gives the value of optical bandgap.
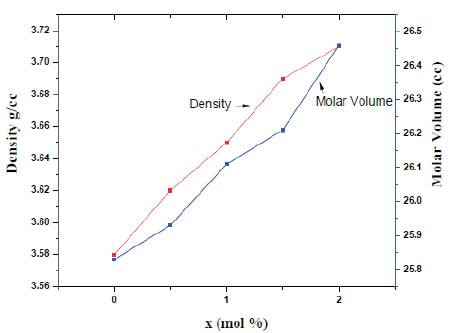
Figure 2. Density and Molar Volume variation with CeO2 concentration
Figure. 4 shows the indirect optical bandgap for prepared glass samples. The optical bandgap energy is found to decrease with CeO2 concentration. This is attributed to the conversion of bridging oxygen atoms to the nonbridging oxygen atoms, which further facilitates the excitation of electrons to higher energy states and thus lowers the bandgap[19].
The value of optical bandgap, density and molar volume is given in Table 1.
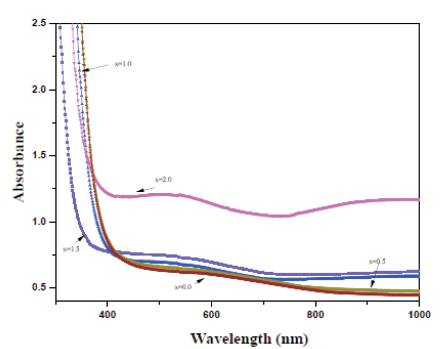
Figure 3. Absorbance spectra of prepared glass samples
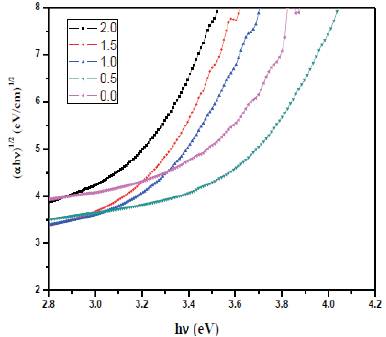
Figure 4. Optical Band gap energy for prepared glasses
Figure. 5 shows the Raman spectra of prepared glass samples. The most sharp and intense band is at 1178 cm-1 and is attributed to the presence of symmetric PO2 vibrations. The band at 1260 cm-1 is assigned to the presence of asymmetric PO vibrations. The weak band at 1024 cm-1 is due to the symmetric (PO3)2- vibrations. The band at 697 cm is attributed to symmetric stretching vibrations of P-O-P linkages. The weak band at 920 cm-1 is attributed to asymmetric stretching vibrations of P-O-P linkages. As the concentration of CeO2 is very low, no new bands are formed. With CeO2 doping, only the intensity of various bands changes [5].
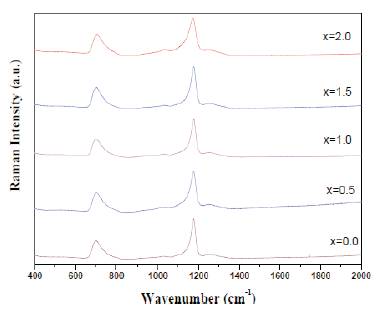
Figure 5. Raman Spectra of prepared glass samples
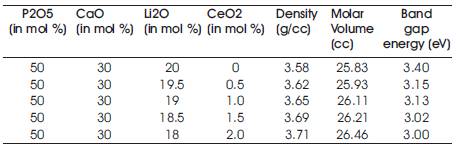
Table 1. Nominal Composition of Prepared glass series with their Density, Molar Volume and Optical bandgap
The density of prepared glass samples was found to increase with cerium dioxide which makes the glass structure denser. In Raman spectra, only slight variation in the intensity of bands was observed with the doping of CeO2 upto 2 mol%. The optical bandgap was found to decrease with CeO2 content due to the formation of more NBOs.
The authors wish to thank Dr. Atul Khanna, Department of Physics, Guru Nanak Dev University, Amritsar for providing facilities like XRD, Raman and UV - Visible spectrophotometer. We are also thankful to Principal DAV College Amritsar for their support.